
Ahead of election and Prop 22 ballot, DoorDash leads with 48%, surpassing Uber Eats + Postmates (35%) and GrubHub (15%)
Food Delivery - Key Takeaways:
With the US Presidential election just two weeks away on November 3rd, Proposition 22 will be on the ballot in California, which will impact labor policies for food delivery and rideshare services alike. Following our last on-demand food delivery report in May, Edison Trends analyzed one million US transactions in report the latest to give a snapshot of both industries ahead of the election.
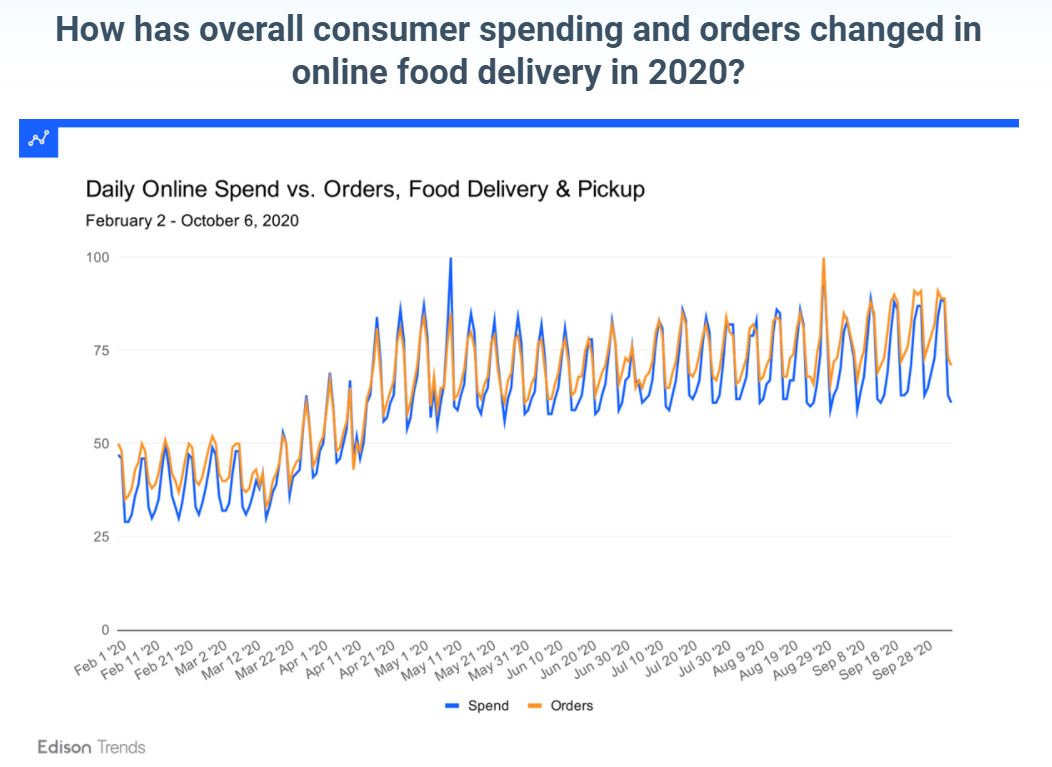
The average online daily spend on food delivery and pickup services in May was 84% higher than it had been in February. Spending has remained steady since then, with the month of September having about the same average daily spend as May. The peak for the year occurred on May 10, Mother’s Day. Spend on that day was 31% higher than the average for the previous three sundays.
Orders followed the same general pattern as spending, with a peak occurring on August 29.
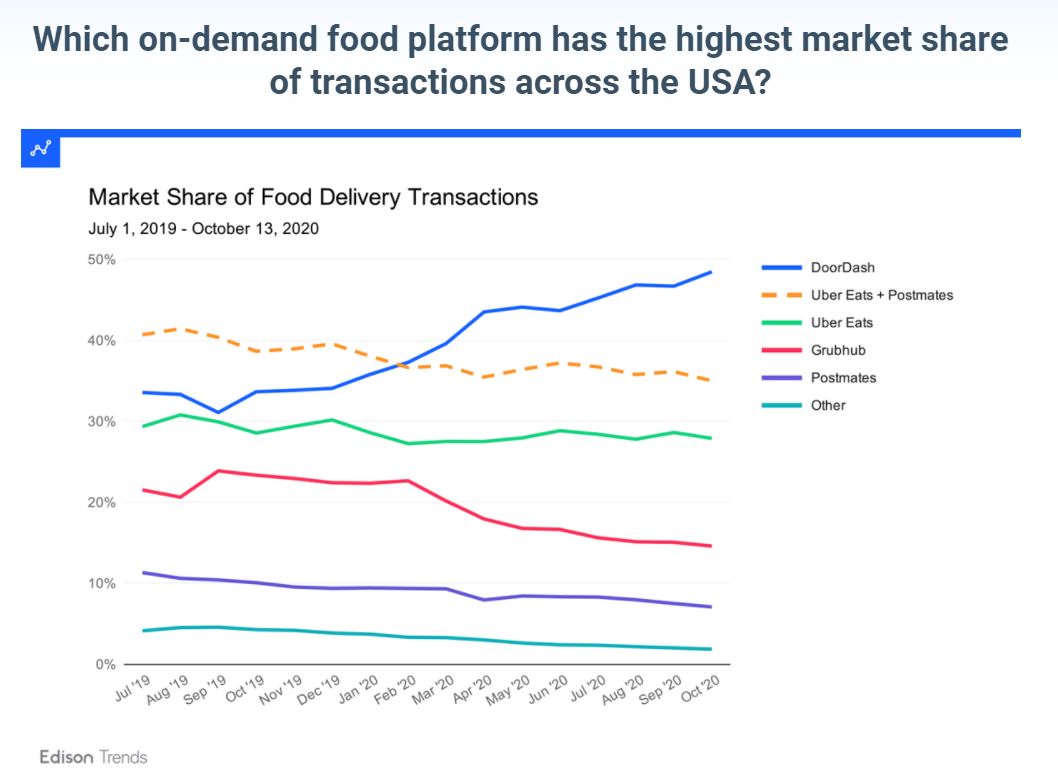
DoorDash (including Caviar) has held the top position over the past year, growing their lead on Uber Eats (which acquired Postmates for $2.8B in July). So far in October, DoorDash is ahead of Uber Eats by 20%, with DoorDash at 48% market share vs. UberEats’ 28% (35% if you add in Postmates’ market share of 7%). Grub Hub is third with 15%. DoorDash has grown rapidly; their October market share has increased 14 percentage points (34% in 2019 vs. 48% now).
Rideshare spend continues its gradual uptick as U.S. cities attempt to reopen.
Rideshare - Key Takeaways:
Since our last rideshare report in July, many states and cities have opened up, encouraging more opportunities to travel and frequent businesses. In the upcoming US Presidential election, Proposition 22 will also impact the fate of rideshare, as well as that of food delivery services, by attempting to shape labor policies more definitively. To see where rideshare is nationally, as well as in some top US cities, Edison Trends took a deep dive into more than 900,000 Uber and Lyft transactions across the country to see how spending has changed since summer.
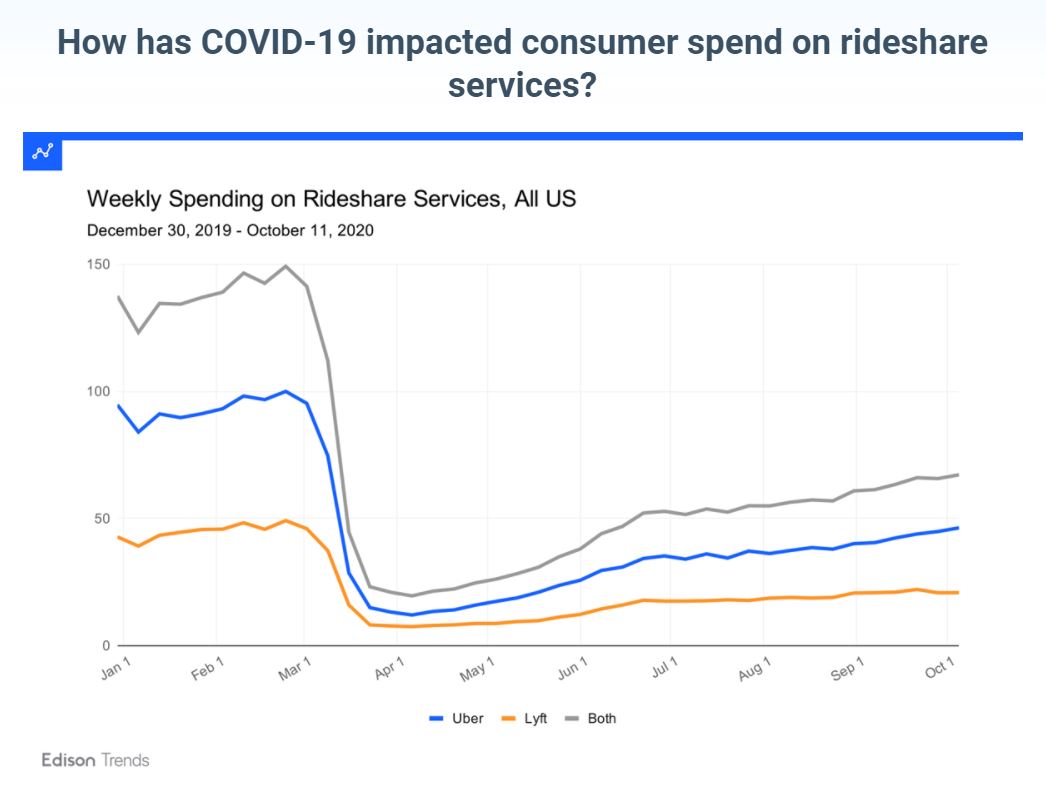
Taking a look at Uber and Lyft sales from across the U.S., the gradual recovery of rideshare is obvious. Uber has regained more ground, in comparison to how far they’ve fallen; as of the week of October 5, they had come back 39% of the distance they’d fallen between their high point in February and their low point in April. Lyft has now come back 32%. Taken together, the two services have regained 37% of the ground they lost.
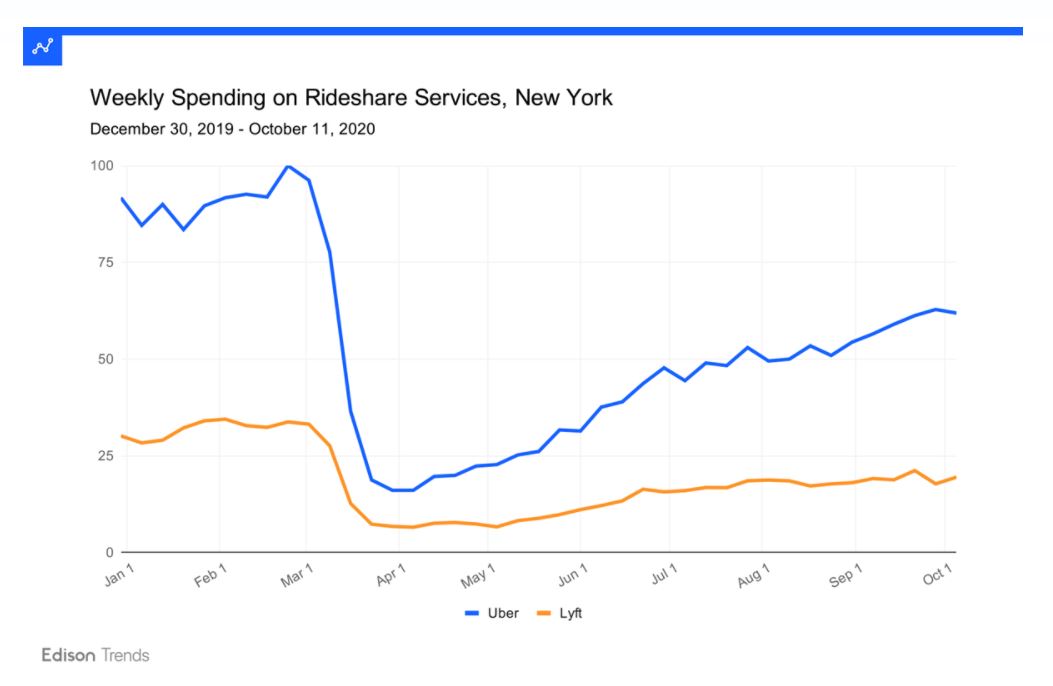
New York has seen the biggest rebound of these four cities. Uber has gained back back 55% of the ground it lost between its February high and its April low, while Lyft has regained 46% of the ground lost between its February high point and its early May low. Uber has seen more growth in later weeks than its rival; from the week of August 24 to that of October 5, Uber rose 21%, while Lyft rose 10%.
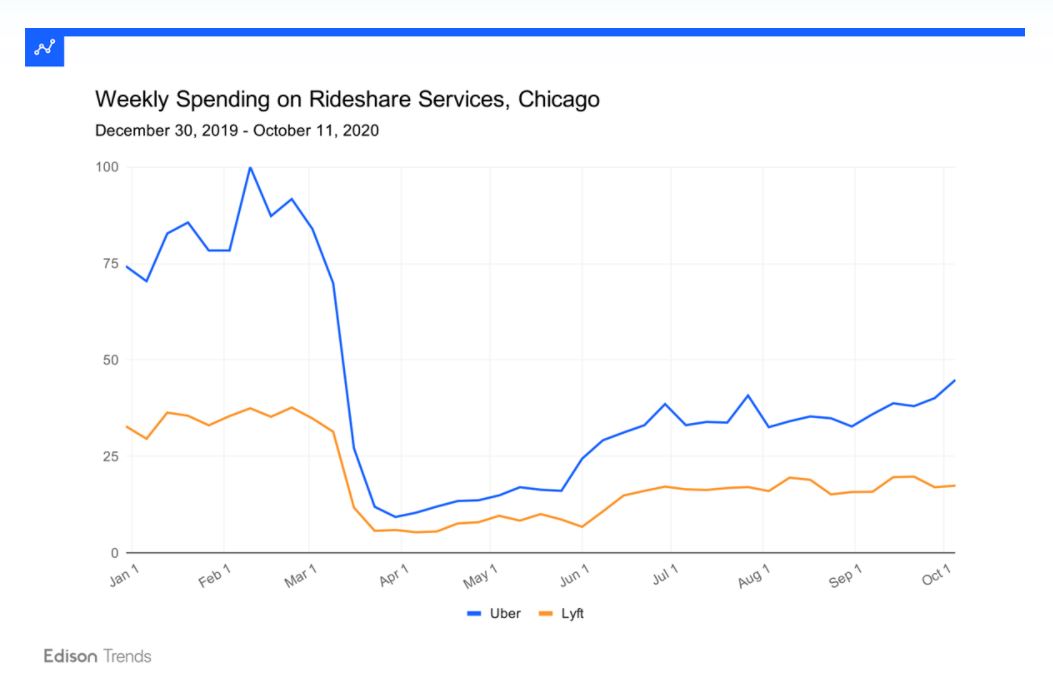 Figure 2b: Chart shows estimated online spending on rideshare in Chicago, between December 30, 2019 and October 11, 2020, according to Edison Trends. The highest weekly spend has been set to 100, and all other values scaled proportionally. This analysis was performed on over 57,000 Uber and Lyft transactions.
In Chicago, Uber has continued to rebound from its precipitous drop in late February and March. Currently, it has come back 39% of the distance it fell between its high point in February and its low point the week of March 30. In the week of October 5, it grew 12% over the previous week.
Lyft has now rebounded 37% of the distance it fell from its February high to its low point, which was also the week of March 30. The service has settled on a plateau for now, with spending hovering around the same level since late June.
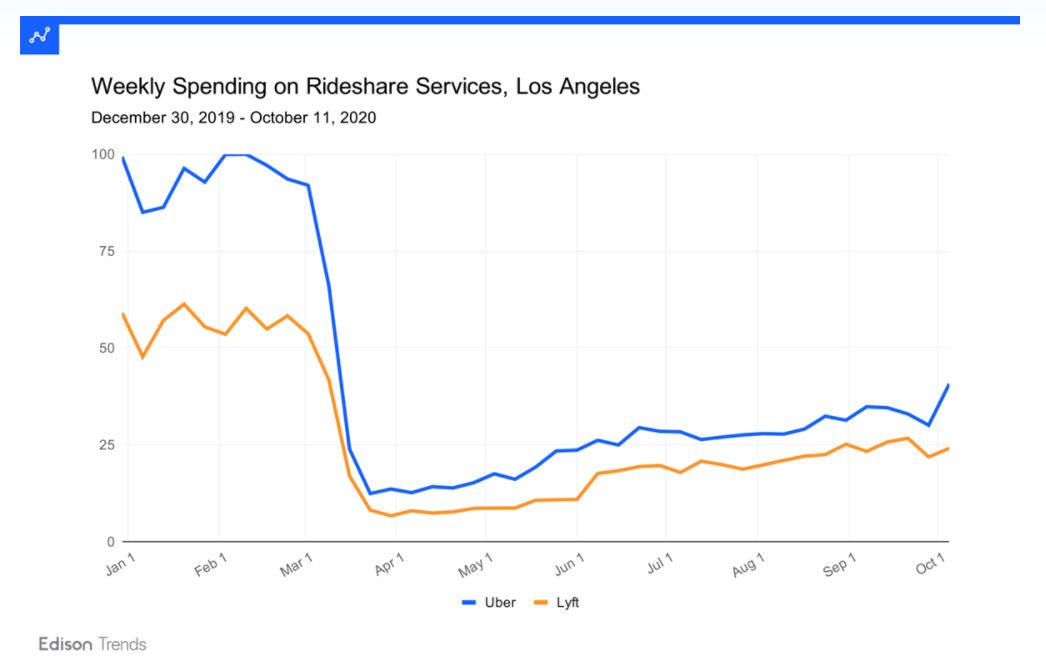
In Los Angeles, Uber has rebounded 32% of the distance it fell from its high point in February to its low point the week of April 6. Spending jumped the week of October 5, rising 35% over the previous week. Lyft has also come back 32% of the distance it fell from its February high to its low point, which was the week of March 30. Both services have seen fairly steady growth since March.
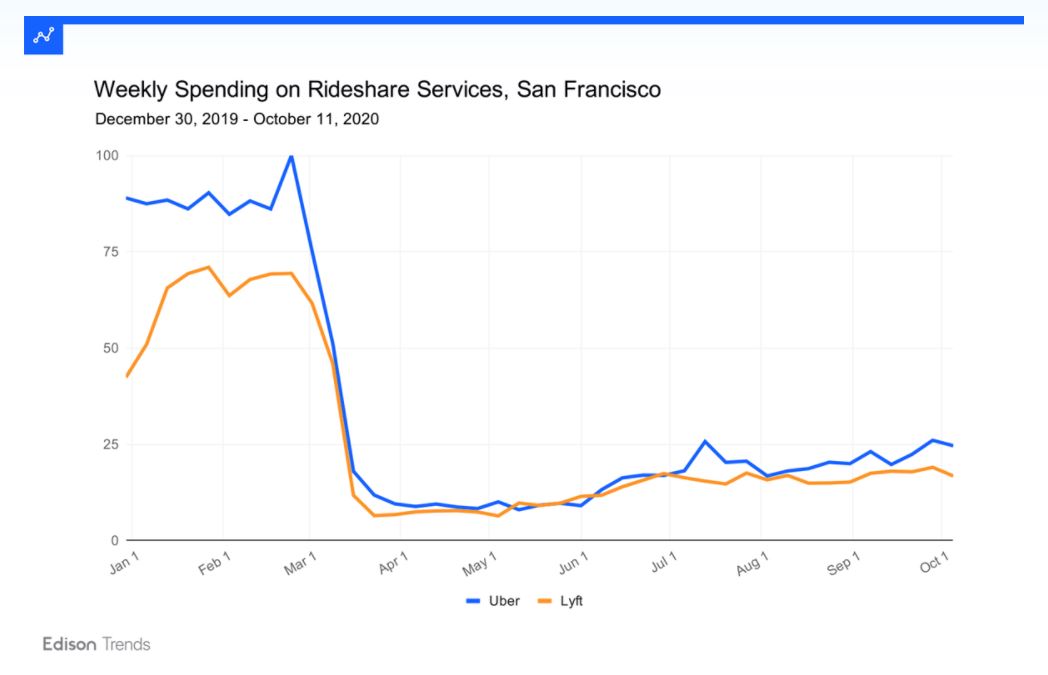
San Francisco has seen the smallest rebound of these four cities. Uber has regained only 18% of the ground it lost between its February high and April low, while Lyft has climbed 16% of the distance it lost between its high point, in January, and its low in March. San Francisco is the only city in which Lyft has eclipsed Uber in terms of customer spending; this occurred during several weeks in May and June.
*The data shown is based on a sample of anonymized and aggregated e-receipts from millions of consumers in the United States.
To learn more about the data behind this article and what Edison Trends has to offer, visit https://trends.edison.tech/.


Sign up to receive our stories in your inbox.
Data is changing the speed of business. Investors, Corporations, and Governments are buying new, differentiated data to gain visibility make better decisions. Don't fall behind. Let us help.


Sign up to receive our stories in your inbox.
Data is changing the speed of business. Investors, Corporations, and Governments are buying new, differentiated data to gain visibility make better decisions. Don't fall behind. Let us help.