What could be more exciting than discovering the most visited websites in the world’s top economy? Well, nothing, as the US often sets the global trend when it comes to the top sites by traffic received.
Based on data from the SEMrush Traffic Analytics tool, this post reveals the top 100 most visited websites in the US, as well as uncovering the top players across various industries.
We will be updating this post on a monthly basis, so you can keep track of all the market shifts and spot changes in user interest.
Top Websites in the US by Traffic
Before getting into the nitty-gritty of the trends within the top US domains, we’d like you to take a closer look at the actual top 100 list.
 With Google as the absolute traffic leader, the report features the obvious top 10, with the likes of YouTube, Facebook, Amazon, and Wikipedia making the list. We will keep an eye on this top 10, although these traffic leaders are unlikely to give way to any other sites in the foreseeable future.
Spotting Common Patterns in the Most Visited Sites List
Rising Interest In Visual Social Platforms
Once we look past the top 10, we can start spotting some position changes. Comparing MoM August vs. September 2020 data, it’s curious to see that social platforms like Instagram and Pinterest are moving up their positions, with Instagram’s position going up by one point and Pinterest’s traffic growing by 2%, moving it up 3 points. Twitter and LinkedIn traffic is down by an average of 16%.
Covid-19 Related Trends
Despite the US economy starting to open up, many Americans still prefer to stay safely at home as talk of a second wave of the pandemic was already starting in September. This seems to have negatively affected traffic to weather sites while increasing traffic share for online shopping as we see Macy’s and Home Depot’s positions go up.
Media vs. Streaming
For industries related to content production, the pandemic has had a huge impact on visitor count.
At the start of the pandemic, traffic to news sites and streaming platforms spiked, rising by an average of 11% for news and 87.6% for streaming sites. As of September 2020, it seems like user interest in entertainment streaming platforms such as Netflix and Hulu is cooling down as media hubs increase their traffic share.
Insights on the Most Common Sites in the US by Industry
Since retail, media, and streaming services are showing the highest MoM position volatility (August vs. September 2020 data), we decided to dig deeper into each industry and uncover their key players.
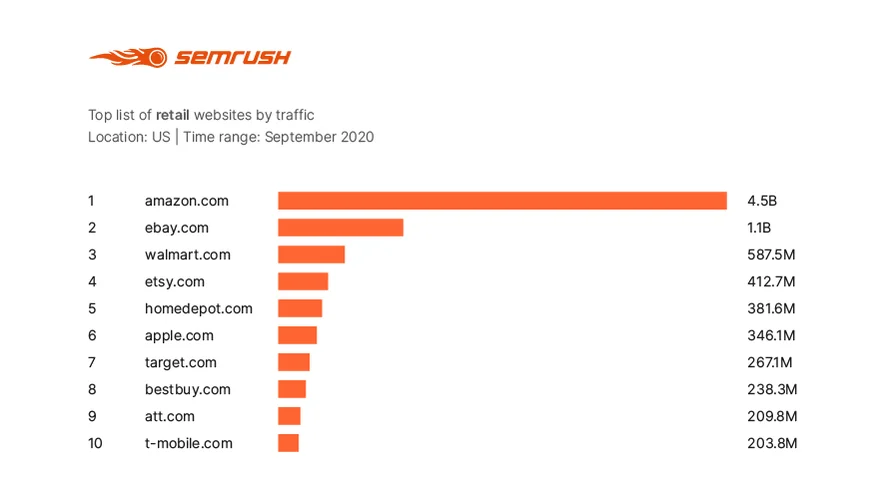
The Most Visited Websites - US, Retail Category

Position wise, things seem to be fairly consistent in the retail industry. Yet, when looking at traffic numbers, we can see that the overall traffic to almost all top retail sites is down. The average decrease stands at 5%, with Amazon losing the highest number of visitors (11.81%), probably due to the significant initial traffic boost shortly after the start of the pandemic.
The Most Visited Websites - US, Retail Category
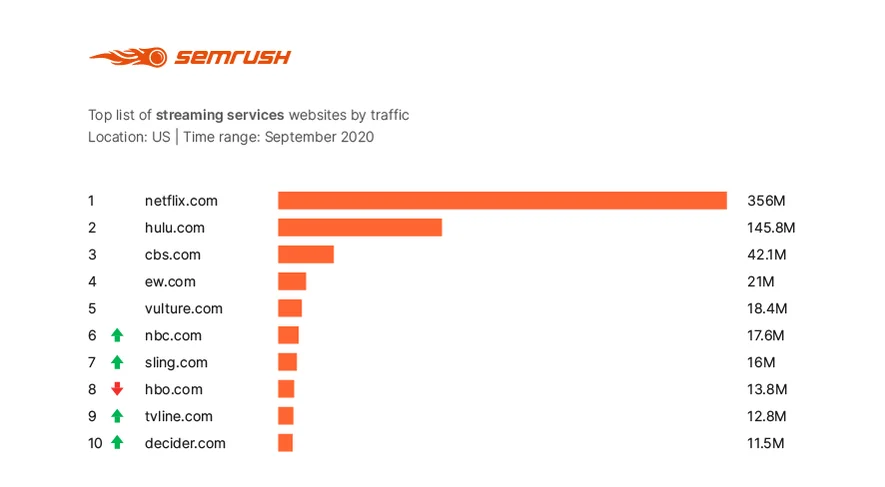
 Despite declining traffic numbers within the streaming services category, the top 5 players have retained their top positions, comparing MoM August-September data.
HBO and FOX are the only industry players that managed to boost both traffic and positions, with average traffic growth of 30%. Yet Netflix, the absolute category leader that shows double the number of visitors compared to its key competitor, Hulu, has lost a little over 25% of its traffic in September 2020.
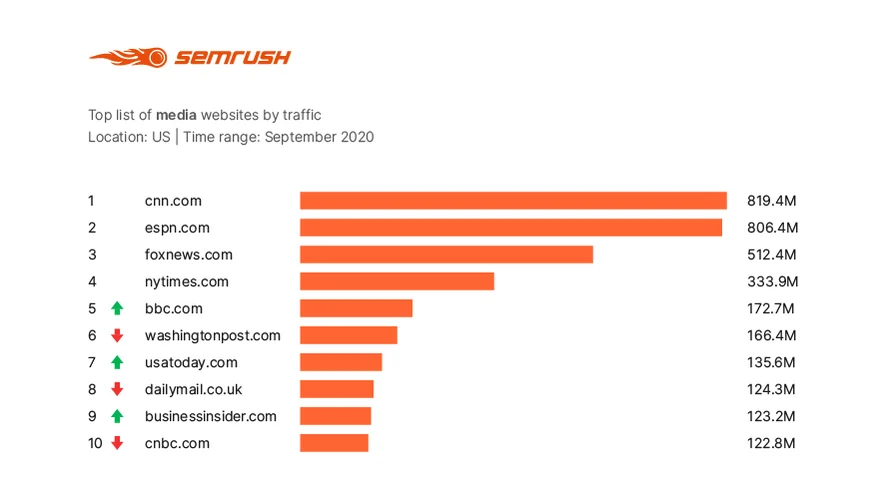
The Most Visited Websites - US, Media Category

The media industry leaders are also generally showing a slight 3% average traffic decrease. While CNN, FOX News, and NYT keep their top positions, this decrease implies overall news fatigue as the only site showing a spike in user interest (probably thanks to the revival of offline sports) is a cable sports channel, ESPN, which grew its visitors by 15% MoM.
It’s Not Just About the Traffic
Although observing position changes through traffic volume can help to analyze global trends and benchmark your performance against the competition, Traffic Analytics reports also include important metrics like:

To learn more about the data behind this article and what SEMrush has to offer, visit https://www.semrush.com/.


Sign up to receive our stories in your inbox.
Data is changing the speed of business. Investors, Corporations, and Governments are buying new, differentiated data to gain visibility make better decisions. Don't fall behind. Let us help.


Sign up to receive our stories in your inbox.
Data is changing the speed of business. Investors, Corporations, and Governments are buying new, differentiated data to gain visibility make better decisions. Don't fall behind. Let us help.


