ATTOM Data Solutions’ just released Q3 2020 U.S. Home Equity and Underwater Report reveals that 16.7 million residential properties in the U.S. were considered equity-rich in the third quarter of 2020, while just 3.5 million mortgaged homes were considered seriously underwater.
ATTOM’s home equity and underwater analysis defines an equity-rich property as one with a loan to value ratio of 50 percent or lower, meaning the property owner had at least 50 percent equity. ATTOM defines a seriously underwater property as one with a loan to value ratio of 125 percent or above, meaning the property owner owed at least 25 percent more than the estimated market value of the property.
According to ATTOM’s Q3 2020 analysis, the number of equity-rich properties in in the third quarter of 2020 represented 28.3 percent, or about one in four, of the 58.9 million mortgaged homes in the U.S. That figure is up from 27.5 percent in Q2 2020, 26.5 percent in Q1 2020 and 26.7 percent in Q3 2019, despite the economic damage caused this year by the worldwide Coronavirus pandemic.
The latest home equity and underwater report states that the number of seriously underwater properties in the third quarter of 2020 represented 6 percent, or about one in 17, of all U.S. properties with a mortgage. That number is down from 6.2 percent in Q2 2020, 6.6 percent in Q1 2020 and 6.5 percent Q3 2019.
The report notes that among the 50 states, 49 showed a quarterly increase in the percentage of homes considered equity-rich, while just seven showed increases in the percentage that were seriously underwater, with six of those up by less than one percentage point.
According to ATTOM’s report, among the 1,550 counties analyzed with at least 2,500 properties with mortgages in Q3 2020, 23 of the top 25 equity-rich areas were in the West or Northeast regions, with the highest concentration remaining in the San Francisco Bay area of California.
The analysis cites the counties with the highest share of equity-rich properties, including San Francisco County, CA (66.9 percent equity-rich); Washington County, WI (outside Milwaukee) (66.5 percent); Santa Clara County (San Jose), CA (64.7 percent); San Mateo County, CA (outside San Francisco) (61.4 percent) and Dukes County (Martha’s Vineyard), MA (60.5 percent).
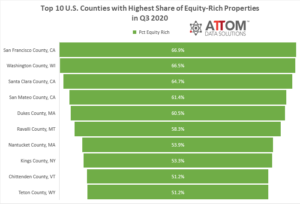
In this post, we dive deep into the data to unveil the complete list of the top 10 U.S. counties with the highest share of equity-rich properties among those counties with 2,500 mortgages in Q3 2020. The complete list of those counties with the highest share of equity-rich properties include: San Francisco County, CA (66.9 percent equity-rich); Washington County, WI (66.5 percent); Santa Clara County, CA (64.7 percent); San Mateo County, CA (61.4 percent); Dukes County, MA (60.5 percent); Ravalli County, MT (58.3 percent); Nantucket County, MA (53.9 percent); Kings County, NY (53.3 percent); Chittenden County, VT (51.2 percent); Teton County, WY; (51.2 percent).

ATTOM’s Q3 2020 home equity and underwater report also notes that the top 15 states with the highest shares of mortgages that were seriously underwater in Q3 2020 were all in the South and Midwest, led again by Louisiana (15.3 percent seriously underwater), West Virginia (13.8 percent), Mississippi (12.6 percent), Iowa (12.1 percent) and Arkansas (11.7 percent).
The analysis states that among 107 metro areas with a population greater than 500,000, those with the highest shares of mortgages that were seriously underwater in the third quarter of 2020 were Baton Rouge, LA (14.5 percent); Youngstown, OH (14 percent); Syracuse, NY (13.5 percent); Scranton, PA (13.1 percent) and Cleveland, OH (12.4 percent).
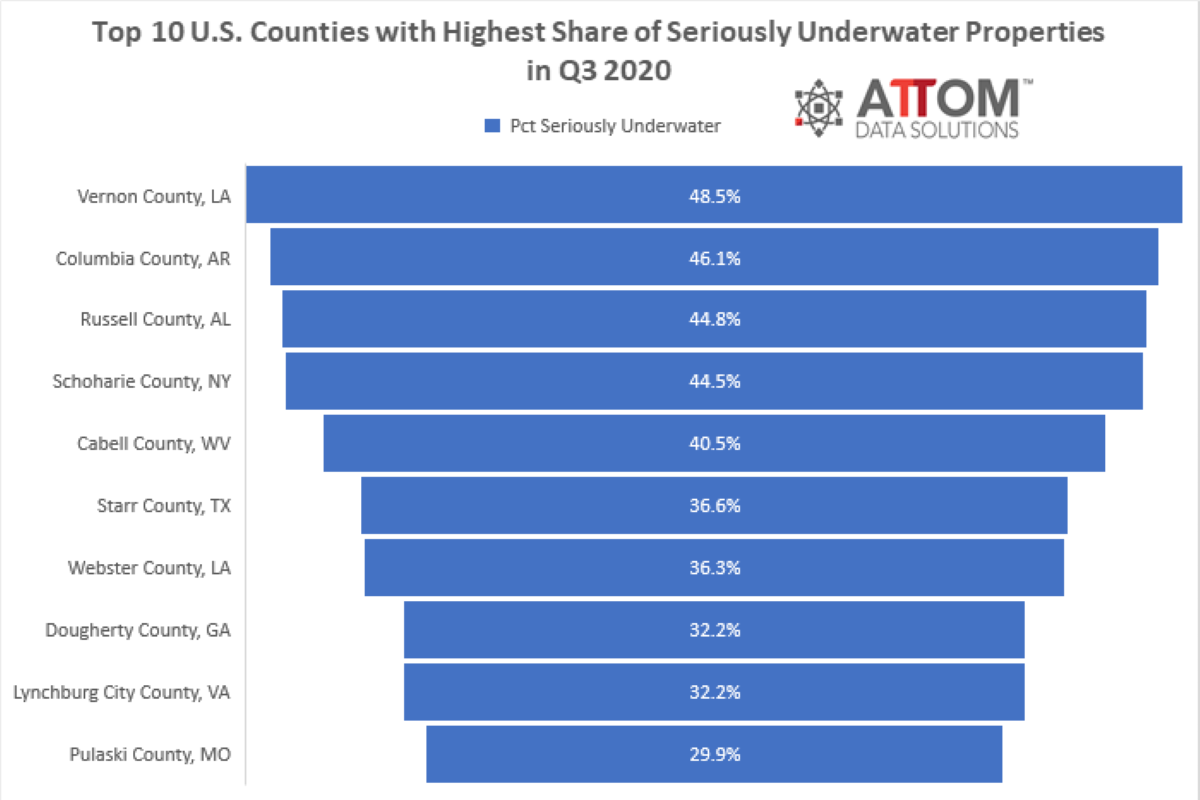
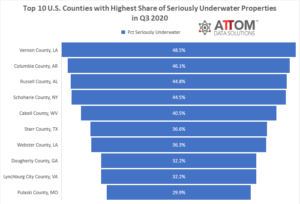
In this post, we take another deep dive into the data to uncover the top 10 U.S. counties with the highest share of seriously underwater properties among those counties with 2,500 mortgages in Q3 2020. The complete list of those counties with the highest share of seriously underwater properties include: Vernon County, LA (48.5 percent seriously underwater); Columbia County, AR (46.1 percent); Russell County, AL (44.8 percent); Schoharie County, NY (44.5 percent); Cabell County, WV (40.5 percent); Starr County, TX (36.6 percent); Webster County, LA (36.3 percent); Dougherty County, GA (32.2 percent); Lynchburg City County, VA (32.2 percent); and Pulaski County, MO (29.9 percent).

To learn more about the data behind this article and what Attom Data Solutions has to offer, visit https://www.attomdata.com/.


Sign up to receive our stories in your inbox.
Data is changing the speed of business. Investors, Corporations, and Governments are buying new, differentiated data to gain visibility make better decisions. Don't fall behind. Let us help.


Sign up to receive our stories in your inbox.
Data is changing the speed of business. Investors, Corporations, and Governments are buying new, differentiated data to gain visibility make better decisions. Don't fall behind. Let us help.


