Source: https://www.placeiq.com/2020/11/sdt-edition-33-new-metrics-to-monitor-the-brick-and-mortar-economy/
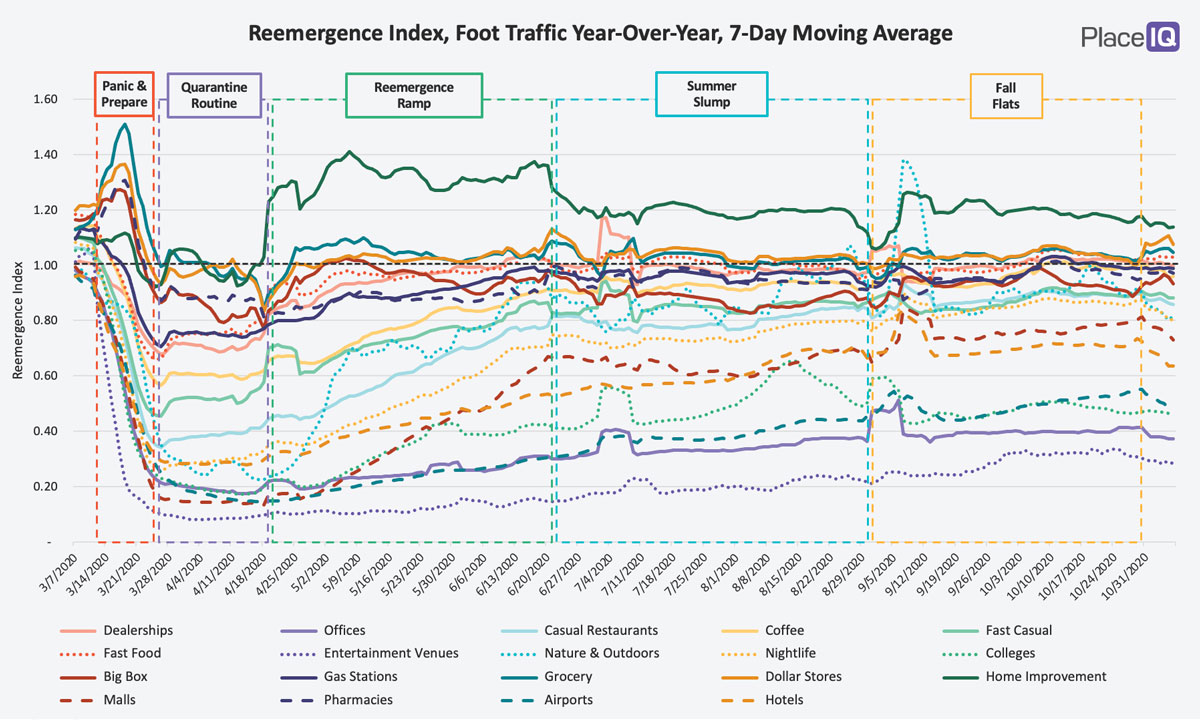
In our last issue, we named the Fall Flats, the latest phase we’ve measured in traffic reemergence. We had been hesitating to pick a name for this time period because, well, nothing was happening. Traffic had reached an equilibrium. The Summer Slump seamlessly transitioned to unchanging foot traffic in September and October. We waited for traffic to turn up or fall down, given the holiday season or rising case counts, but it never happened. After two months of data, we made the call for Fall. We should have waited…
Perhaps it was the candy hangovers from Halloween; maybe it was election anxiety. In all likelihood, it’s the case counts. COVID cases have been rising through October into November, reaching grim milestones, and have finally appeared as a dent in our foot traffic. We can clearly see correlation between infection rates and traffic. Here’s the traffic index to big box stores by state for last week:
Big Box Visitation, Year-Over-Year Index, Week 45
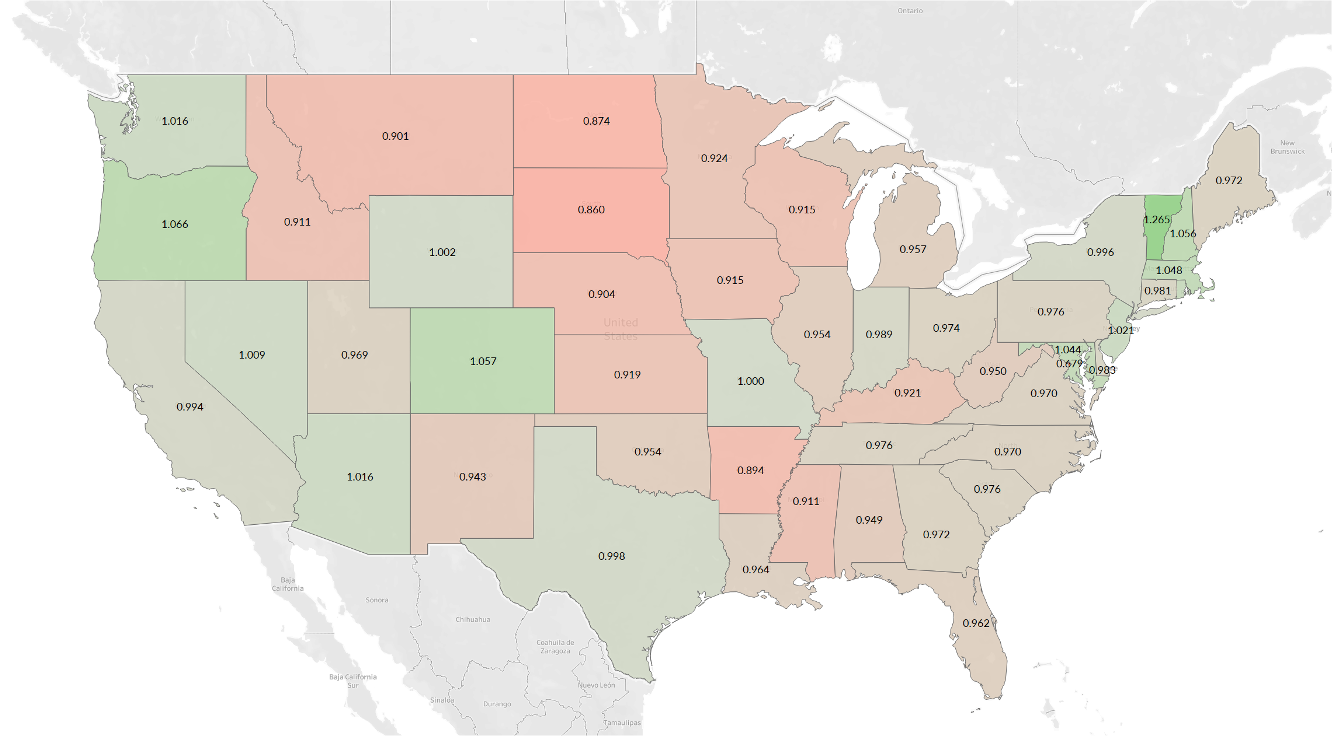
Big box has been solidly hovering around 1.00 (near normal traffic) all Summer and Fall, but from the Midwest to Montana traffic is unusually light – closely resembling the map of rising case counts below:
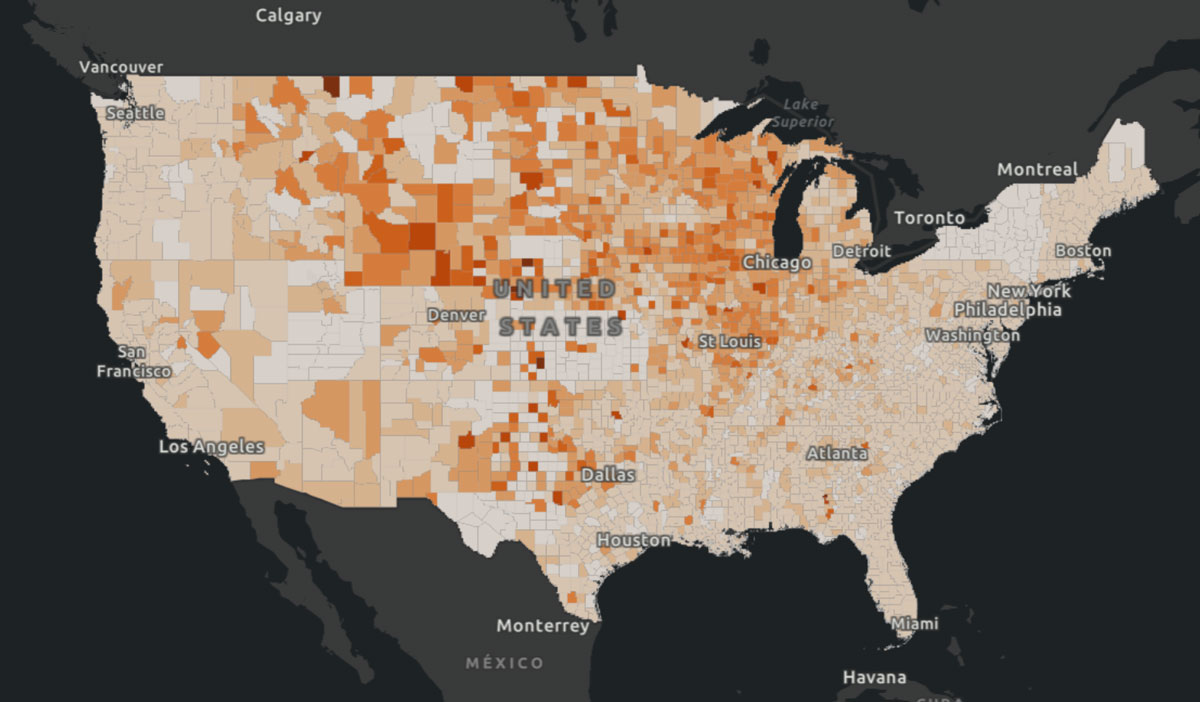
We now have an answer to the question we posed last issue: “We will be watching closely to see if (a) new cases eventually make a dent in foot traffic (as they did during the Summer Slump) or (b) holiday shopping begins to drive retail traffic upwards.” Rising case counts have made a dent in traffic, mostly in the hardest hit regions.
Despite this disappointing news, we suggest you stick with us below. We’re going to look at changes in visit duration and use this metric to build out our Reemergence Scorecard, which we started last week.
Building a Reemergence Scorecard to Monitor the Brick and Mortar Economy
Two weeks ago we looked at regional variation and how we can use it as a signal to understand reemergence. By building an index of how varied traffic is across the nation, we can compare overall visitation volume and regional variation in a single view. This allowed us to understand that recovery generally occurs in two phases: first foot traffic returns, then regional variation declines. We’ve continually noted that ‘reemergence is regional’, but now we have a score to quantify how regional it is over time.
Another insight we’ve shared is, ‘visits are different.’ Even as they return in volume, their duration, frequency, and time of day is shifted due to our socially distanced lives. In order to build a scorecard that allows us to track these subtleties and better inform categories and brands, we need to build a metric to quantify these changes. Today we’re taking on visit duration.
To start, let’s look back at this duration break down for Five Guys:
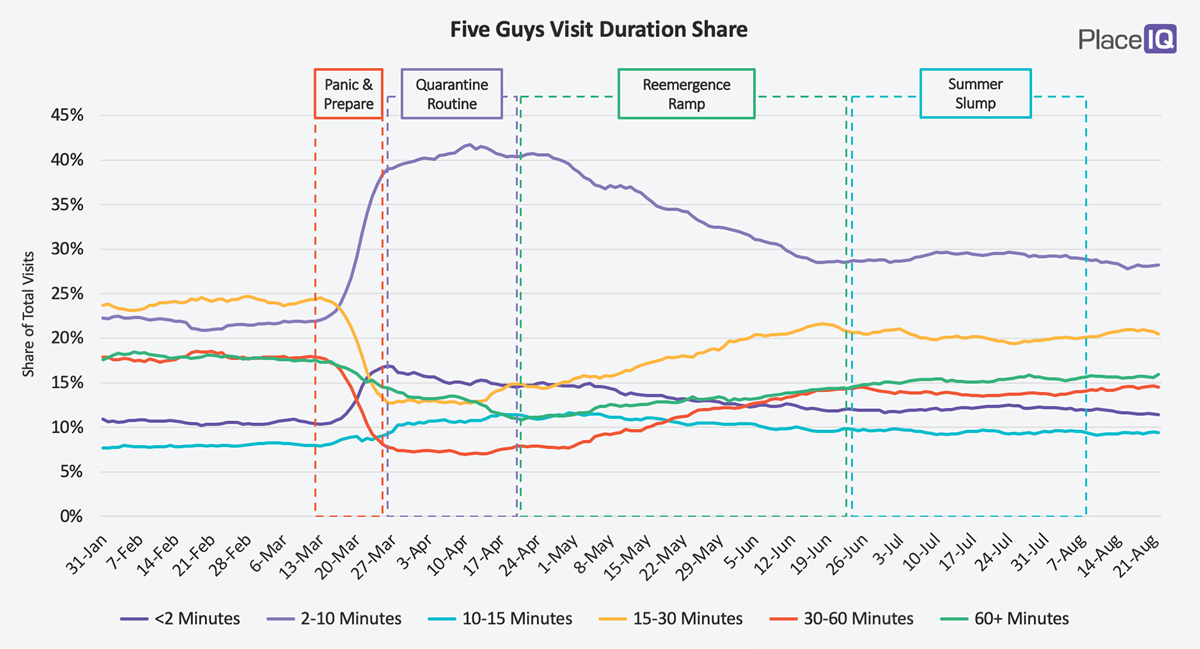
As previously noted, breaking visit durations into buckets (2-10 minutes, or 60+, etc.) allows us to see more details. If we were simply to take the average duration, most of the nuance would come out in the wash. By organizing the data this way, we can see Five Guys transform their business: quick visits associated with pick up have risen and remained while dine in visits have been slow to recover.
It’s this dichotomy we want to measure: the relationship between quick trips and long trips. This is where the shift has been during COVID. Restaurant customers are favoring pick-up over dining in while click-and-collect options have taken hold for many retailers. By calculating the ratio between short and long visits and comparing this figure to a brand or category’s pre-COVID average, we can build a rather effective index:
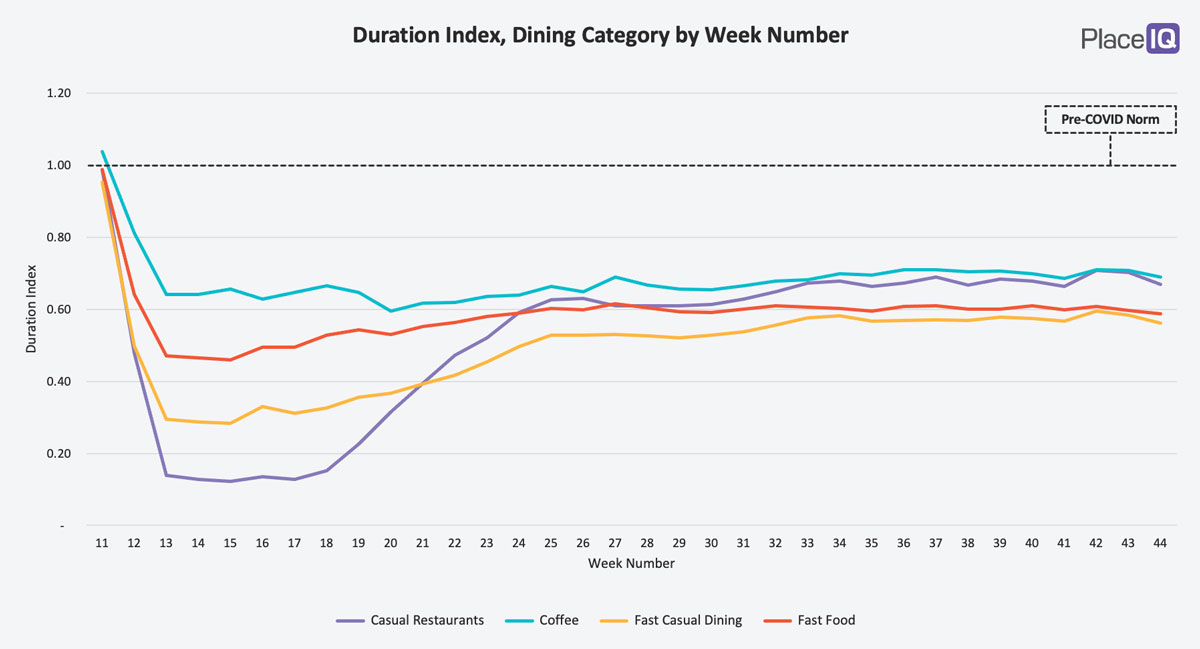
If a category has a Duration Index of 1.0, the ratio of short to long visits equals its Pre-COVID norm. If the index is less than 1.0 it means visits are more likely to be shorter; greater than 1.0 and they’re more likely to be longer. For example, coffee shop visits are 30% more likely to be shorter today than during our Pre-COVID lives (there’s a lot less people lingering in coffee shops with laptops these days).
We can see these visits have largely stabilized at 30-40% less than norms, since week 34, though there is a dip starting to take place among all categories in week 44. Time will tell if that continues as case counts rise. Take out still reigns; dining in is mostly avoided.
Compared to dining, the retail figures tell a different story:
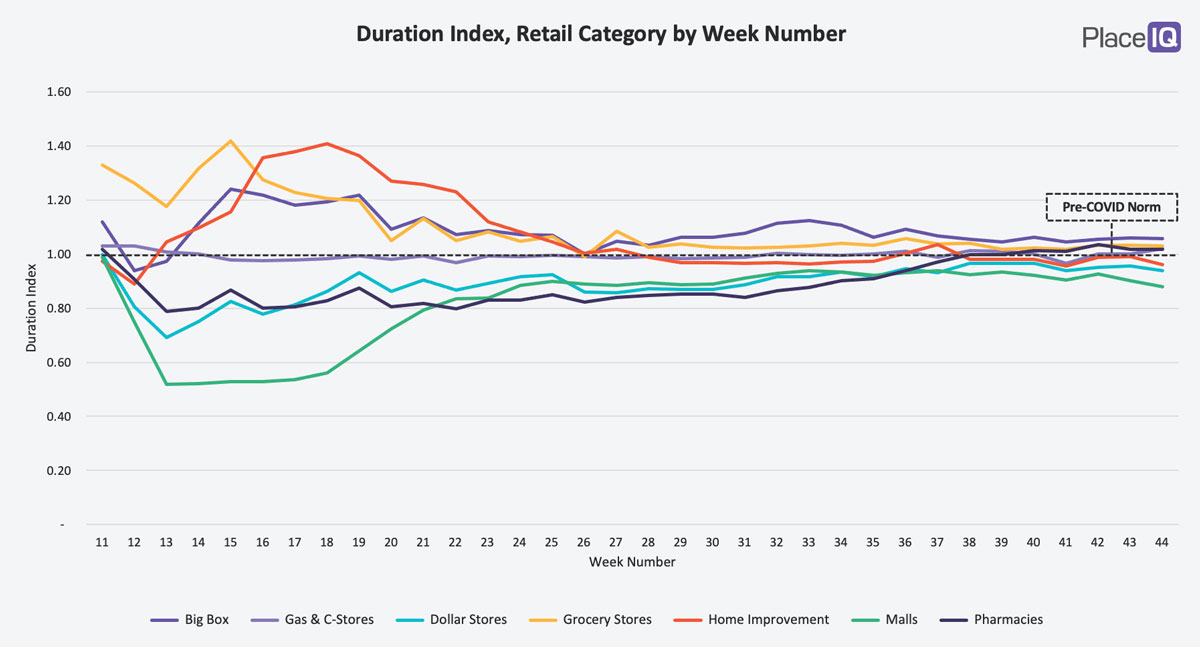
Aside from malls, no category tilted towards shorter visits in any way close to dining. Trips were more likely to be longer for grocery stores and big box stores in the early days of the quarantine, when there were fewer, but more significant trips. Home improvement retailers had longer trips too, as people bought supplies for their quarantine projects, but the duration index has returned to the usual. Since week 37, the Duration Index for the entire category has stayed close to Pre-COVID norms.
With this new metric doing what we’d expect, fitting in with the verified trends we’ve seen across businesses, we can add it to our growing Reemergence Scorecard alongside visit count and regionality:
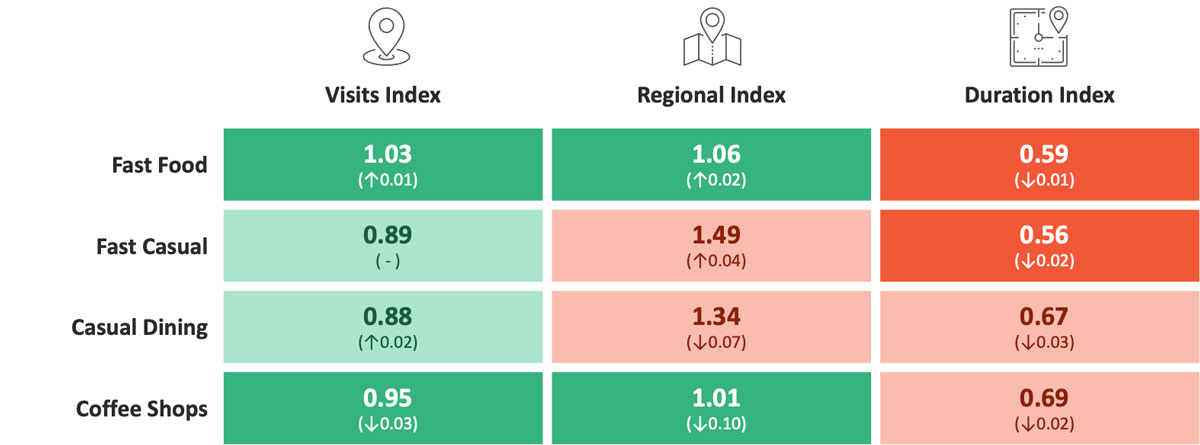
This is a snapshot of the dining sector for week 45. Traffic volumes are healthy for the category, but visits remain much shorter as we all continue to choose pick-up over dine-in. Regional variation remains high for Fast Casual and Casual Dining, two categories whose business is lopsided as many of us continue to work from home. White collar offices often remain closed, greatly diminishing these venues’ lunch traffic in urban workplace areas.
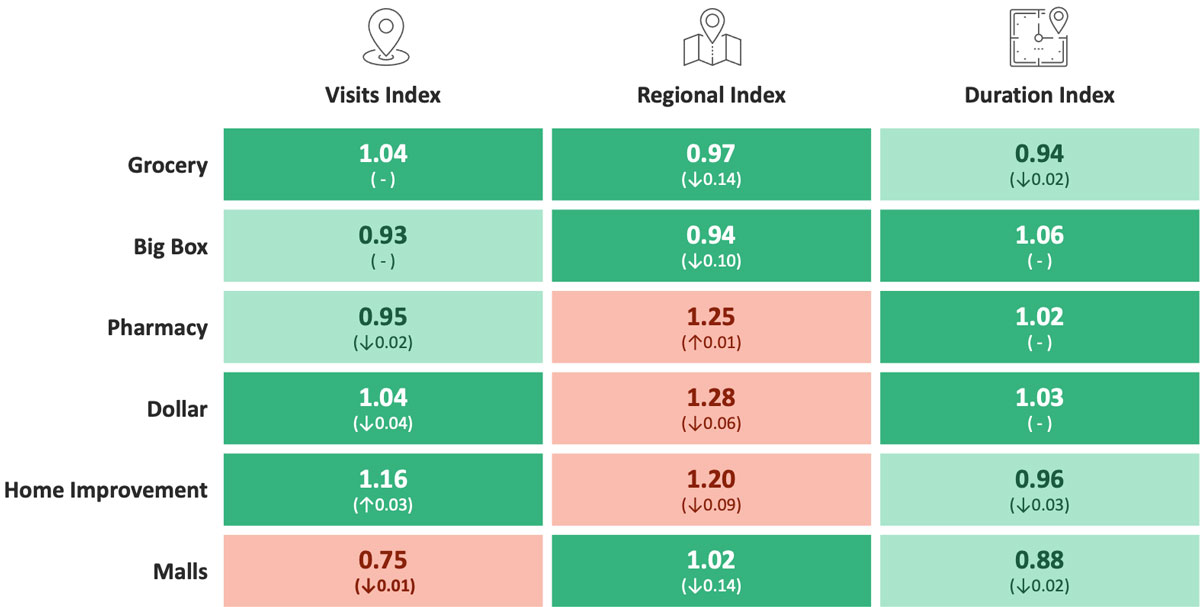
In the retail sector, traffic remains suppressed at malls, down 25% from norms. As we saw above, the Duration Index across the sector is close to COVID norms, though mall visits remain over 10 points tilted towards shorter visits. Regional variation remains slightly elevated for pharmacies, dollar stores, and home improvement retailers, but we’re seeing that decline for the latter two categories.
Slicing visitation by volume, regionality, and duration allows us to obtain a more nuanced snapshot of the economy at a quick glance, and the direction it is heading. Internally, they help us spot changes we might otherwise miss (as you’ll see below). We’ll be continuing to update these figures, add a few more metrics, and issue these to you all in our regular missives.
Breakfast is Back
Looking at the scorecards above, we can note the largest change occurs in regional variation to coffee shops. Between week 44 and week 45, the Regional Index declined by 10 points. Curious, we dug into more granular coffee shop metrics and discovered something shocking. While many of us continue to work from home, the morning commute is starting to return for others. This trend shows up clearly in coffee shop traffic:
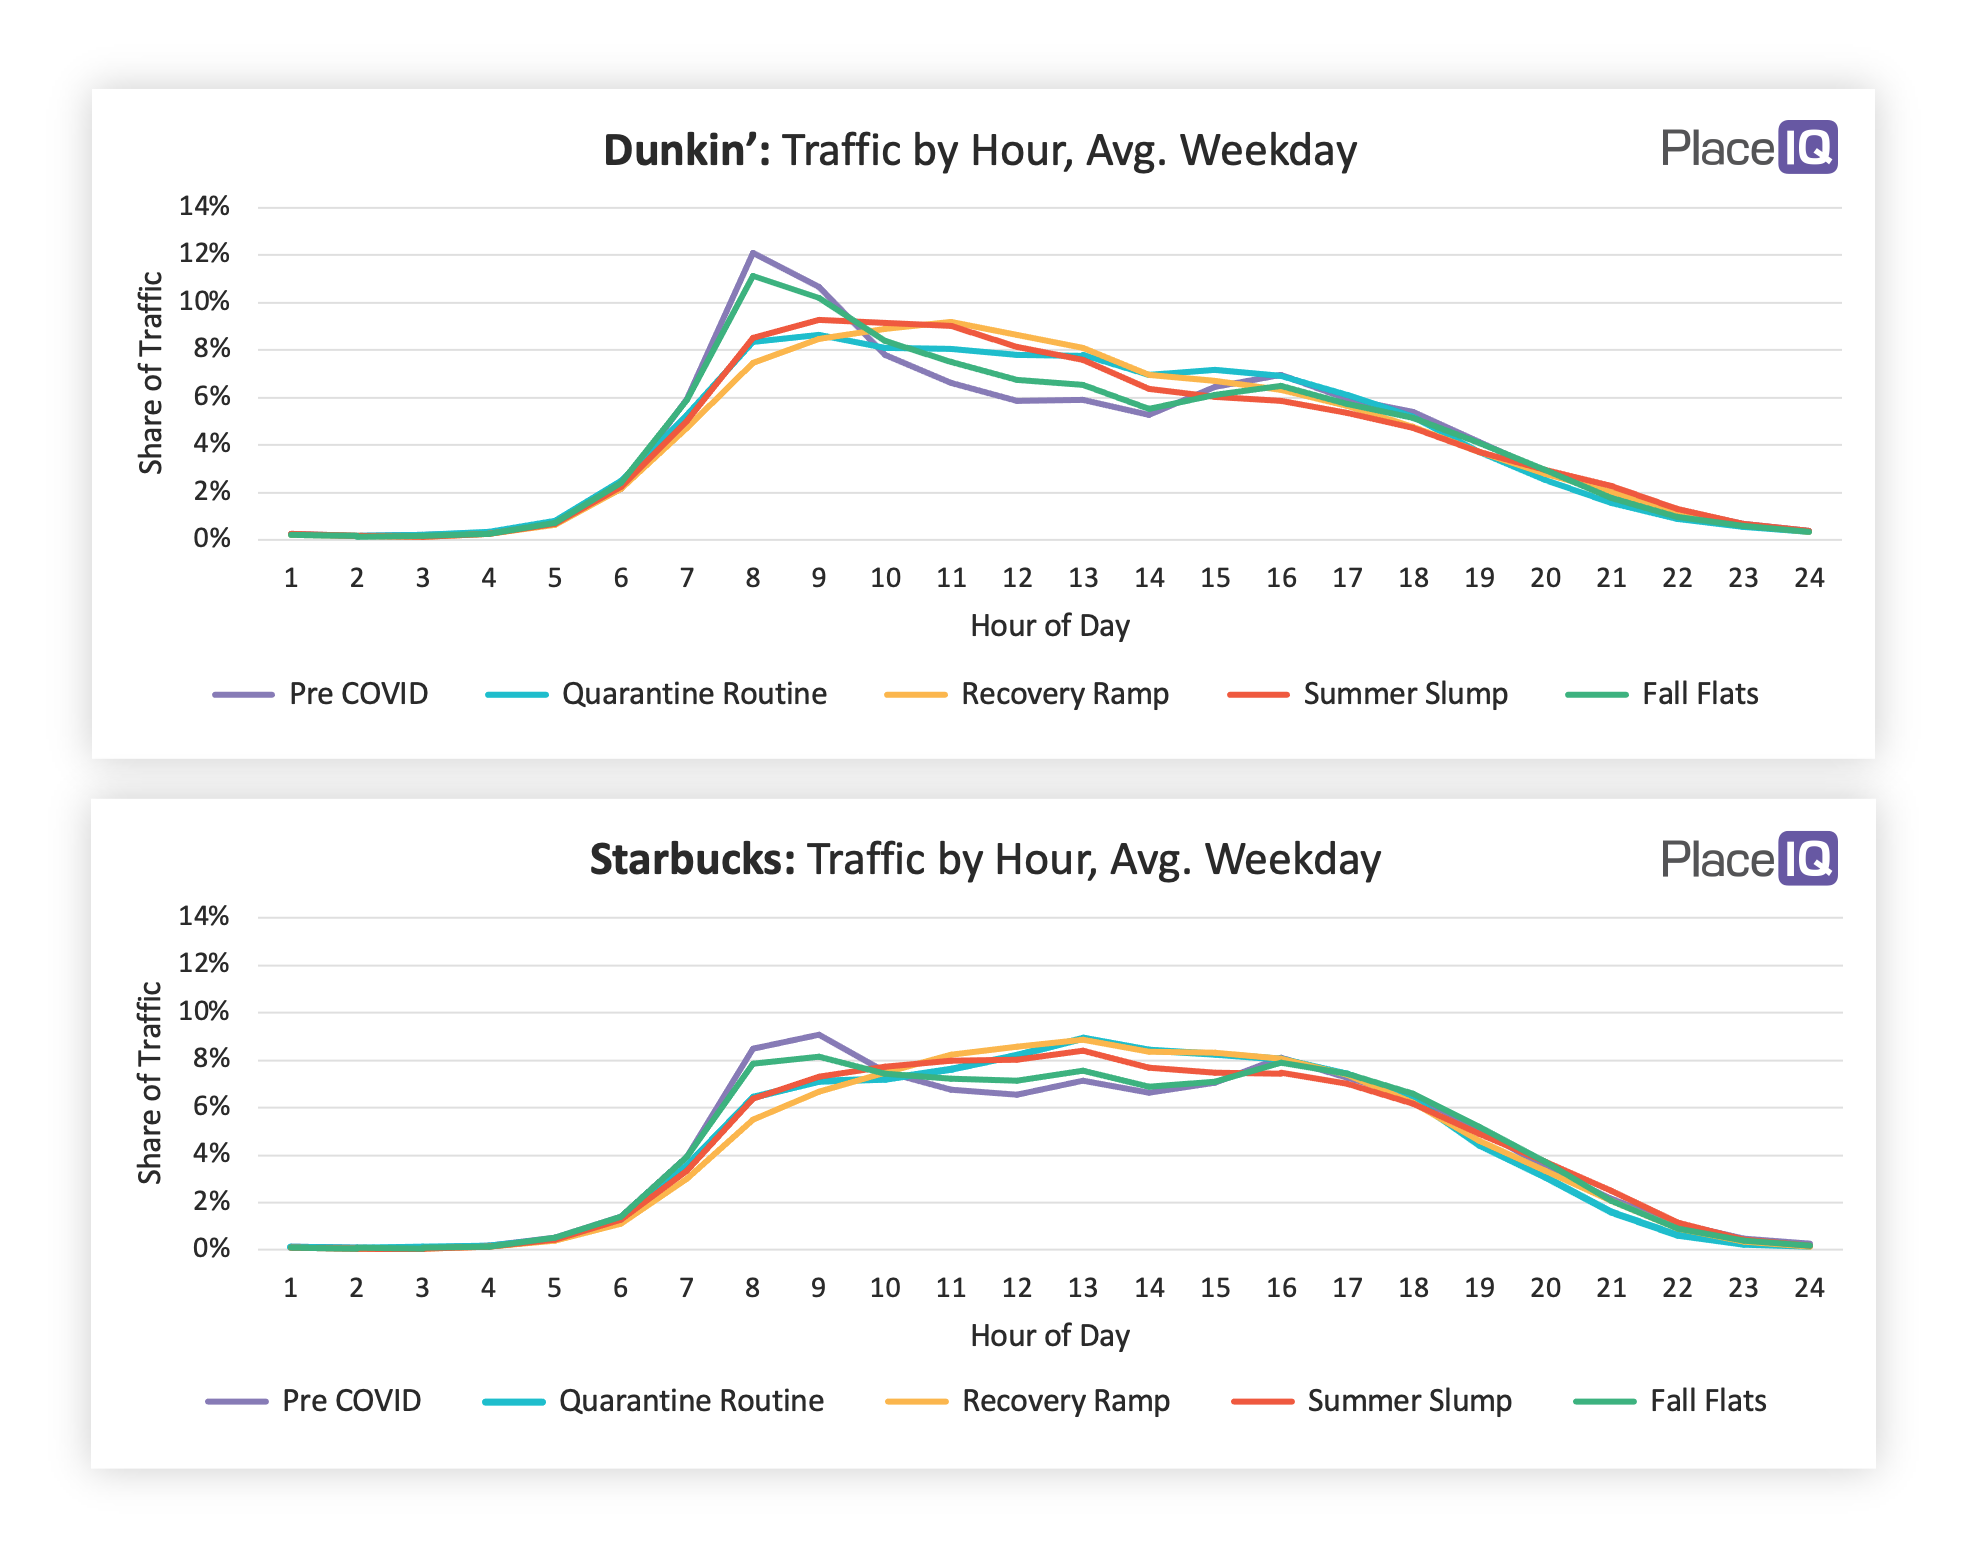
We noted earlier that breakfast disappeared from coffee shop foot traffic as we began to work from home. In the above charts we can see that clearly: during the Quarantine Routine, Recovery Ramp, and Summer Slump traffic to Dunkin’ and Starbucks was severely suppressed between 7am and 10am. During this time, a greater share of their visits came during lunch hours. Without a daily commute, coffee rush traffic dried up. For over six months this was the norm!
In the Fall Flats, visits shifted significantly, snapping back into a Pre-COVID shape almost precisely. For those of you driving in the morning or evening, you’ve surely noticed traffic returning. In the San Francisco Bay Area, traffic crossing the Bay Bridge has returned to 85% of normal levels! The return of the commute is causing the coffee rush to return for Dunkin’, Starbucks, and other breakfast spots. Traffic looks more like our Pre-COVID patterns than anything we’ve seen over the past 7 months.
To learn more about the data behind this article and what PlaceIQ has to offer, visit https://www.placeiq.com/.


Sign up to receive our stories in your inbox.
Data is changing the speed of business. Investors, Corporations, and Governments are buying new, differentiated data to gain visibility make better decisions. Don't fall behind. Let us help.


Sign up to receive our stories in your inbox.
Data is changing the speed of business. Investors, Corporations, and Governments are buying new, differentiated data to gain visibility make better decisions. Don't fall behind. Let us help.