Every recession has a different impact on the performance of commercial real estate. This recession has the unique feature of savaging some sectors while boosting others. Given patterns of distress in the marketplace, the over or under performance of various property sectors in 2020 is likely to persist into 2021.
Economic analysts talk about the shape of recessions using letters to describe the patterns that a chart of GDP levels will follow into and out of a recession. These analogies usually only involve the letters V, U, L, J, and W. (Early in this recession I used a cursive V slide in a number of my talks, though I ran into trouble when it became clear that a number of the younger folks in our industry are not so familiar with cursive.)
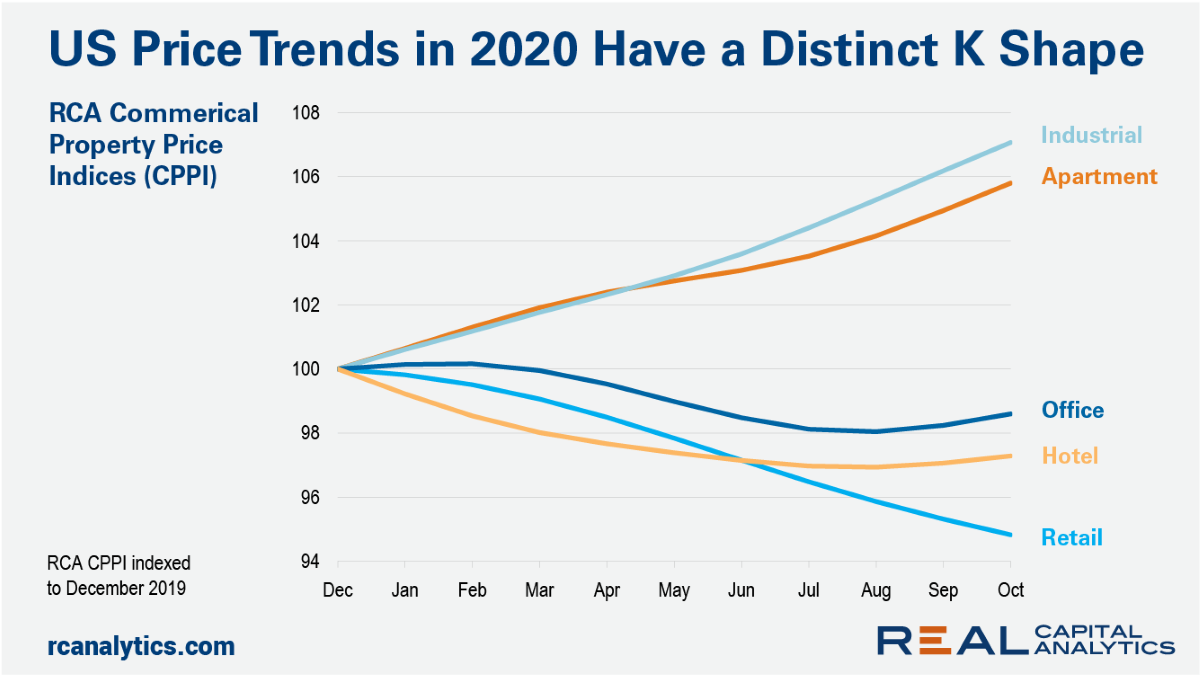
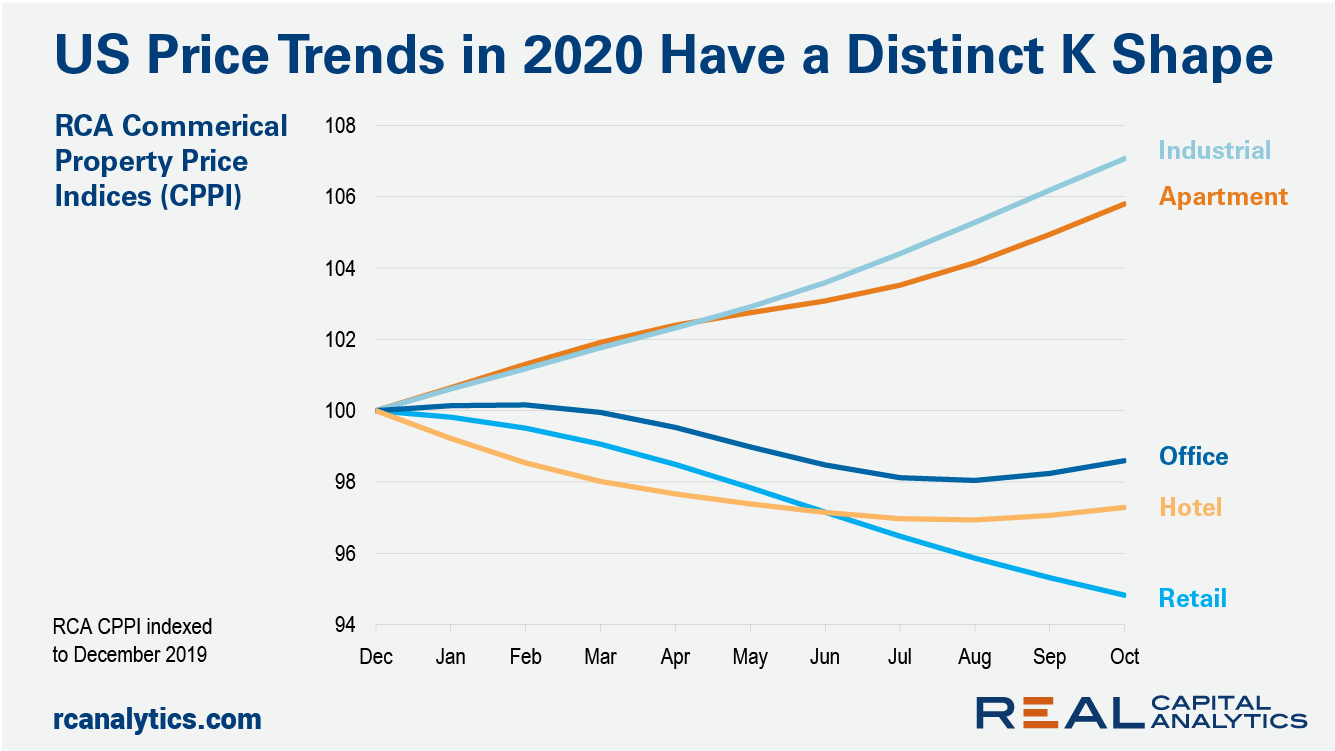
Recently, economists have added a K-shaped recovery to this partial alphabet: personal income and job growth is on a favorable path for knowledge sector workers operating from the comfort of their homes, while workers in lower-skilled positions are suffering. The same K-shaped variation in performance can be seen in commercial property prices.

Plotting out the path of U.S. property prices by sector throughout 2020, the industrial and apartment sectors are the clear winners. Through October, the RCA CPPI for the industrial sector is up 7.1% from the starting point of December 2019. The apartment sector is up 5.8% in this time frame. Deal volume is down from a year earlier for both of these sectors because of the mechanical challenges of completing deals while socially distancing. Despite these challenges, investors are hungry for the steady income provided by many of these properties in this uncertain climate.
The retail sector has seen the worst of it, with prices down 5.2% from this December 2019 starting point. The office and hotel sectors have fared better, showing total declines of only 1.4% and 2.7%, respectively, but current investors in these sectors should not get their hopes up about the little lift in trends through October. These series do not always follow a linear path and the pileup of distressed assets will weigh on the performance of these sectors into 2021.
The process of price discovery is getting underway for commercial property, with distressed loans entering the workout phase and becoming distressed asset sales. In our US Capital Trends report published last month, we showed that the hotel and retail sectors led the pack with the highest shares of distressed sales relative to total sales in these sectors. Such sales are still under 1% of total office sales, but we are tracking more than $10 billion in potentially distressed assets in the office market.
With the overhang of potential distress and investor uncertainty about the future, conditions for the three property sectors on the bottom side of the K are unlikely to improve in the near term.
To learn more about the data behind this article and what Real Capital Analytics has to offer, visit https://www.rcanalytics.com/.


Sign up to receive our stories in your inbox.
Data is changing the speed of business. Investors, Corporations, and Governments are buying new, differentiated data to gain visibility make better decisions. Don't fall behind. Let us help.


Sign up to receive our stories in your inbox.
Data is changing the speed of business. Investors, Corporations, and Governments are buying new, differentiated data to gain visibility make better decisions. Don't fall behind. Let us help.


