

Fifty-two weeks ago, we wrote a short blog highlighting some of the regional capacity changes in Asia as a result of a small, localised outbreak of a new virus. At the time we thought that there could be some impact on global aviation, perhaps like a SARS or Ebola time impact. We were so wrong! A year later and we are reporting on what has become the single most destructive event in aviation history; it has to end soon, surely?
There are not many similarities between a dark and gloomy January and the normally brighter, warmer and longer days of July; but in terms of global capacity this week’s numbers are almost the same as July 2020. Global capacity now stands at some 53.4 million seats a week; a reduction of 3.4% over the previous week and exactly half the level of capacity reported last year.
With IATA suggesting that airlines will require a further US$80 billion to see them through the worst of the crisis and governments closing down borders and travel corridors over the last few days it’s hard to see when the tide will turn but it will. Trust be I’m a Brighton supporter and we’ve waited a long time for a victory this year!
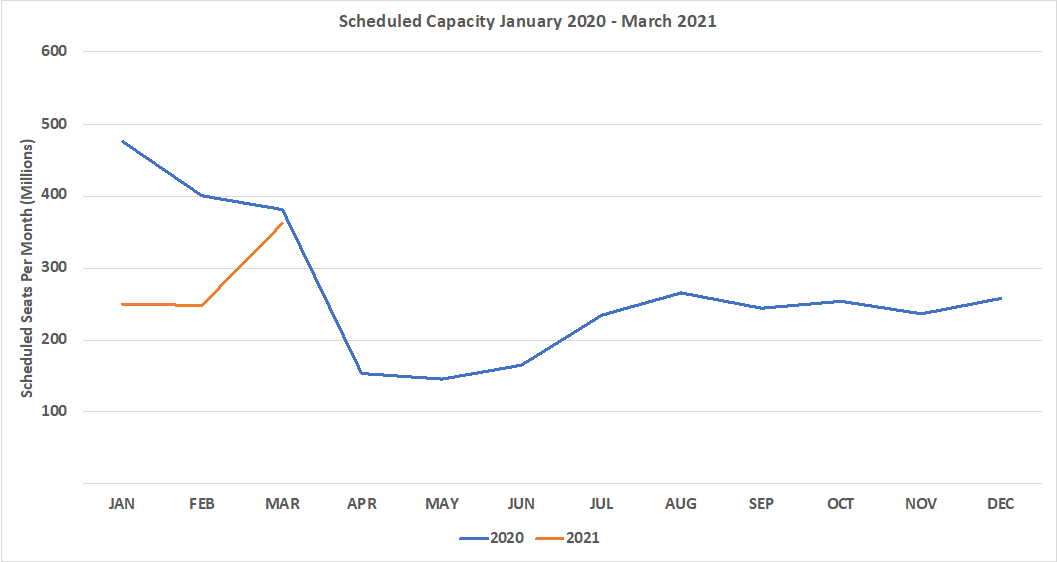
At the beginning of January, we were expecting capacity for this month of 264.7 million; the latest count is for 251.0 million, some 14.7 million seats have disappeared in the last two weeks and we can probably expect a similar amount through to the end of the month. As the chart below clearly shows airlines continue to plan no more than a few weeks ahead and the current capacity planned for March of 362 million seats, a 44% increase on January is unlikely to be operated given recent events.
Chart 1 – Scheduled Airline Capacity by Month
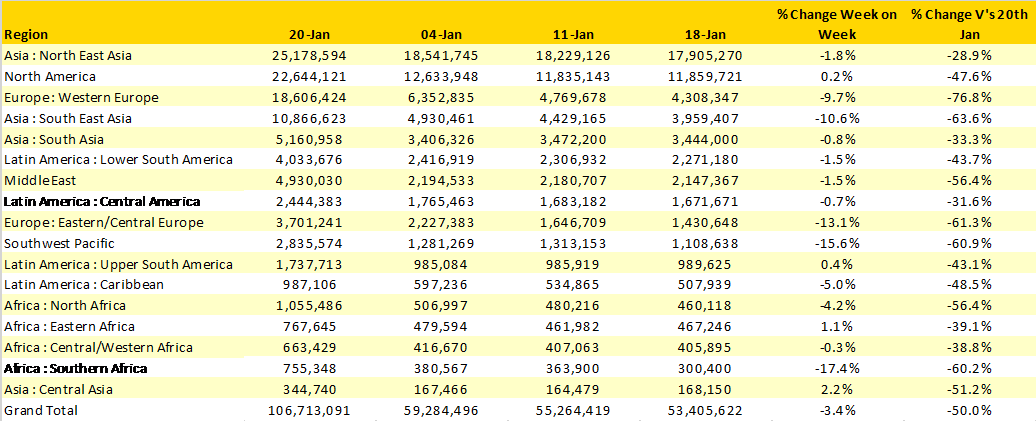
No major regional market reported any significant growth week on week as many aviation markets continued to decline. In Western Europe, capacity has shrunk by one-third in the last two weeks and now stands at less than one-quarter of the capacity levels operated last year. Southern Africa has seen the largest weekly change in capacity with a 17% reduction in capacity as further restrictions are placed on travel in South Africa that then ripple across the other regional country markets.
Although always dangerous to look forward at next week’s capacity levels given that a number of changes to travel restrictions were made at the end of the last week, we can expect further cuts in capacity, particularly in Europe and Latin America.
Table 1– Scheduled Airline Capacity by Region
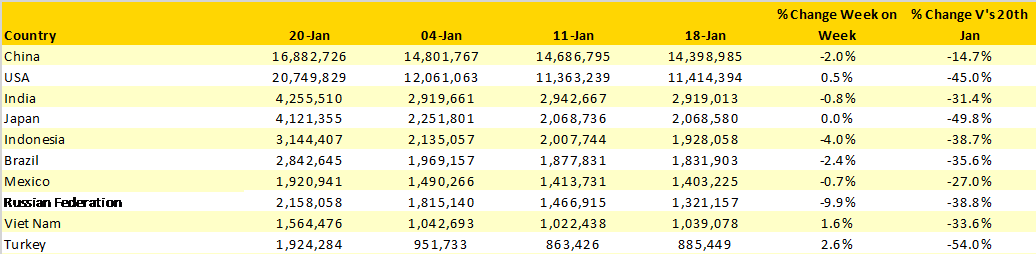
In January 2020 the United Kingdom, Germany and Spain were amongst the ten largest global aviation markets; today they are in 21st, 20th and 15th places respectively with the UK particularly hard hit with only 13% of the previous year’s capacity now being operated; when you are an Island economy that is not a good place to be. For every losing country market there is equally a relative winner and Vietnam is the ultimate winner to date having moved from 19th position to 9th over the last year despite losing over 33% of capacity; moving up ten places with such a capacity drop just shows how bad things have become.
China’s continued position as the largest country market is likely to be uncontested for much of 2021 unless international restrictions are eased to and from the United States under the new administration that takes over this week. Chinese New Year is only a few weeks away and we normally see a spike of domestic capacity around now; indeed, there are currently some 1.6 million additional seats planned for next week’s schedule; quite how many of those will still be operating in seven days’ time will be interesting given increasing local lockdowns.
Below the top twenty country markets there are a number of once major markets where capacity has fallen even further. In Malaysia for instance, capacity this week will be around 134,000; the same week last year was 1.4 million; Singapore was 869,000 and is scheduled to around 111,000 this week whilst Hungary is now at 9,500 weekly seats compared to 173,000 last January. It is just tough everywhere.
Table 2- Scheduled Capacity, Top 10 Countries Markets
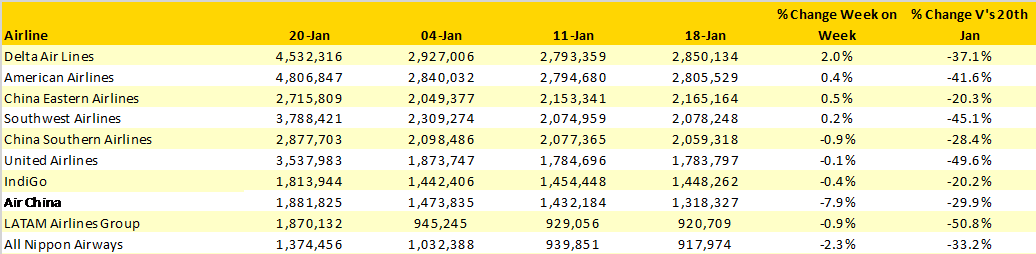
There is no change in the top ten global airlines this week. No European airline makes the list which remains dominated by US and Chinese carriers with Delta Air Lines holding onto first place.
The scale of capacity cutbacks currently in place is best reflected by looking at a few of the major carriers that are no longer listed. Ryanair for example, will operate some 220,000 seats this week, last year that was 2.4 million; a 90% drop in their capacity with similar expectations through until the end of February at least. Emirates operated some 1.4 million seats last year and will operate 448,000 this week and that includes the recently announced stoppage of services to Australia for “operational reasons’, whatever they are.
Table 3- Scheduled Capacity Top 10 Airlines
Every indication is that we will not see any improvement in global capacity before the end of March and that was always the case even before the new year began. What has perhaps been surprising has been the depth of the capacity cuts that we have seen in recent weeks which in turn will probably lead to a longer recovery period than was expected. Optimistic hope of a full recovery by 2024 is now looking like a more realistic 2026 point of return for many markets despite some confidence to book being seen for the second half of this year in shorter haul regional markets.
IATAs analysis of a further US$80 billion in support being required sounds a huge amount of money, and it is. However, a few more weeks like the last two and that number could comfortably extend out to over US$100 Billion or more. Worrying times indeed.
To learn more about the data behind this article and what OAG has to offer, visit https://www.oag.com/.


Sign up to receive our stories in your inbox.
Data is changing the speed of business. Investors, Corporations, and Governments are buying new, differentiated data to gain visibility make better decisions. Don't fall behind. Let us help.


Sign up to receive our stories in your inbox.
Data is changing the speed of business. Investors, Corporations, and Governments are buying new, differentiated data to gain visibility make better decisions. Don't fall behind. Let us help.