

Another dire week for global aviation with more lockdowns, sudden suspensions of services and the threat of having to stay in a quarantine hotel at Heathrow looming for anyone brave enough to want to enter the United Kingdom. Can things get any worse; probably but let’s hope not and try to stay positive.
Global capacity fell by another two million seats and now stands at a 51.3 million seats; around the same levels as we saw in the first week of July 2020 when we thought a recovery was beginning; if only! Twelve months ago, domestic capacity accounted for 61% of all seats operated, this week that has reached 81% with China and the United States accounting for some 23 million domestic seats. In fact, these two countries account for 47% of all global capacity this week compared to just over one-third twelve months ago.
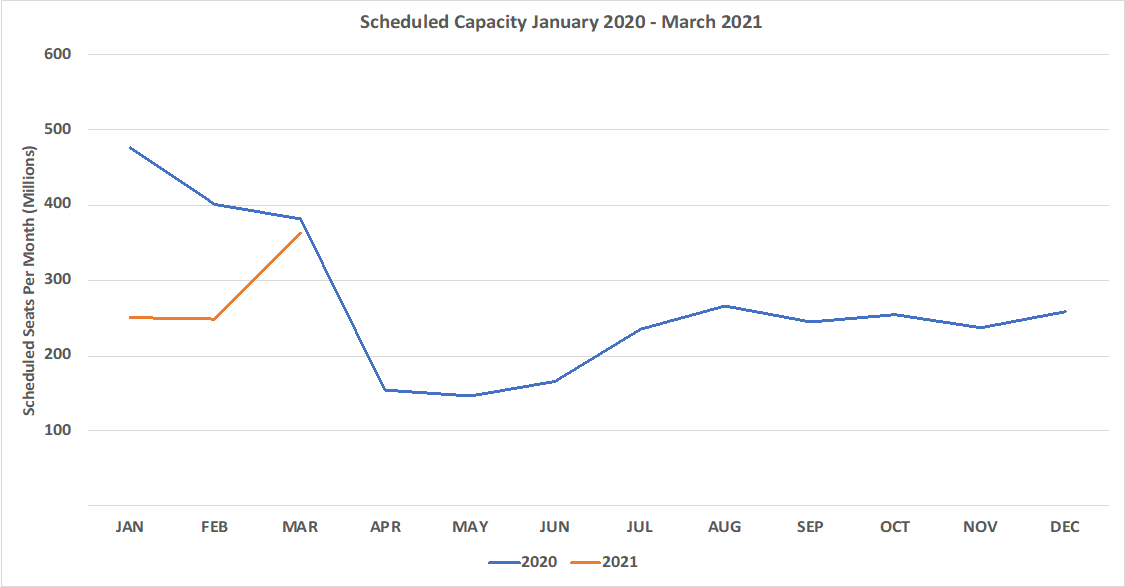
At the beginning of January scheduled airlines planned to operate some 920.5 million seats in the first quarter of the year; this week’s data reports a first quarter figure of some 820.8 million or an 11% reduction. However, it seems that airlines have yet to make any adjustments to their March schedules or are supremely confident of a massive market recovery; at the beginning of the year, they planned some 374.1 million seats and still plan some 338.5 million or around 84.5 million seats a week. Given that we are currently struggling to stay above 50 million; a near 65% increase in capacity appears very unlikely.
Chart 1 – Scheduled Airline Capacity by Month
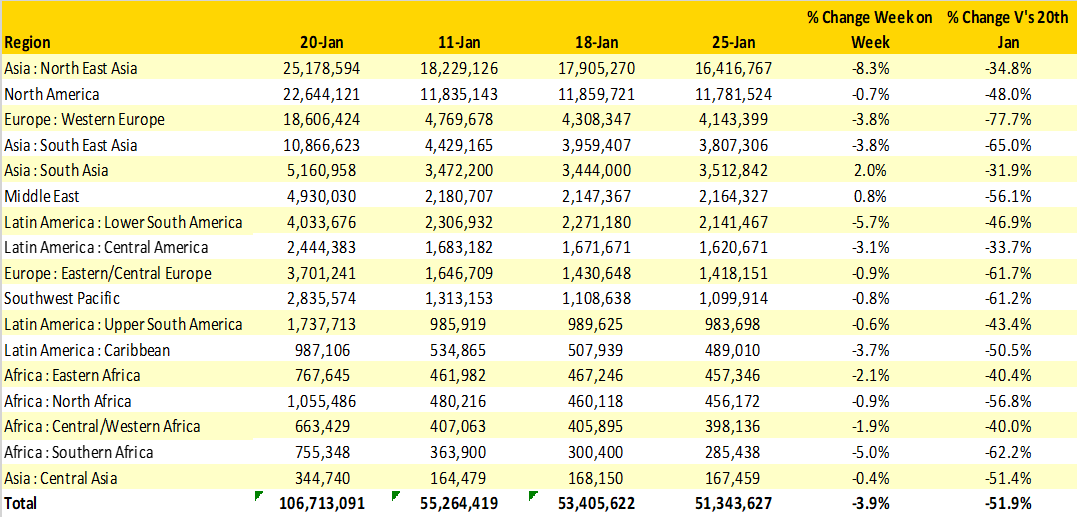
We had reported in recent weeks that capacity in North East Asia would come under pressure in the weeks building up to Chinese New Year as new lockdowns and Covid-19 outbreaks impacted Chinese capacity and that can be seen this week. Some 1.5 million seats have dropped out from the regional capacity in a week and 1.4 million of those are to, from or within China.
Nine of the seventeen global regions are now operating with less than 50% of the capacity operated in the same week last year. Western Europe is at less than 25% of its normal capacity levels and South East Asia at 35% of previous levels; two of the worlds traditional strongest markets leading the way for all the wrong reasons.
Table 1– Scheduled Airline Capacity by Region
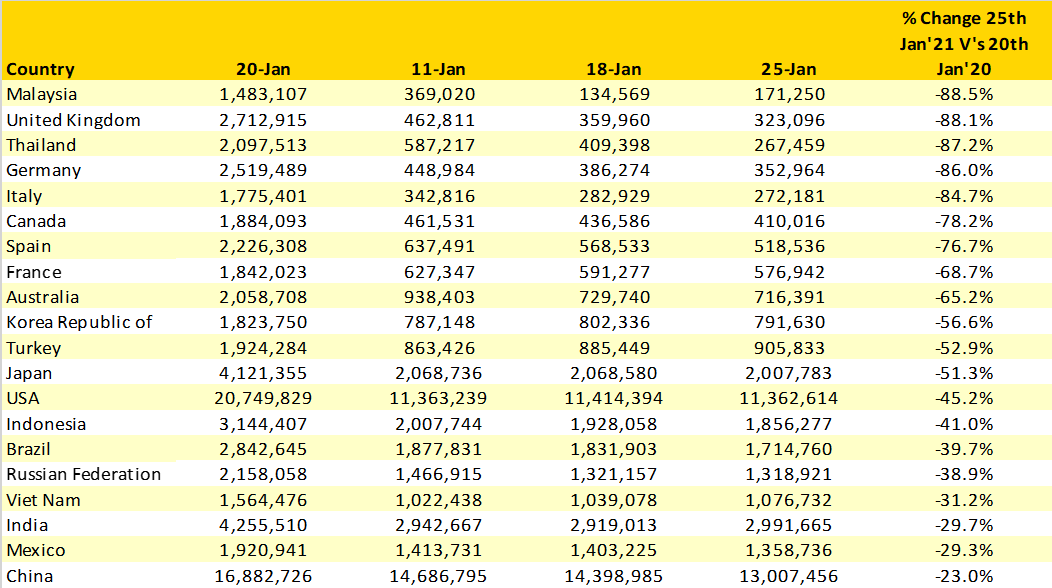
Rather than show the same top ten country markets this week, for which incidentally there is no change, we have compared the twenty largest country markets this time last year with their current status. If you are resident in Malaysia, the United Kingdom, Thailand, Germany and Italy you are probably aware of the extent of damage Covid-19 has created; all of those markets are at less than 20% of their normal capacity points, with no immediate hope of any forward movement.
Frequently ignored, Mexico continues to perform relatively well with “only” a 29% reduction in capacity year on year as the country has continued to allow traffic to flow from core markets such as the United States and enjoyed the benefit of a domestic market that continues to operate with some 950,000 seats a week.
Table 2- Scheduled Capacity, Top 20 Countries Markets, Percentage Change Year Over Year
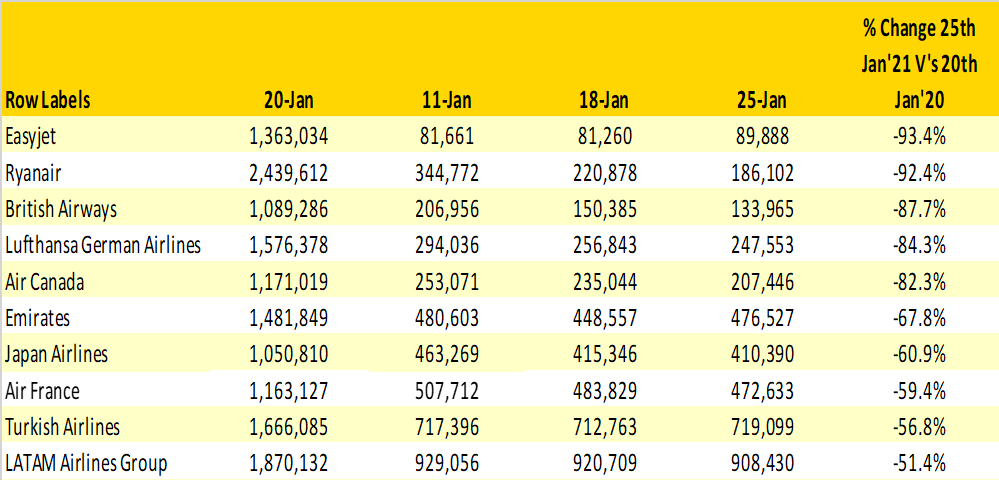
Looking at what were the world’s largest airlines in January 2020 there are some stark changes in capacity from what were some of the majors. Both easyJet and Ryanair are now operating at less than 10% of their historic capacity levels and in total five carriers are at less than 20% of their normal operation. Collectively the top 20 global airlines operated some 43.2 million seats (40% of global capacity) and they now operate 21.2 million, incredibly the same proportion as they currently provide.
Table 3- Scheduled Capacity Top 10 Airlines
This week some 661 airlines filed schedules, ranging from the very big carriers through to airlines such as Air Flamenco (Puerto Rico) and Air Saint-Pierre (Saint Pierre & Miquelon) who both continue to operate the same levels of capacity as twelve months ago providing valuable connectivity to local communities. And connectivity remains one of the key issues throughout the whole Covid-19 crisis; twelve months ago, some 47,756 airport pairs were operated with over half of those (54%) operated with at least a daily frequency; this week there are some 31,046 airport pairs planned so a reduction of 35% in airport pairs with a similar proportion (48%) being operated on a daily basis as last year.
With the first month of the year now almost complete any signs of a market recovery have evaporated and capacity has been cut every week of the month. It is likely that those capacity cuts will carry on through to the end of March at the earliest as the industry awaits positive news from the various vaccination programmes currently underway. Ironically, we hear news of new carriers being planned whilst at the same time established airlines seek further support from shareholders. The fact that new airlines are seeking to launch highlights that in the long-term aviation will bounce back and the recovery could be very quick and strong; the key question remains……how long is the long-term?
To learn more about the data behind this article and what OAG has to offer, visit https://www.oag.com/.


Sign up to receive our stories in your inbox.
Data is changing the speed of business. Investors, Corporations, and Governments are buying new, differentiated data to gain visibility make better decisions. Don't fall behind. Let us help.


Sign up to receive our stories in your inbox.
Data is changing the speed of business. Investors, Corporations, and Governments are buying new, differentiated data to gain visibility make better decisions. Don't fall behind. Let us help.