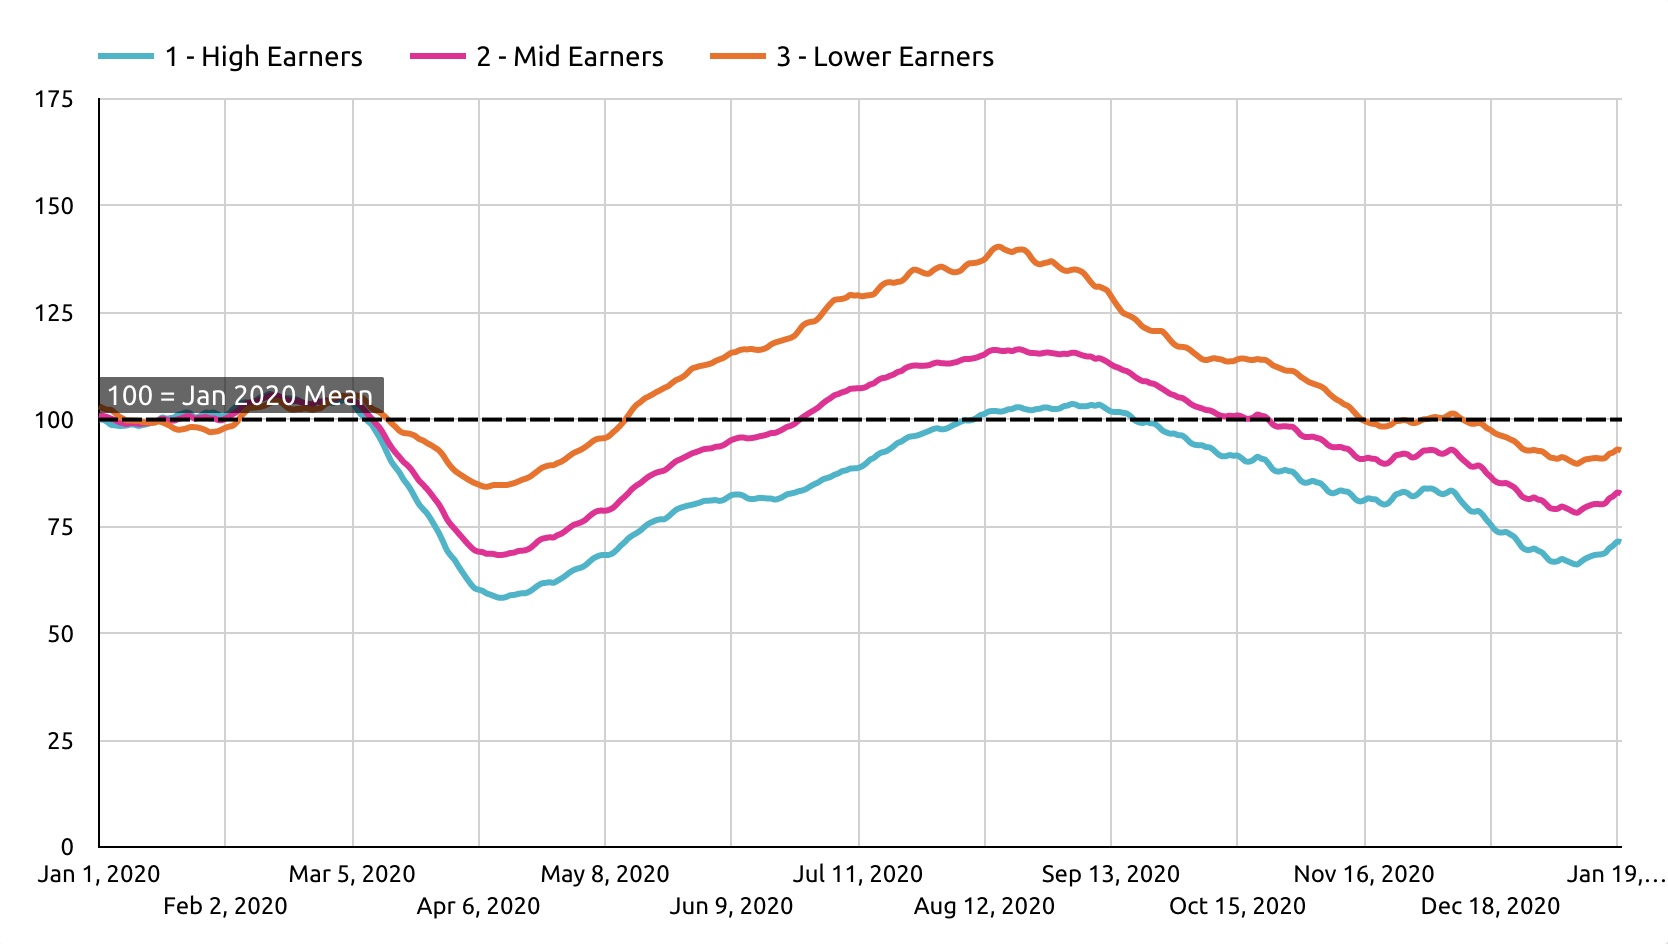
The pandemic has touched all parts of society. But as new data from Huq Industries shows, the effect has been felt unevenly and particularly in respect of different socio-economic groups. We are all encouraged to stay at home where possible, and to limit our movements and social interactions. To that end, the chart below offers a measure of footfall into town and city centres across the UK, broken out by income group tercile.
National Town and City Footfall by Income Group

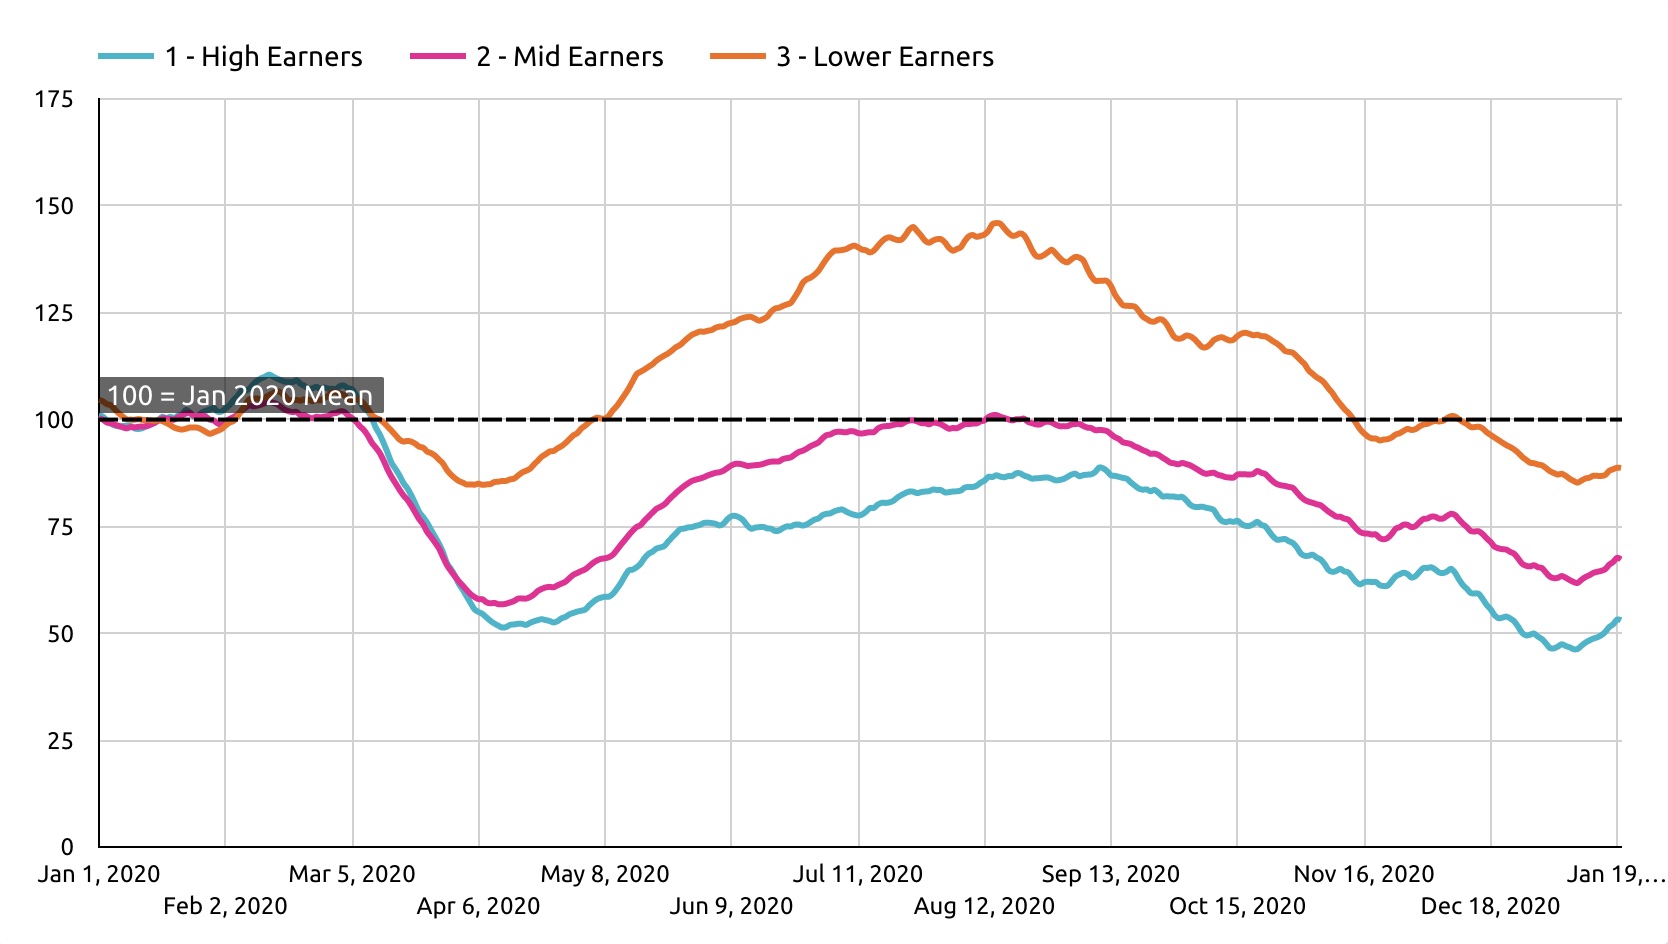
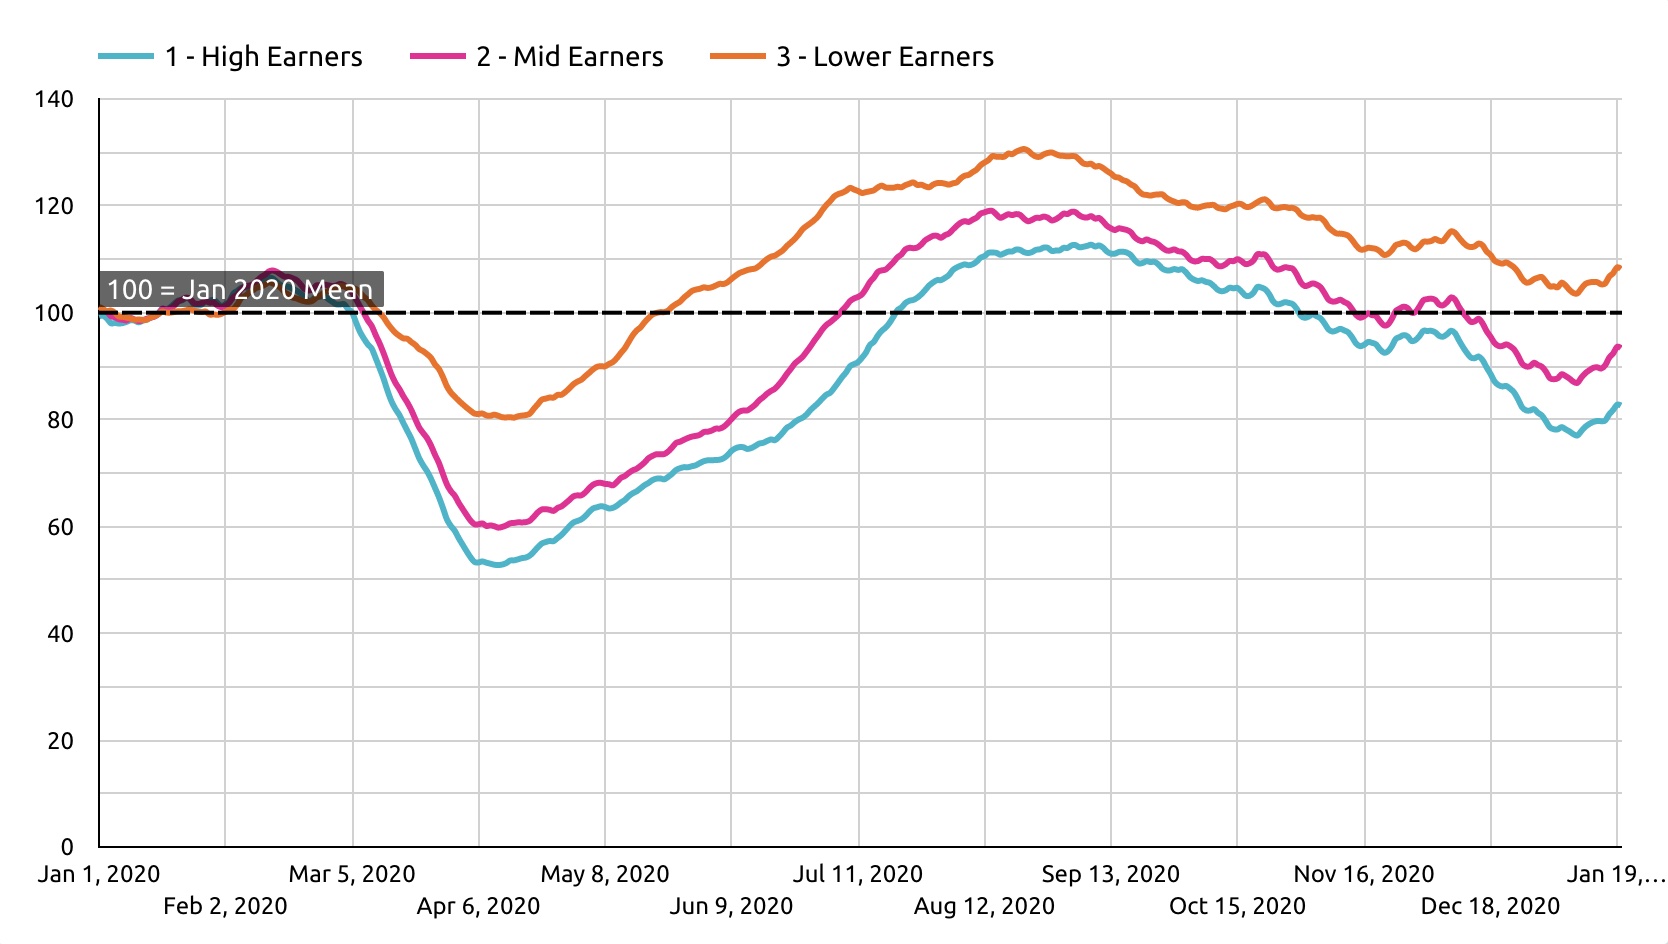
What is striking about this is that while higher income groups show pronounced changes in response to first and second wave restrictions, lower income groups display this attribute to a far lesser extent. This suggests a difference in the way that different elements of society respond to government policy. The trend shows clearly at the national level and is even more pronounced across the country’s southern centres (exc. London) – Oxford, Reading, Bristol, Exeter, Cambridge – with a disparity of up to 85pts between high and low income groups. By contrast, northern centres – Leeds, Liverpool, Sheffield and Manchester – exhibit this trend to a much lesser extent with an equivalent disparity of just 35pts.
Southern Centres Footfall by Income Group

The currents that drive these features are complex, but a constant that underpins these groups is necessity, and one example of necessity concerns employment. Service industry workers – who typically attract higher incomes – are able to carry out their work from home. Lower-paid workers employed in manufacturing or transport do not have that option. Age may also be a factor, with those older and more advanced in their careers displaying more caution in response to the uneven health risk from Covid-19. Similarly, space may play a role; more affluent members of society may have access to more space to exercise and relax at home.
Northern Centres Footfall by Income Group

These indices have been created by counting the number of unique visitors to towns and city centres across the UK and aggregating the results across different town and city groups. Centre visitors have been classified by income group tercile according to ONS figures at the Middle Layer Super Output Area level (MSOA).
The outputs shown here are drawn directly from Community Vision, an innovative product from Huq Industries designed specifically for local government organisations to monitor the risks presented by Covid-19, and to support their economic development and regeneration goals. To learn more about Community Vision and how these outputs can support decision-making, please get in touch with us today.
To learn more about the data behind this article and what Huq has to offer, visit https://huq.io/.


Sign up to receive our stories in your inbox.
Data is changing the speed of business. Investors, Corporations, and Governments are buying new, differentiated data to gain visibility make better decisions. Don't fall behind. Let us help.


Sign up to receive our stories in your inbox.
Data is changing the speed of business. Investors, Corporations, and Governments are buying new, differentiated data to gain visibility make better decisions. Don't fall behind. Let us help.


