Over the past few years the number of Special Purpose Acquisition Companies (SPACs) going public has exploded. A number of those have completed an acquisition and are now trading as that target company. Using SPACtrack.net, we took a look at a subset of these companies hoping to determine whether the hiring patterns of these SPACs could tell us something about their future performance. In our analysis, we separate our SPACs into groups by performance, and dig deeper into each group’s hiring practices to determine what differentiates them.
First, using SPAC Track’s list, we will filter down to all companies that have completed an acquisition, giving us a starting point of 130 companies. We filter that result further by joining the list of 130 companies with LinkUp’s coverage, which brings us down to 45 securities we will analyze for this post.
In an attempt to provide the most value from this exercise, we will separate these 45 securities into 2 groups: Underperformers and Overperformers. The SPAC Track list has start dates going back to 2007, with the average start date being February 2018. We will take the average of all these dates and use that to calculate an annualized return of 12.05% for the S&P 500. This annualized return will then be used to separate our groups.
With the groups separated using this annualized return, we are left with a total of 21 Overperformers and 24 Underperformers. The Overperformers now have an IPO date of June 2018, while the Underperformers have an IPO date of October 2017. This may suggest that SPACs that have been traded for longer amounts of time perform poorly in comparison to their younger counterparts.
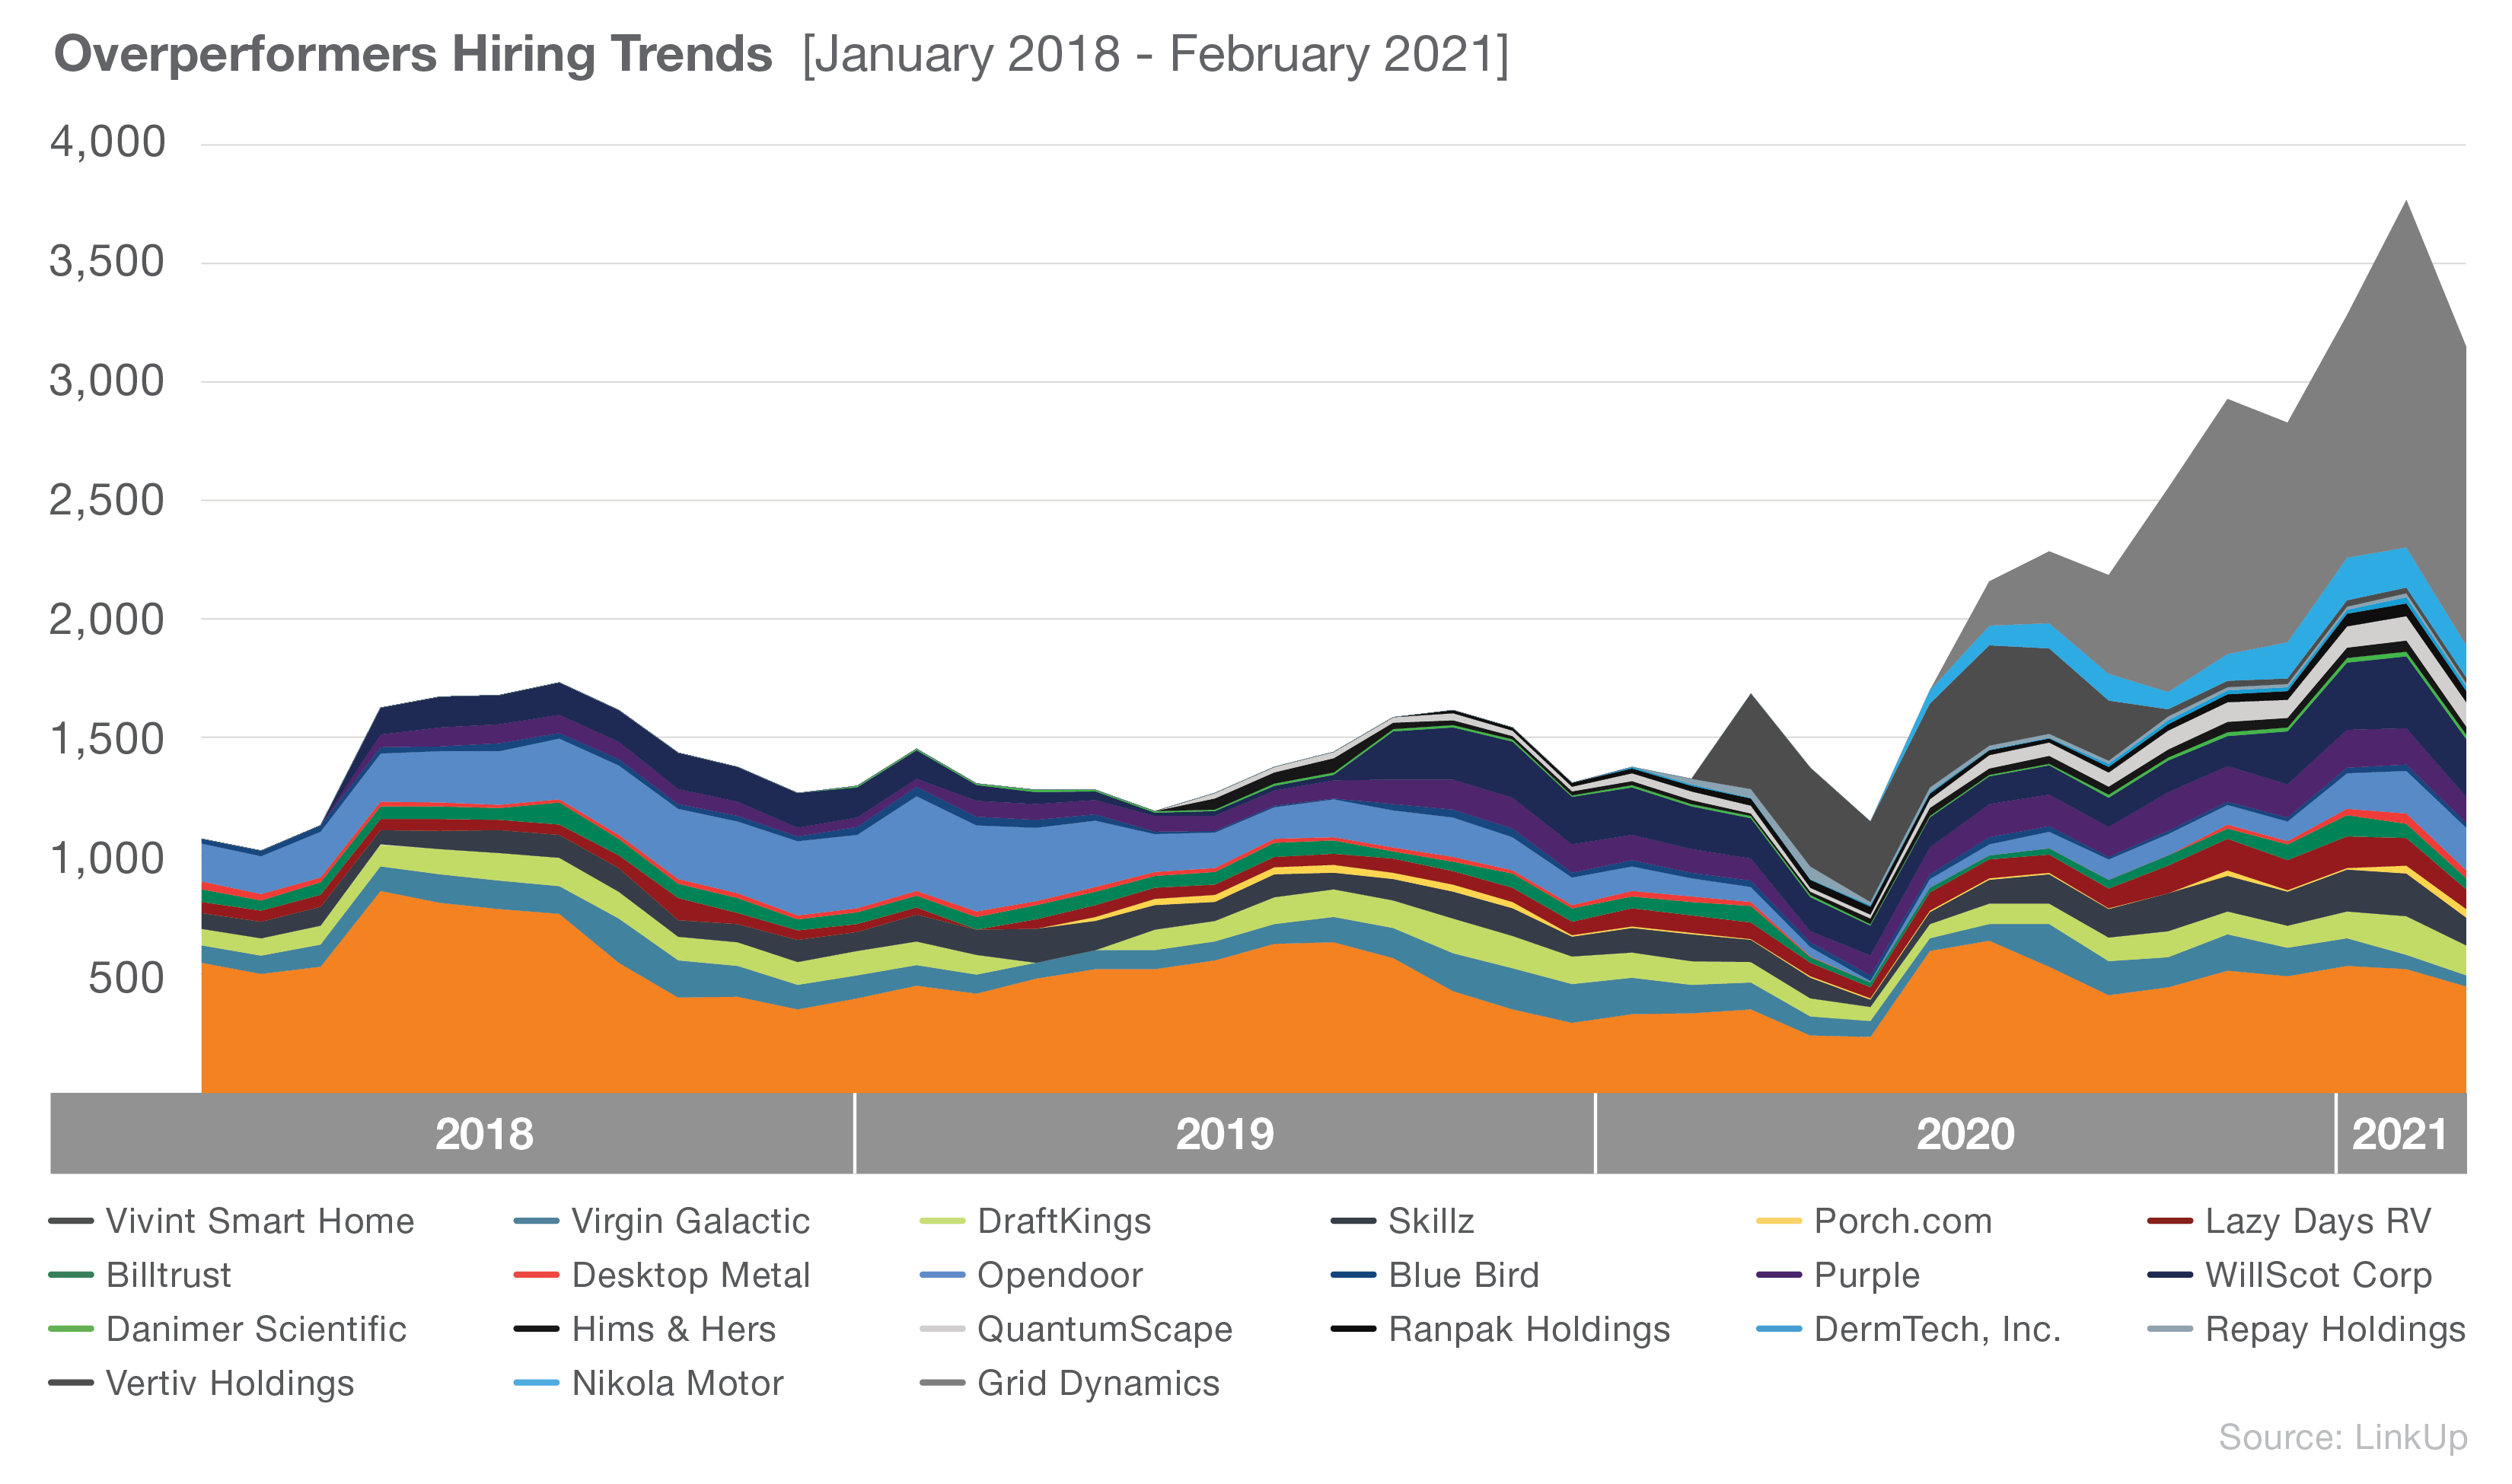
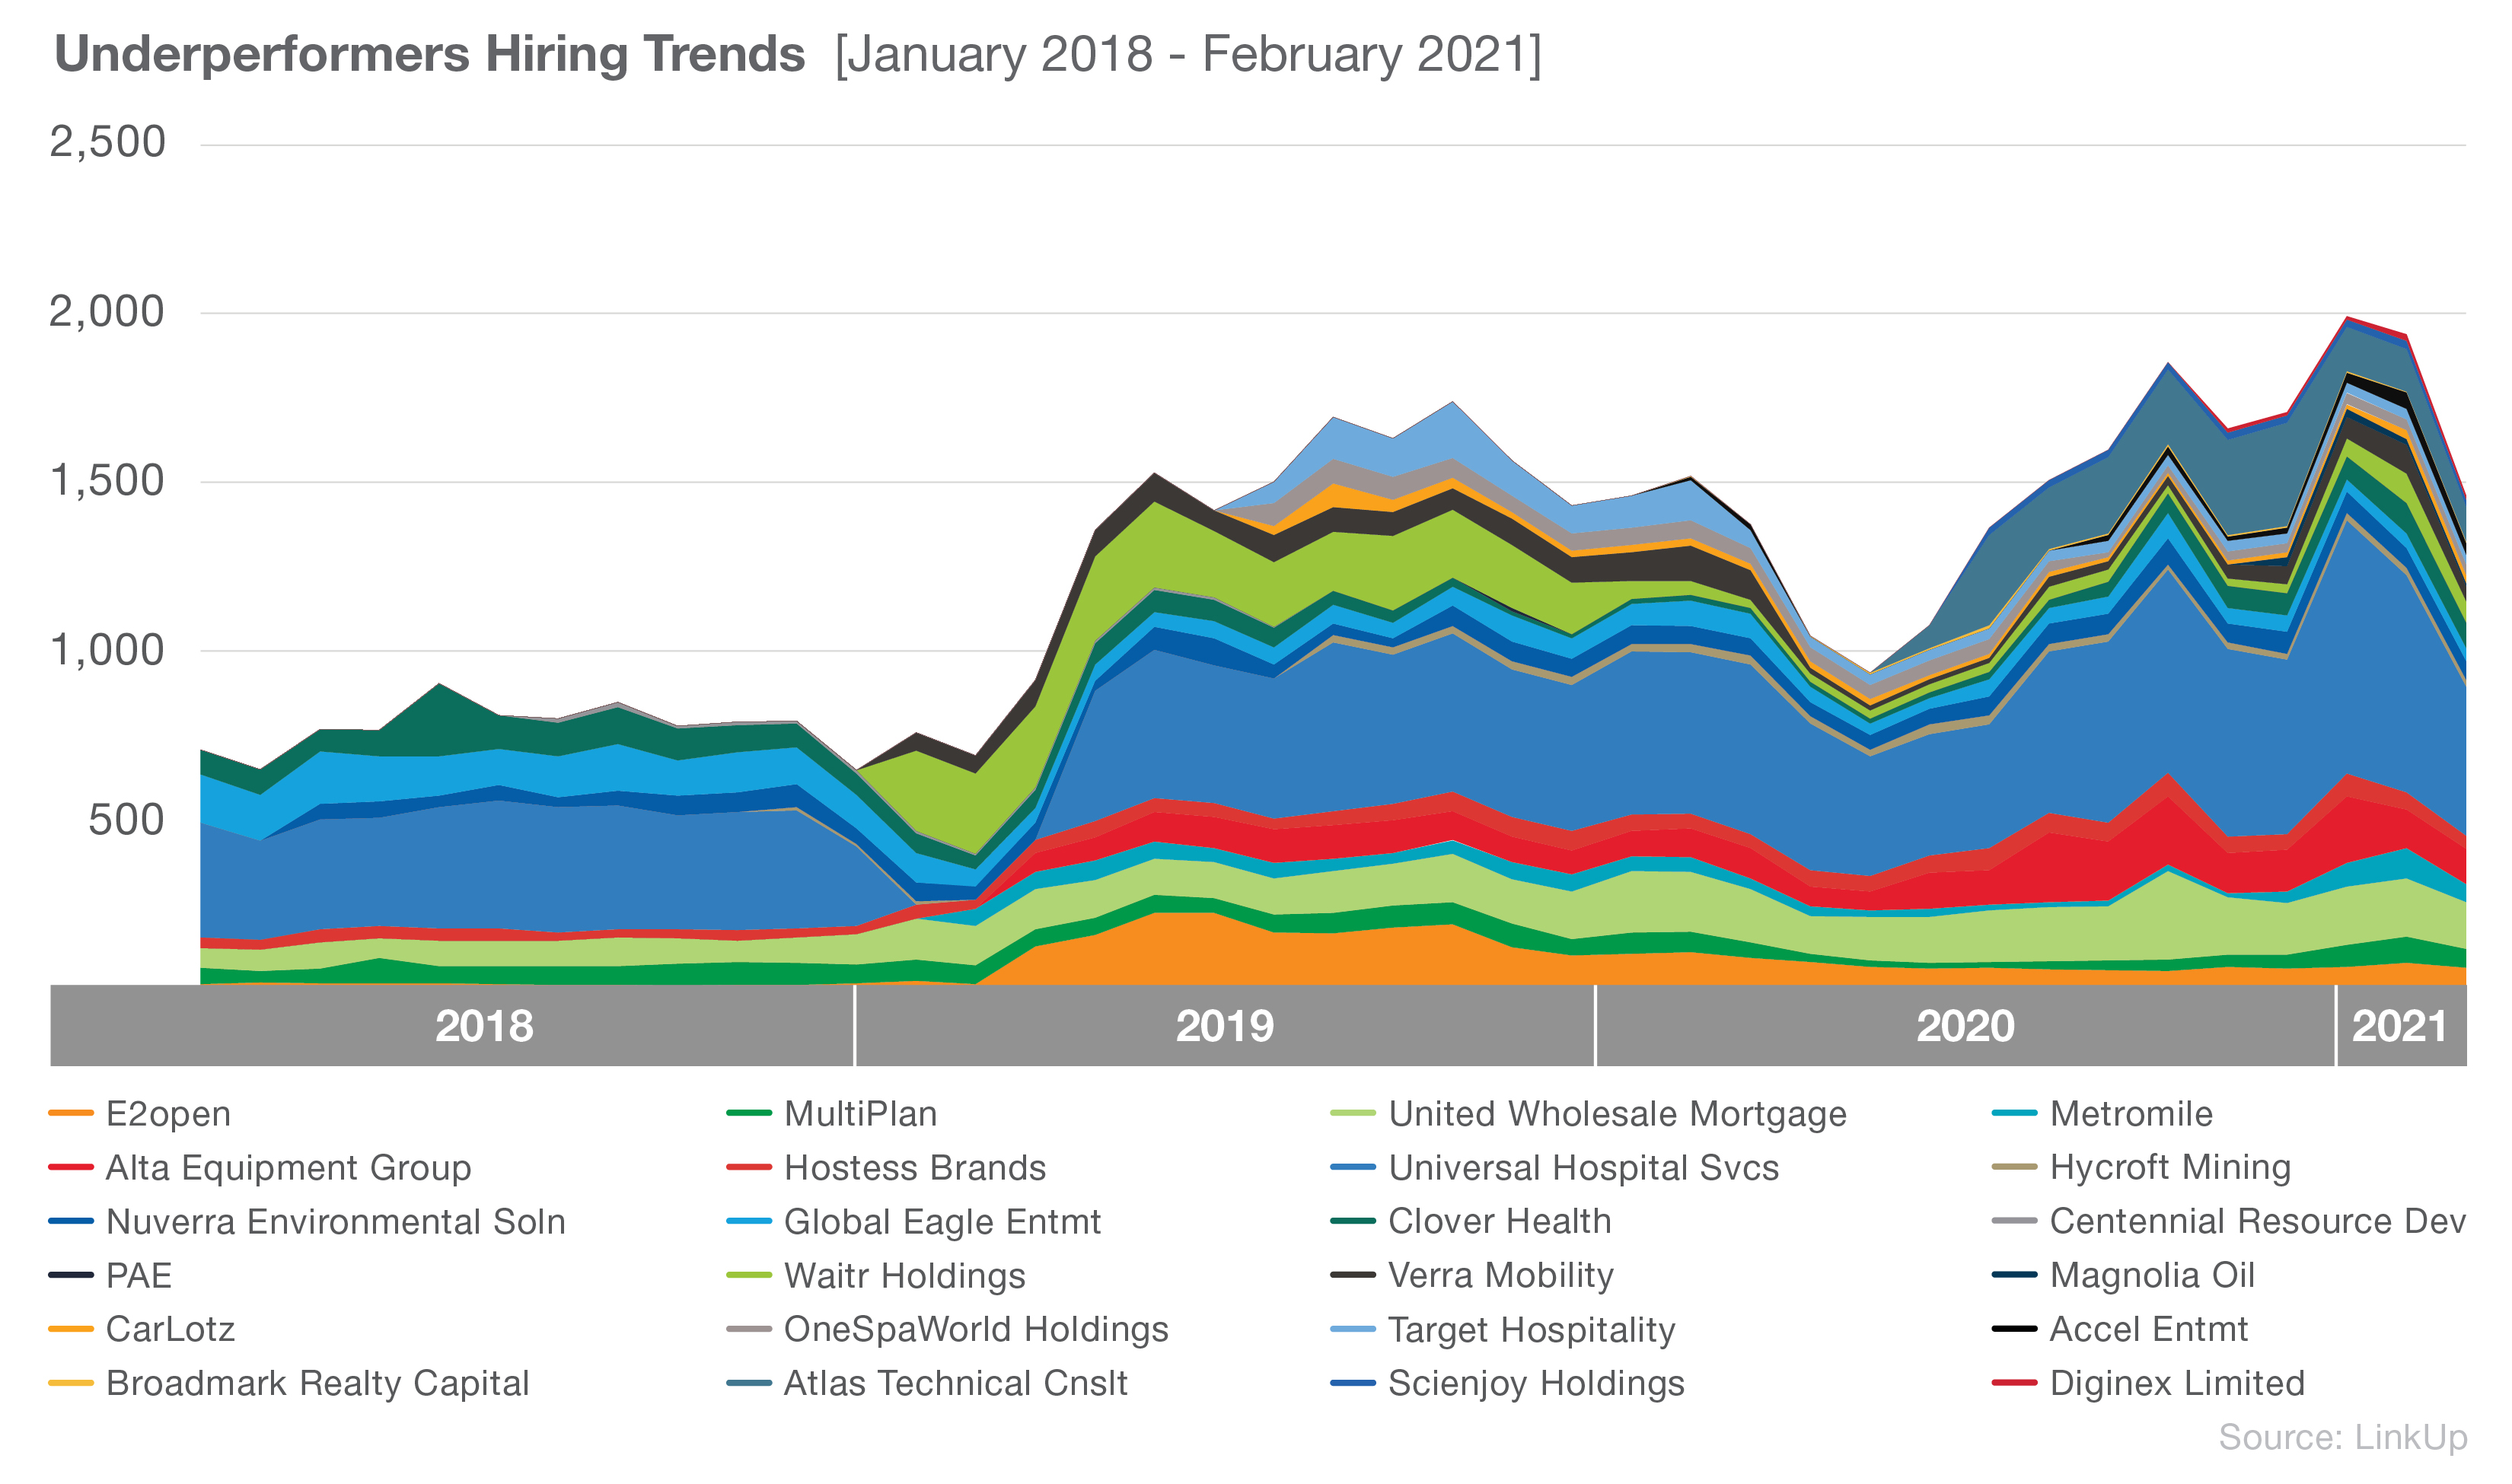
One trend we observe is that our Underperforming group seems to be just returning to per pandemic hiring levels after a sharp decline at the onset of COVID-19. Our Overperforming group, however, initially experienced a decline during COVID, but quickly recovered and have now surpassed pre-pandemic hiring levels.


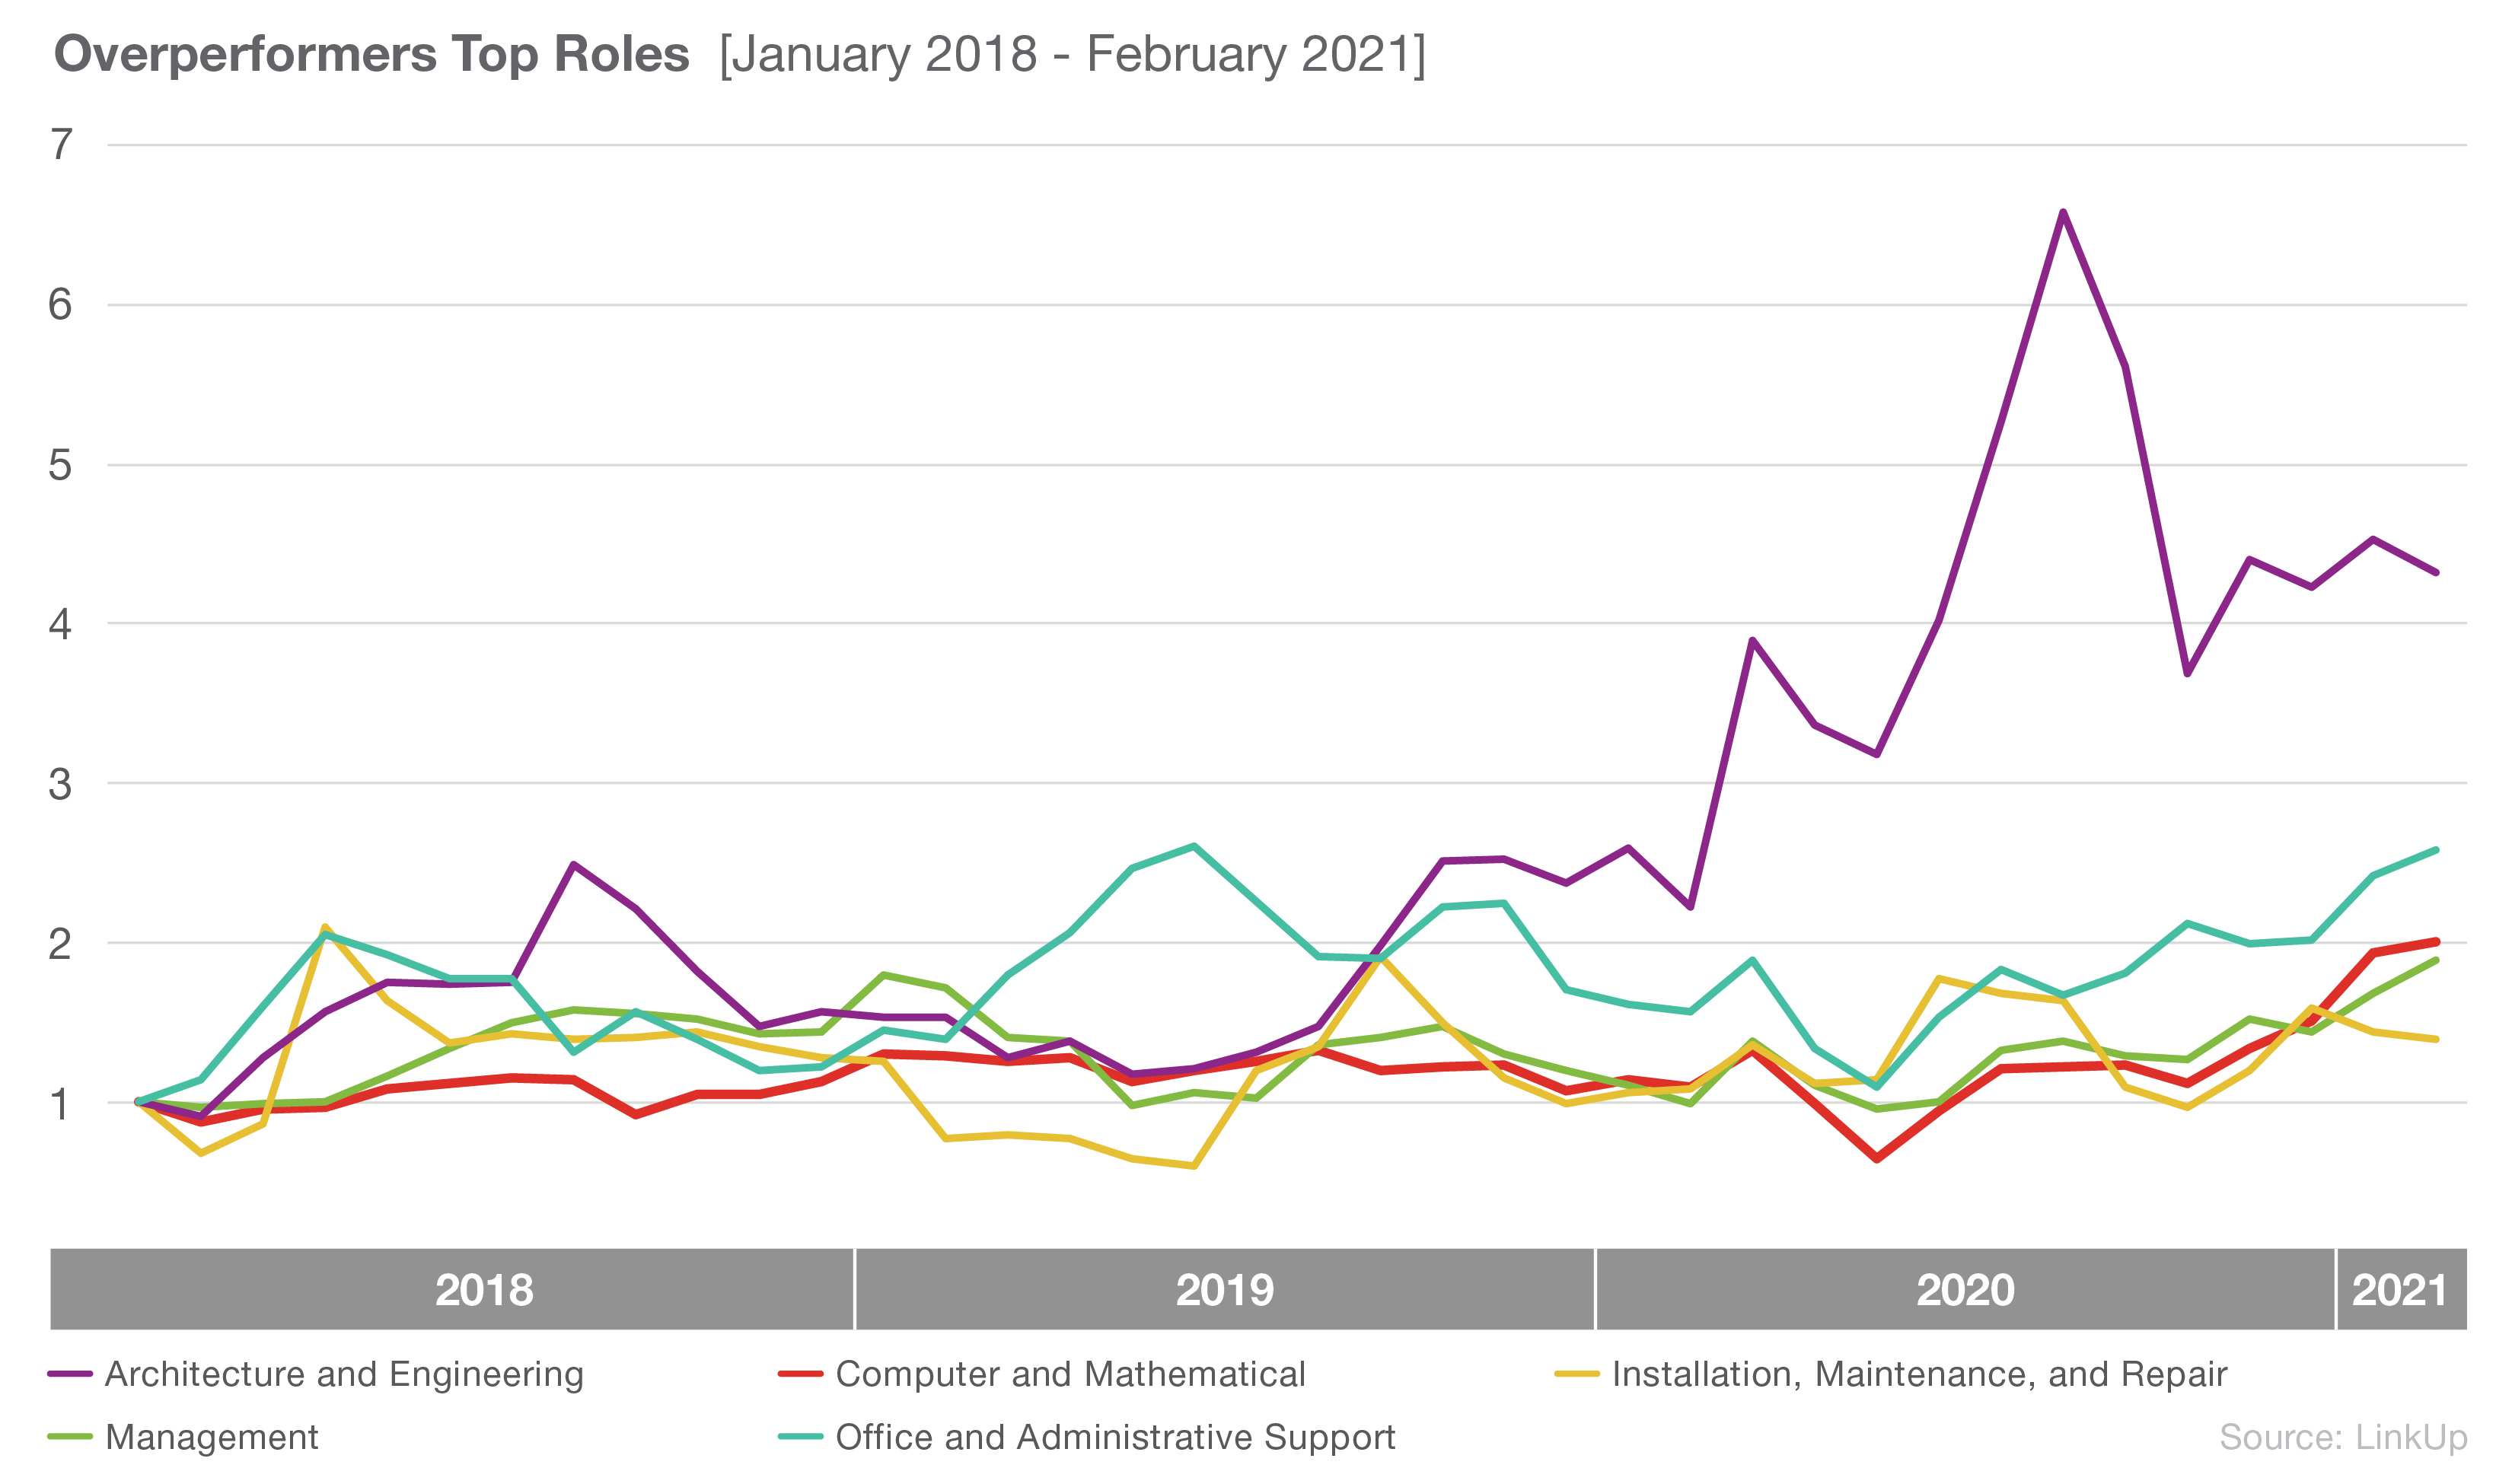
Taking a closer look at the types of roles Overperformers were hiring for, it looks like there has been steady growth in the Architecture and Engineering occupations, as well as Computer and Mathematics.


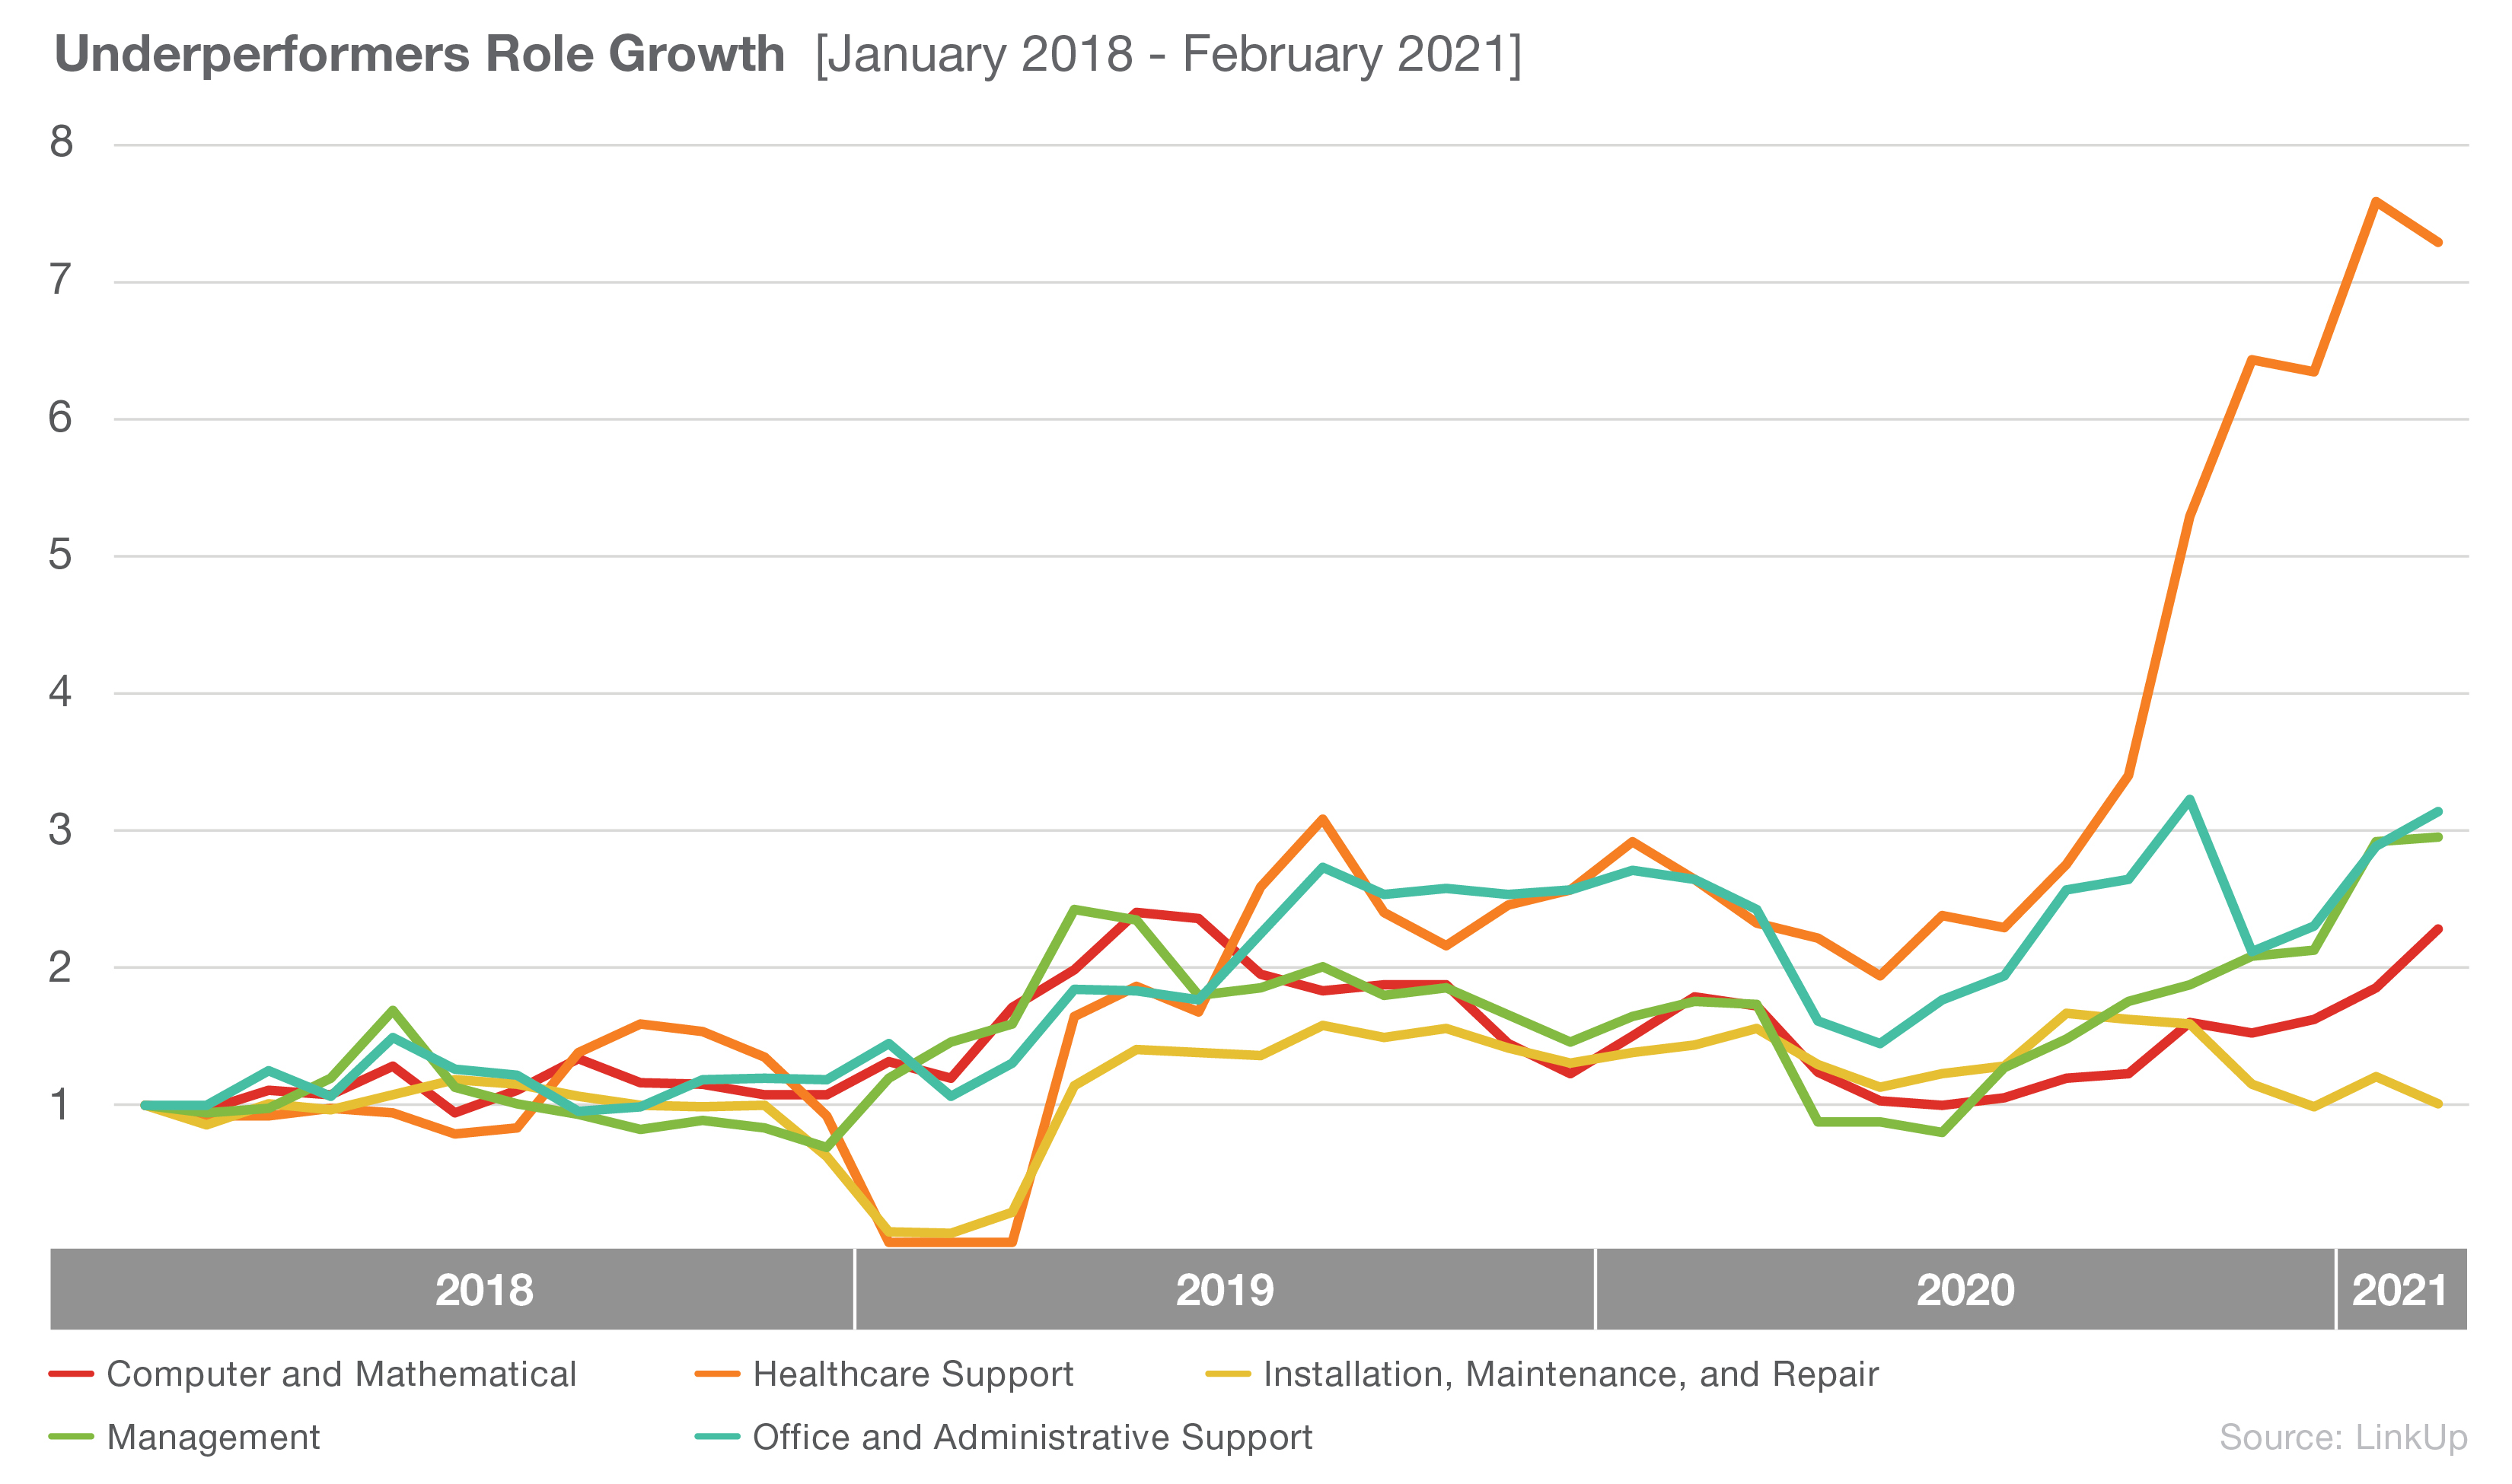
Turning to the Underperformers group, we see a large increase in Healthcare roles.
Two interesting differences start to emerge here. First, the group of Underperformers does not have Engineering among their top roles. They also seem to prioritize Management and Administrative positions over technology focused positions. This is the opposite of what our Overperformers group has done.
Taking a look at DraftKings, one of the more successful SPACs, we can see that they follow a similar pattern. Our data for DraftKings goes back to 2014, and we see their top hiring group was almost always Computer and Mathematical occupations. Drawing on what we have seen, it appears markets prefer SPACs who prioritize hiring for roles that lead to product developments over roles like management.
To learn more about the data behind this article and what LinkUp has to offer, visit https://www.linkup.com/data/.


Sign up to receive our stories in your inbox.
Data is changing the speed of business. Investors, Corporations, and Governments are buying new, differentiated data to gain visibility make better decisions. Don't fall behind. Let us help.


Sign up to receive our stories in your inbox.
Data is changing the speed of business. Investors, Corporations, and Governments are buying new, differentiated data to gain visibility make better decisions. Don't fall behind. Let us help.


