
Coronavirus cases in the U.S. were again on the rise last month, stalling the hope that we were nearing the end of the pandemic, despite wider availability of vaccines. While this spring’s bump — aided by fast-spreading variants — was much smaller than the spike in confirmed cases in January, it surpassed the peaks of previous surges last spring and summer. What stands out in stark contrast to previous phases of the pandemic, however, are the demographics of last month’s sickest counties, perhaps reflecting changing behaviors among those who had previously been more strictly following COVID precautions.
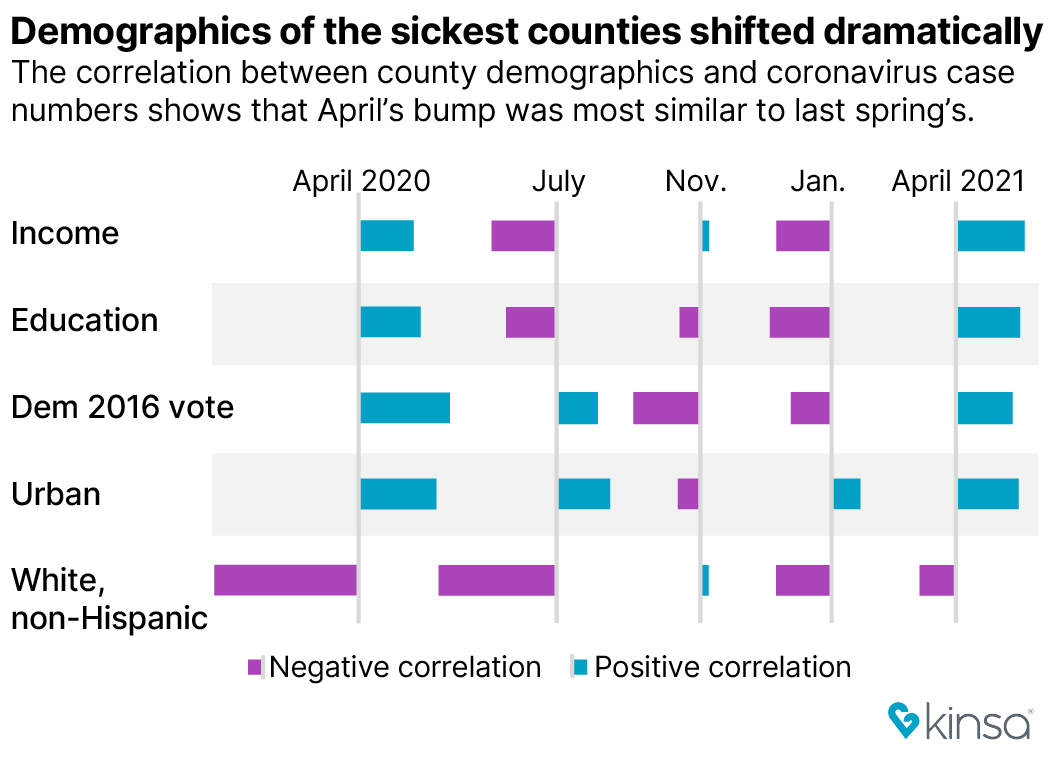
In a race against variants, more than a third of the population has been fully vaccinated. The inoculations are having a noticeable impact on illness, especially among older adults — three quarters of whom have been fully vaccinated. Amid these changes, April’s surge was also the first since last spring’s to have a larger effect on more educated counties and a significantly higher impact on more wealthy counties.
In April, the sicker counties were ones where travel to certain types of places increased the most between January and April, based on an analysis of anonymized cell phone data from SafeGraph. There was a significant correlation between higher cases and increased visits to grade schools. There was also a correlation between sicker counties and increased trips to restaurants, bars and preschools.
An analysis using data from the Centers for Disease Control and Prevention and the Census Bureau shows that each pandemic surge period affected demographic groups differently. While cases were elevated from November through January in what could be considered one large wave, the demographics of who was most affected and the expected underlying reasons for surging cases shifted significantly between November and January:
April 2021
January 2021
November 2020
July 2020
April 2020
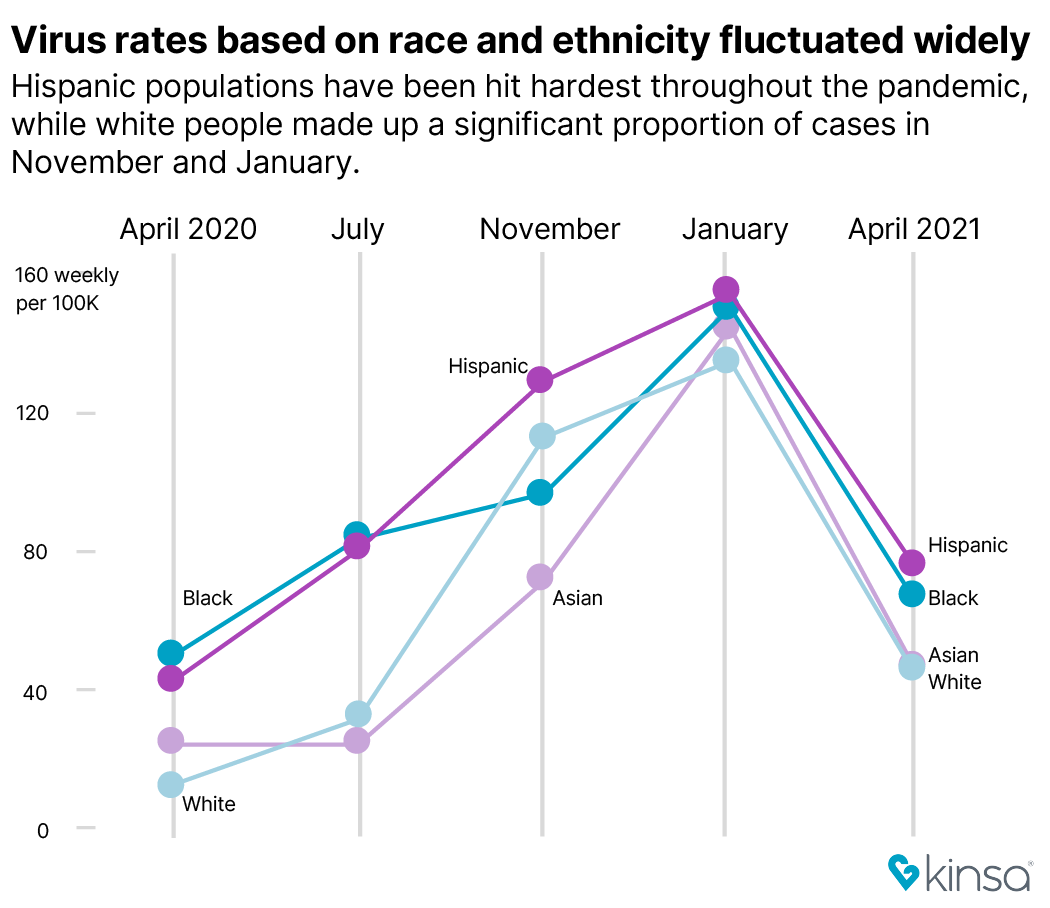
Despite COVID’s recent effects on wealthier counties, minority populations have been the most heavily impacted by the virus and in general suffered worse effects once sick. Hispanic communities have disproportionately high case numbers over the course of every phase of the virus and were more than three times as likely than non-Hispanic white people to contract the virus in July.
The CDC collects and reports demographic data, including race, ethnicity and age on about two thirds of known COVID-19 cases. In order to estimate the COVID impact on demographics such as income and education level, we compared those metrics to case rates in each county. The results show the makeup of the sickest counties, but only approximate the demographics of those who are actually ill in those counties. While almost half of the worst 100 counties in April were located in Michigan, the analysis of demographic patterns held true with or without the inclusion of Michigan counties.
Going forward, demographics will continue to shape who is getting sickest as choices about whether to get the vaccine could be decided along ideological lines. Those differences could come into greater contrast as vaccination efforts progress. Both attitudes toward vaccines and the accessibility of getting the shots have varied by demographic groups. The next steps in vaccination will depend on reducing barriers to access, incentivizing people to get vaccinated, and increasing confidence among those who remain hesitant.
To learn more about the data behind this article and what Kinsa has to offer, visit https://www.kinsahealth.co/.


Sign up to receive our stories in your inbox.
Data is changing the speed of business. Investors, Corporations, and Governments are buying new, differentiated data to gain visibility make better decisions. Don't fall behind. Let us help.


Sign up to receive our stories in your inbox.
Data is changing the speed of business. Investors, Corporations, and Governments are buying new, differentiated data to gain visibility make better decisions. Don't fall behind. Let us help.