
For some seasonal industries, the COVID-19 pandemic has spurred increased demand outside of the typical busy season. This is particularly true for the direct-to-consumer (DTC) flower industry—including flower subscription box companies—which experienced strong sales growth throughout 2020 and early 2021. Consumer transaction data reveals that sales for DTC flower companies were collectively 28 percent higher in 2020 than in 2019, and 2021 year-to-date sales as of May are 10 percent higher than the same time frame in 2020.
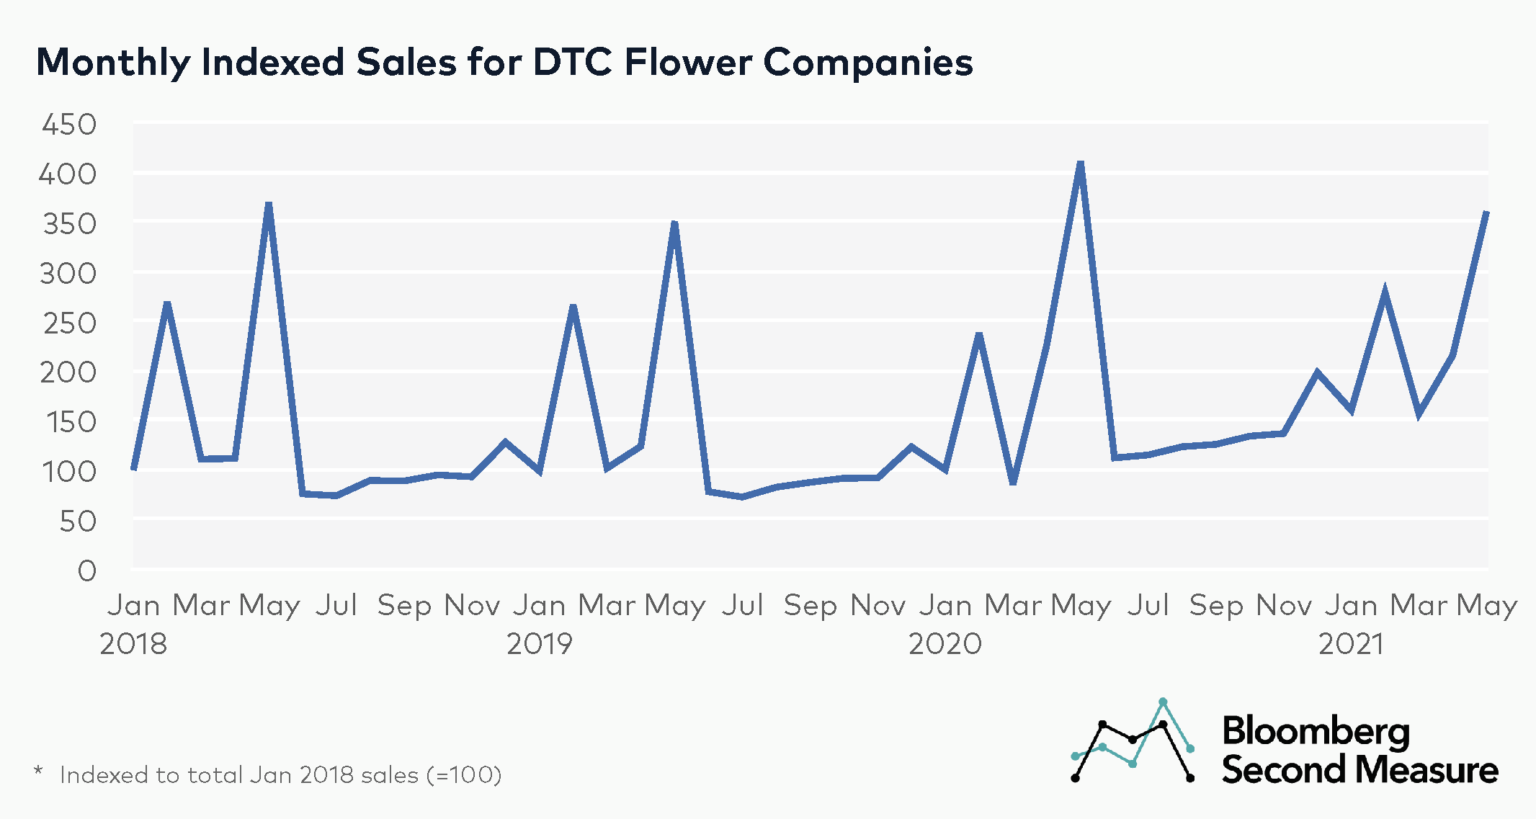
The flower industry generally experiences seasonality, with significant sales spikes in February for Valentine’s Day and May for Mother’s Day, in addition to a small increase in December for the holiday season. The same pattern has remained during COVID-19, but with higher sales volumes. Flower sales in May 2020 and February 2021 each increased 17 percent year-over-year. However, in May 2021, DTC flower sales were 12 percent lower than the year before, likely because sales in May 2020 were elevated more than in previous years.
The most significant COVID-19 era sales spike for the DTC flower industry was at the height of shelter-in-place orders in April 2020, when flower sales were 82 percent higher than in April 2019. Sales growth has slowed since then, and as of May 2021, the average monthly year-over-year sales growth in 2021 is 29 percent.
Valentine’s Day and Mother’s Day contributed smaller percentage of flower sales in 2020
Defying a longstanding trend, the percentage of flower companies’ annual sales taking place during Valentine’s Day and Mother’s Day decreased in 2020. Among the flower companies in our dataset, the collective share of annual sales during the weeks of those two holidays decreased from 24 percent in 2018 and 2019 to 19 percent in 2020. At a more granular level, the percentage of sales the week of Valentine’s Day were 3 percentage points lower in 2020 than in 2019 and sales the week of Mother’s Day were 2 percentage points lower.
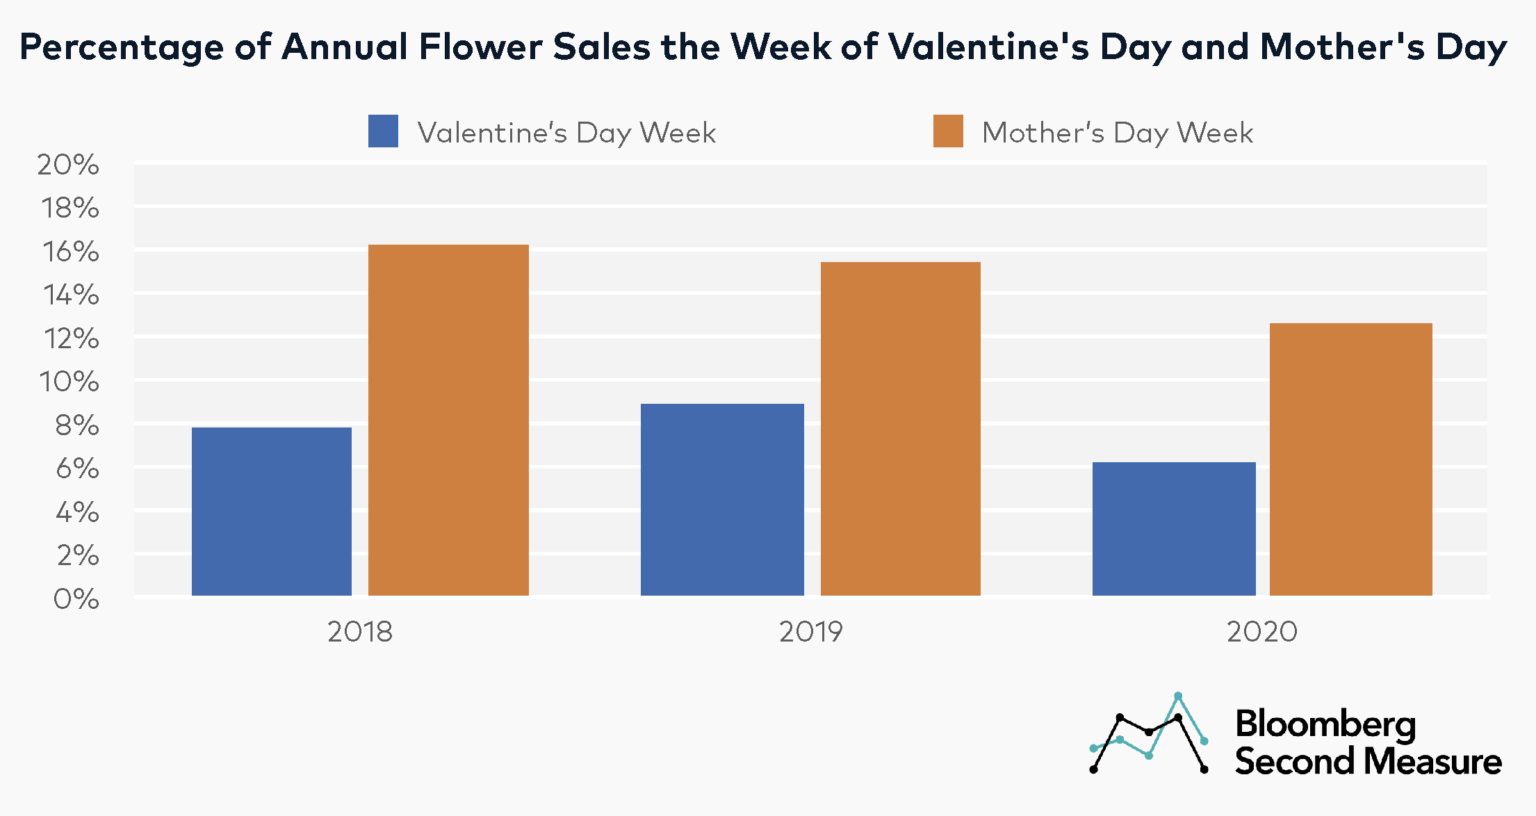
ProFlowers—which is owned by FTD, Inc.—experienced the most dramatic shift in the percentage of annual sales that occur during those two holidays. In 2018, 49 percent of annual sales occurred the week of Valentine’s Day and the week of Mother’s Day, increasing to 51 percent in 2019. However, in 2020 only 28 percent of ProFlowers’ sales took place during those two weeks.
Flower subscription companies also blooming during the pandemic
Over the past few years, some flower companies have started monthly subscription services. These include BloomsyBox, UrbanStems, and the Bouqs Company. Sales for flower subscription companies grew 75 percent between 2019 and 2020, nearly triple the growth for the DTC flower industry as a whole. Similarly, flower subscription companies’ year-to-date sales as of May 2021 are 34 percent higher than the first five months in 2020—more than triple the growth rate of the overall industry. In May 2021 alone, flower subscription sales were 6 percent higher year-over-year.
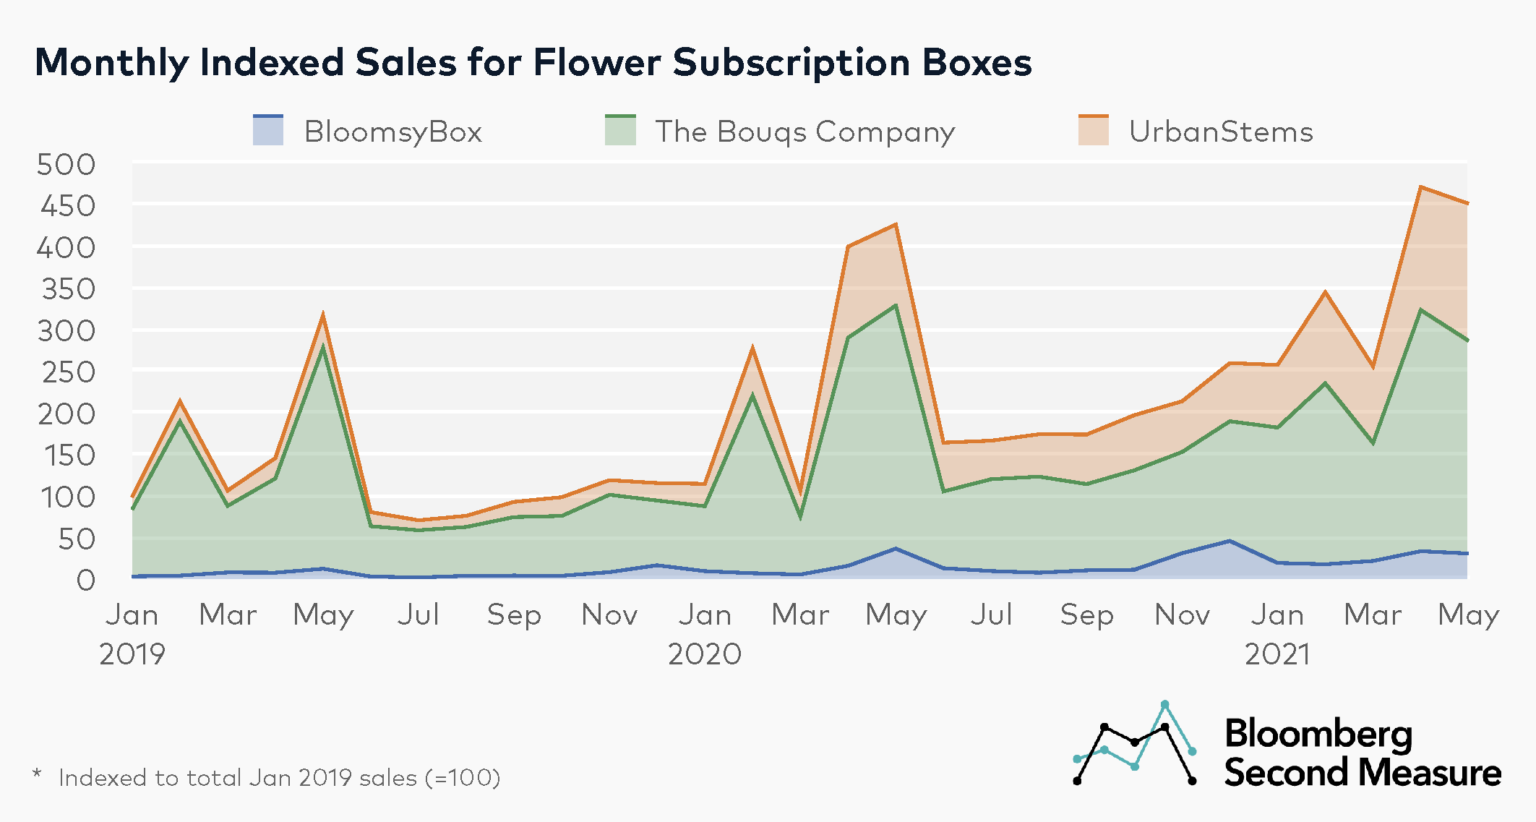
Among a select set of flower subscription companies, the Bouqs Company leads the pack with 57 percent of sales in May 2021. However, UrbanStems has been gradually increasing its share of sales among this competitive set. In 2019, UrbanStems’ average monthly share of sales was 17 percent, compared to 28 percent in 2020. As of May 2021, the average monthly share of sales for UrbanStems year-to-date is 33 percent.
New customers drive Urban Stems’ market share growth
Zooming in on UrbanStems’ increasing market share among flower subscription companies, spend migration data shows where customers are coming from. From April 2021 to May 2021, overall sales in the flower subscription market declined 4 percent. However, UrbanStems’ month-over-month sales growth outperformed the market, resulting in a market share increase of 6 percentage points.
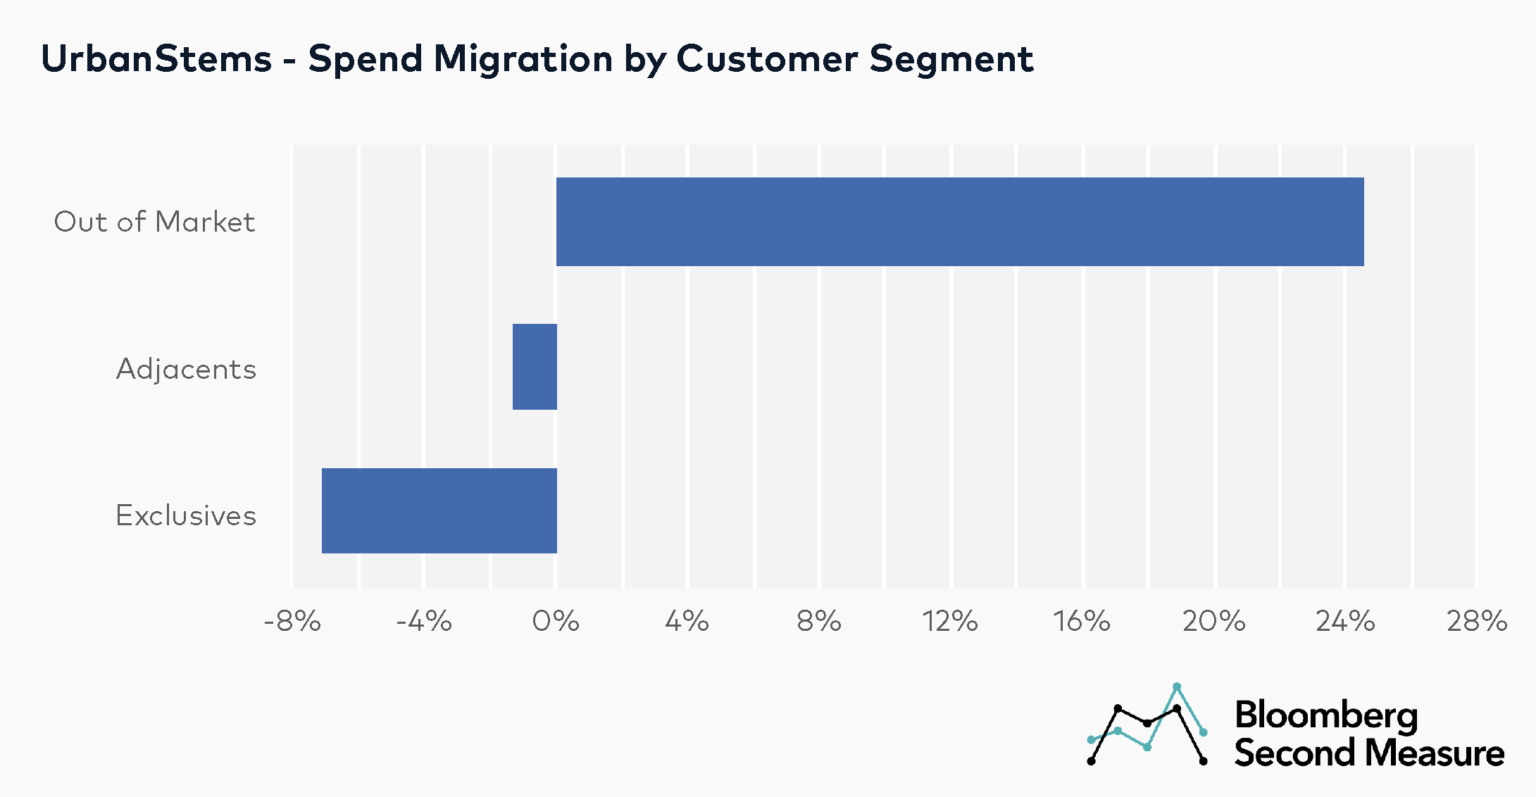
Most of UrbanStems’ market share growth in May 2021 came from capturing more spend from out of market consumers (defined as customers who had not shopped at any of these flower subscription companies in the previous month). The market share gains from out of market customers were partially offset by negative spend migration from adjacents (consumers who had shopped at a competitor the prior month) and customers who had exclusively shopped at UrbanStems in the previous month.
To learn more about the data behind this article and what Second Measure has to offer, visit https://secondmeasure.com/.


Sign up to receive our stories in your inbox.
Data is changing the speed of business. Investors, Corporations, and Governments are buying new, differentiated data to gain visibility make better decisions. Don't fall behind. Let us help.


Sign up to receive our stories in your inbox.
Data is changing the speed of business. Investors, Corporations, and Governments are buying new, differentiated data to gain visibility make better decisions. Don't fall behind. Let us help.


