Week ending 3 July
Prior to the pandemic, holiday weeks tended to be lackluster due to the lack of business and group travel. During the pandemic era, that trend seems to be returning. Week over week, demand fell 1.7 million room nights, but the decline was less than what was seen in the comparable week of 2019 when demand fell 3.7 million room nights. There is limited business and group demand now, so the leisure surge mitigated the loss as more rooms were sold this week (25.1 million) than in the comparable 2019 week (24.8 million). For the week ending 3 July 2021, occupancy was 65.4%, down 4.4 points from the previous week. Daily occupancy ranged from 60% on Sunday, 27 June 2021 to 76% on Saturday, 3 July 2021. All days posted week-to-week declines in occupancy, except for Sunday, which was up by its largest amount of the past four weeks. On a total-room-inventory basis (TRI), which accounts for temporarily closed hotels, weekly occupancy was 62.8%.
With stronger holiday demand in the week than what was seen previously, it’s no surprise that 69% of all markets saw demand indexed to 2019 above 100 with more than a third of all markets having a 10 percent demand premium over their 2019 results. However, on a week-over-week basis, nearly every market saw weekly demand decrease except for eight, led by Denver and Seattle. The latter was driven in part by the record-breaking heat wave that affected the Pacific Northwest. Despite lower weekly demand, 66% of all U.S. hotels had occupancy above 60%, down from 75% a week ago. History tells us that we can expect demand and the percentage of hotels with occupancy above 60% to rebound in the week ending 10 July 2021.
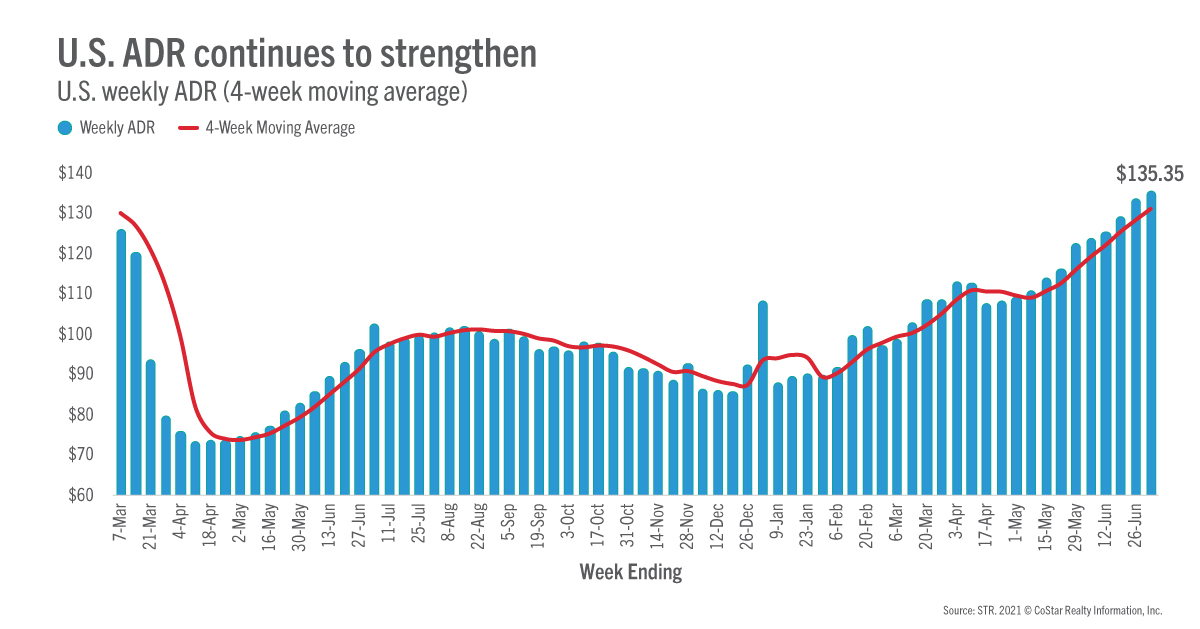
While the week-on-week decline in demand and occupancy—which was still good on a relative basis—caught our attention, the more positive news from the week was ADR, which increased to US$135. That was the highest weekly level since the first week of 2020 that included the New Year’s holiday. In fact, this week’s ADR was the seventh highest for any of the past 130 weeks. On an inflation-adjusted basis, ADR was also at its best since the beginning of 2020. Excluding the Top 25 Markets, ADR is the highest it has ever been. While Top 25 Market ADR is not at a record high, it was at its highest level since March 2020.
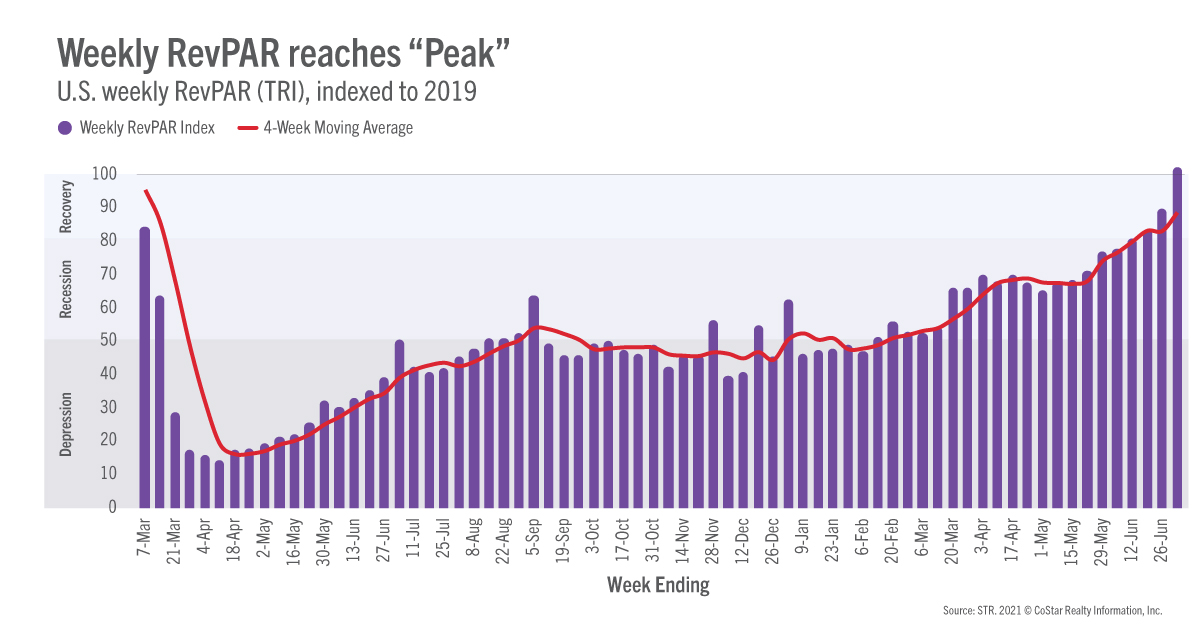
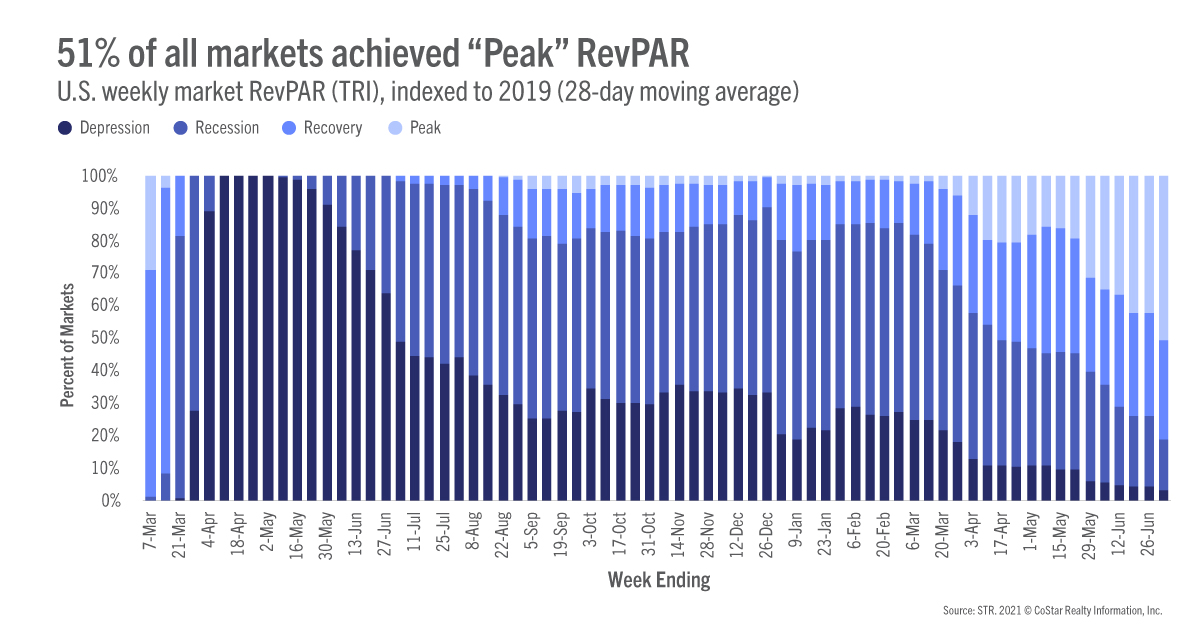
Weekly TRI RevPAR indexed to 2019 jumped into the “Peak” category (TRI RevPAR indexed to 2019 greater than 100), driven by the easy comparison to 2019, stronger leisure demand, and rising ADR. On a 28-day basis, the index remained in the “Recovery” category (TRI RevPAR indexed to 2019 between 80 and 100). We expect that in the next reporting period, weekly results will also return to the “Recovery” zone. Over the past 28 days ending 3 July 2021, 51% of markets have a TRI RevPAR that is higher (at “Peak”) than what they had in the comparable 28 days of 2019. Another 31% were in “Recovery” and only 3% (five markets) remained in the “Depression” category (TRI RevPAR indexed to 2019 less than 50), which was down from seven in the previous 28-day period. Overall, weekly TRI RevPAR was US$85, down from the previous week but still the second highest since the start of the pandemic.
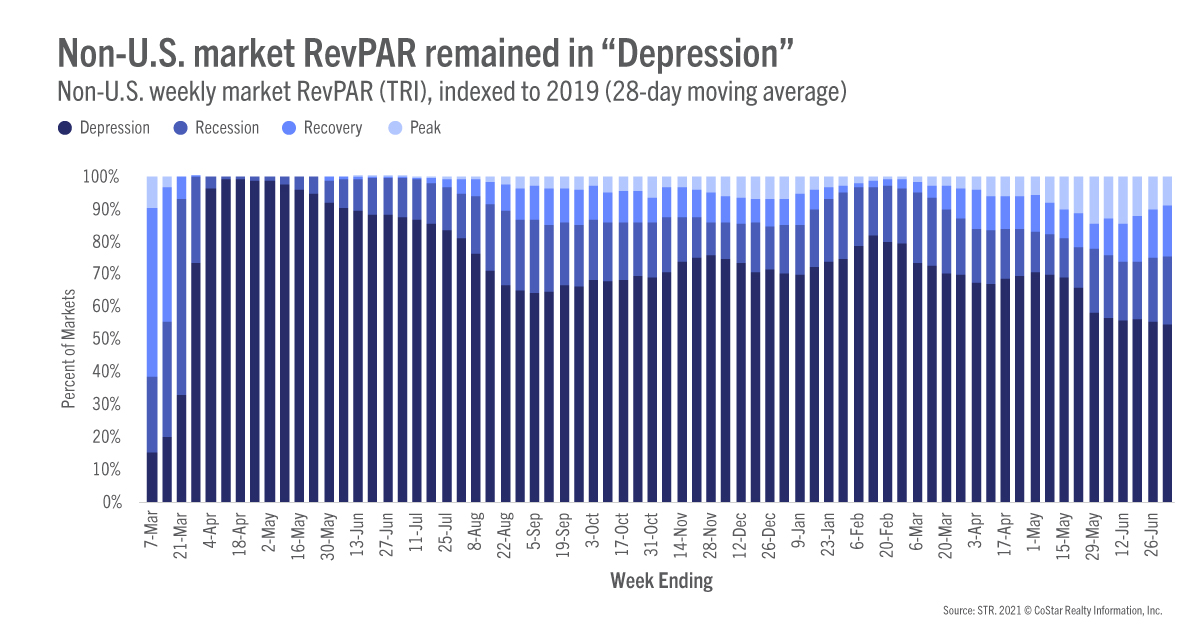
TRI occupancy outside the U.S. remained constrained with the 104-country average at 36%, down 1.3 points from the previous week. Aruba had the highest occupancy this week (82%). Among the 10 largest countries, based on supply, the U.K. performed the best with occupancy at 54%, followed by China (51%). Six of the 10 had occupancy at or below 31%, including Germany, Italy, Spain, and Japan. As a result, most non-U.S. markets (54%) were in the “Depression” category based on their 28-day RevPAR indexed to the comparable days in 2019. The percentage changed little from the previous 28-day period.
This week’s declines were attention grabbing, but not concerning when including relative comparisons. We’re reminded of the importance of keeping a level and holistic perspective when analyzing performance and to look at the larger trend versus a single week’s results. The journey to full recovery is still expected to be arduous and uneven, especially for larger, urban hotels. However, there is little doubt that we are in recovery, driven by leisure demand. The next chapter requires the return of business and groups, which we believe will happen as offices reopen, but that revival is likely to be uneven as compared to what we have seen this summer. Expect greater weekly fluctuation and keep a watch on the larger trend.
To learn more about the data behind this article and what STR has to offer, visit https://str.com/.


Sign up to receive our stories in your inbox.
Data is changing the speed of business. Investors, Corporations, and Governments are buying new, differentiated data to gain visibility make better decisions. Don't fall behind. Let us help.


Sign up to receive our stories in your inbox.
Data is changing the speed of business. Investors, Corporations, and Governments are buying new, differentiated data to gain visibility make better decisions. Don't fall behind. Let us help.