The pandemic created unique challenges for local, state, and regional economies. Downtown retail districts emptied out, businesses shuttered, and tourism ground to a halt as shelter-in-place orders spread across the country.
Now, with restrictions gradually lifting, a radically different reality is emerging. While certain sectors are returning to their pre-pandemic vitality, some areas of commercial life are forever transformed. This juncture presents government, business, and economic development leaders with a once in a generation opportunity to employ new strategies to accelerate recovery and shape local economies in favor of long term sustainable growth.
Placer.ai’s COVID Recovery Dashboard Facilitates Data-Driven Decision Making
In the months ahead, government and business leaders will need to assess the impacts of COVID on key sectors and make strategic decisions about where and how to support economic recovery.
That’s where the Placer.ai’s new COVID Recovery Dashboard comes in.

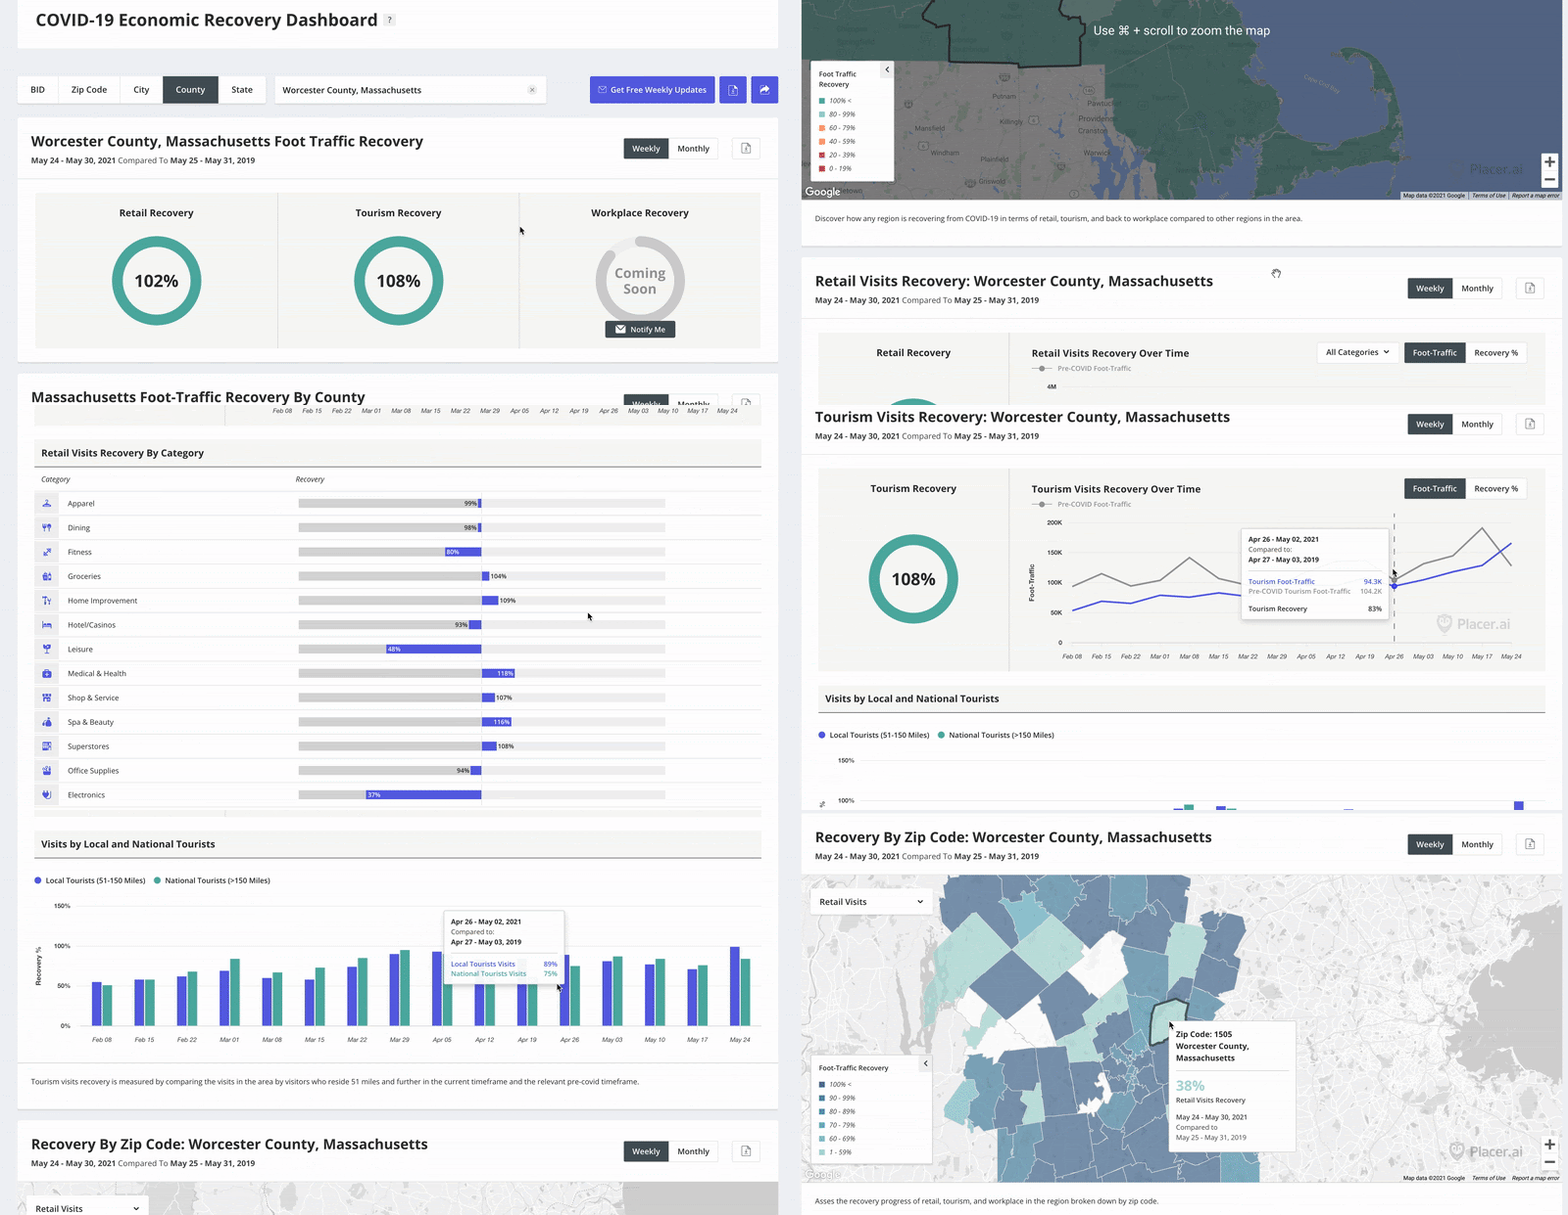
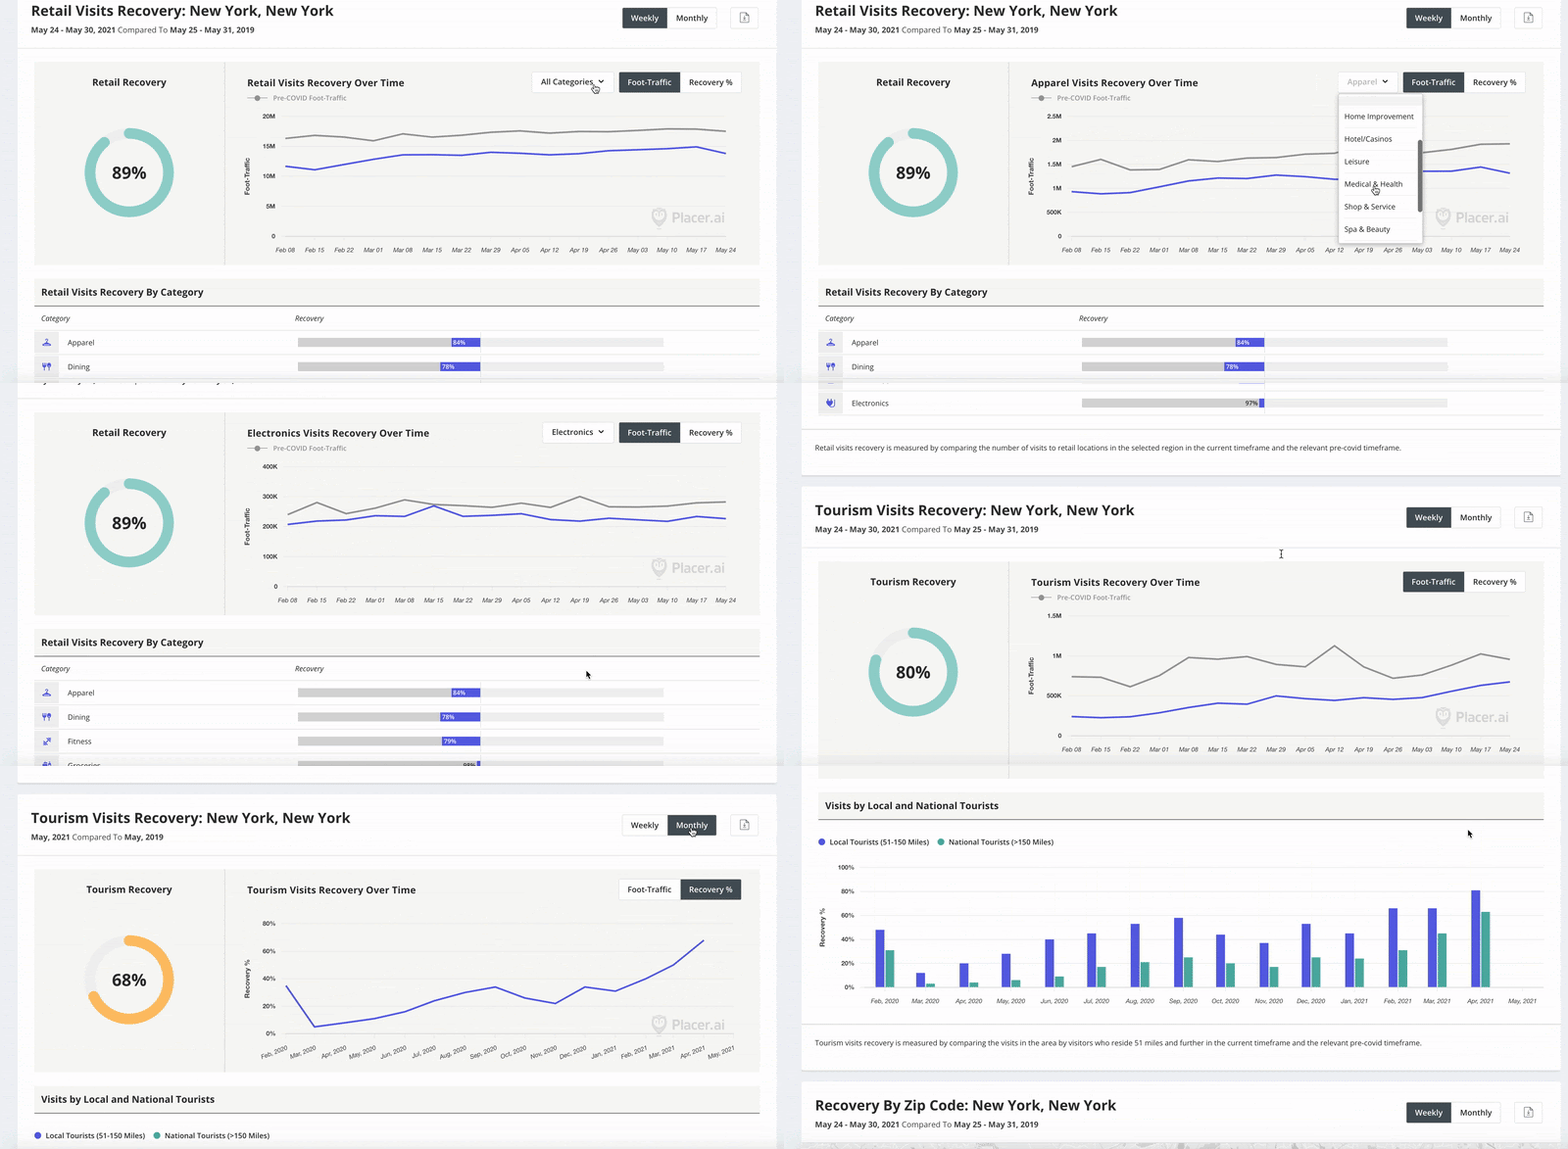
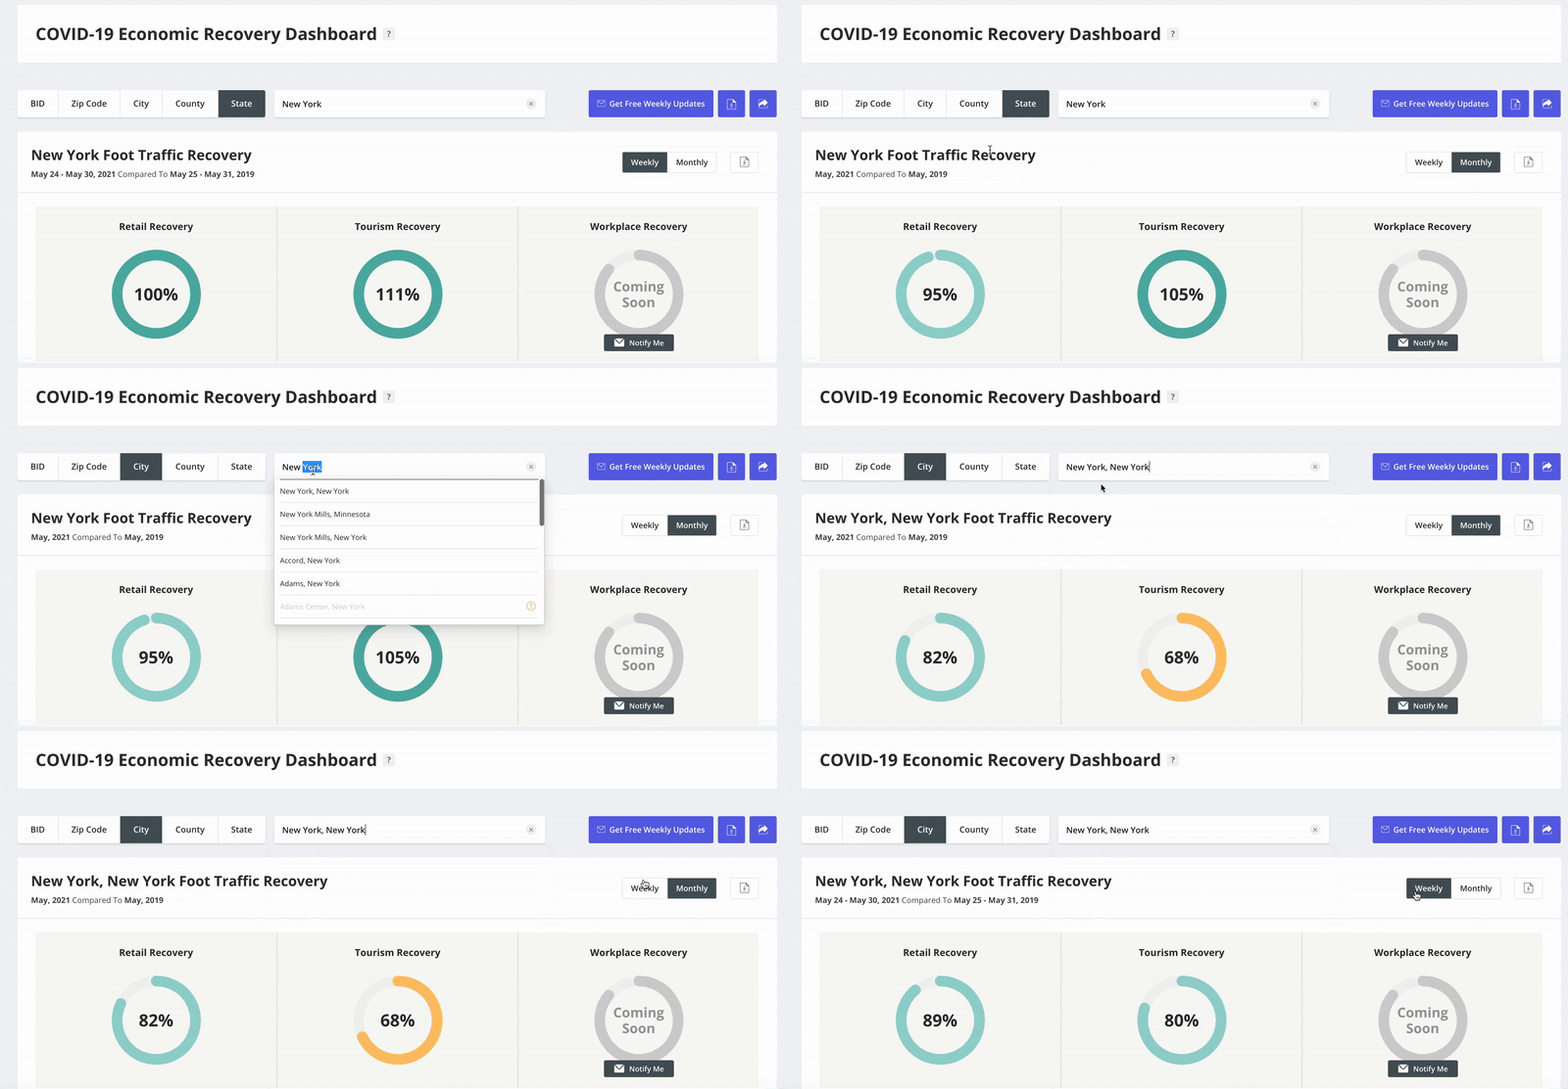
The COVID Recovery Dashboard is a free tool that empowers business and government leaders with data to measure impacts of COVID in every city, county, and state. The Dashboard shows weekly and monthly foot traffic data in key sectors and compares it to the equivalent week or month in 2019 to produce a recovery score. Use the recovery score to measure impacts, identify new opportunities and evaluate the performance of efforts and investments to support growth.
Included in the COVID Recovery Dashboard
Recovery Data
The first release of the Dashboard includes recovery data for the Retail and Tourism sectors, and we plan to add a Workplace Recovery segment in the coming weeks.

The Retail panel includes an overall retail recovery score as well as detailed recovery data for fourteen retail categories including:
The Tourism panel provides insights into which areas are starting to receive tourist visits again, and categorizes the data to reveal local visitors originating from between 50 and 150 miles away, and national visitors who travel to a destination over 150 miles.
Data for Every Location
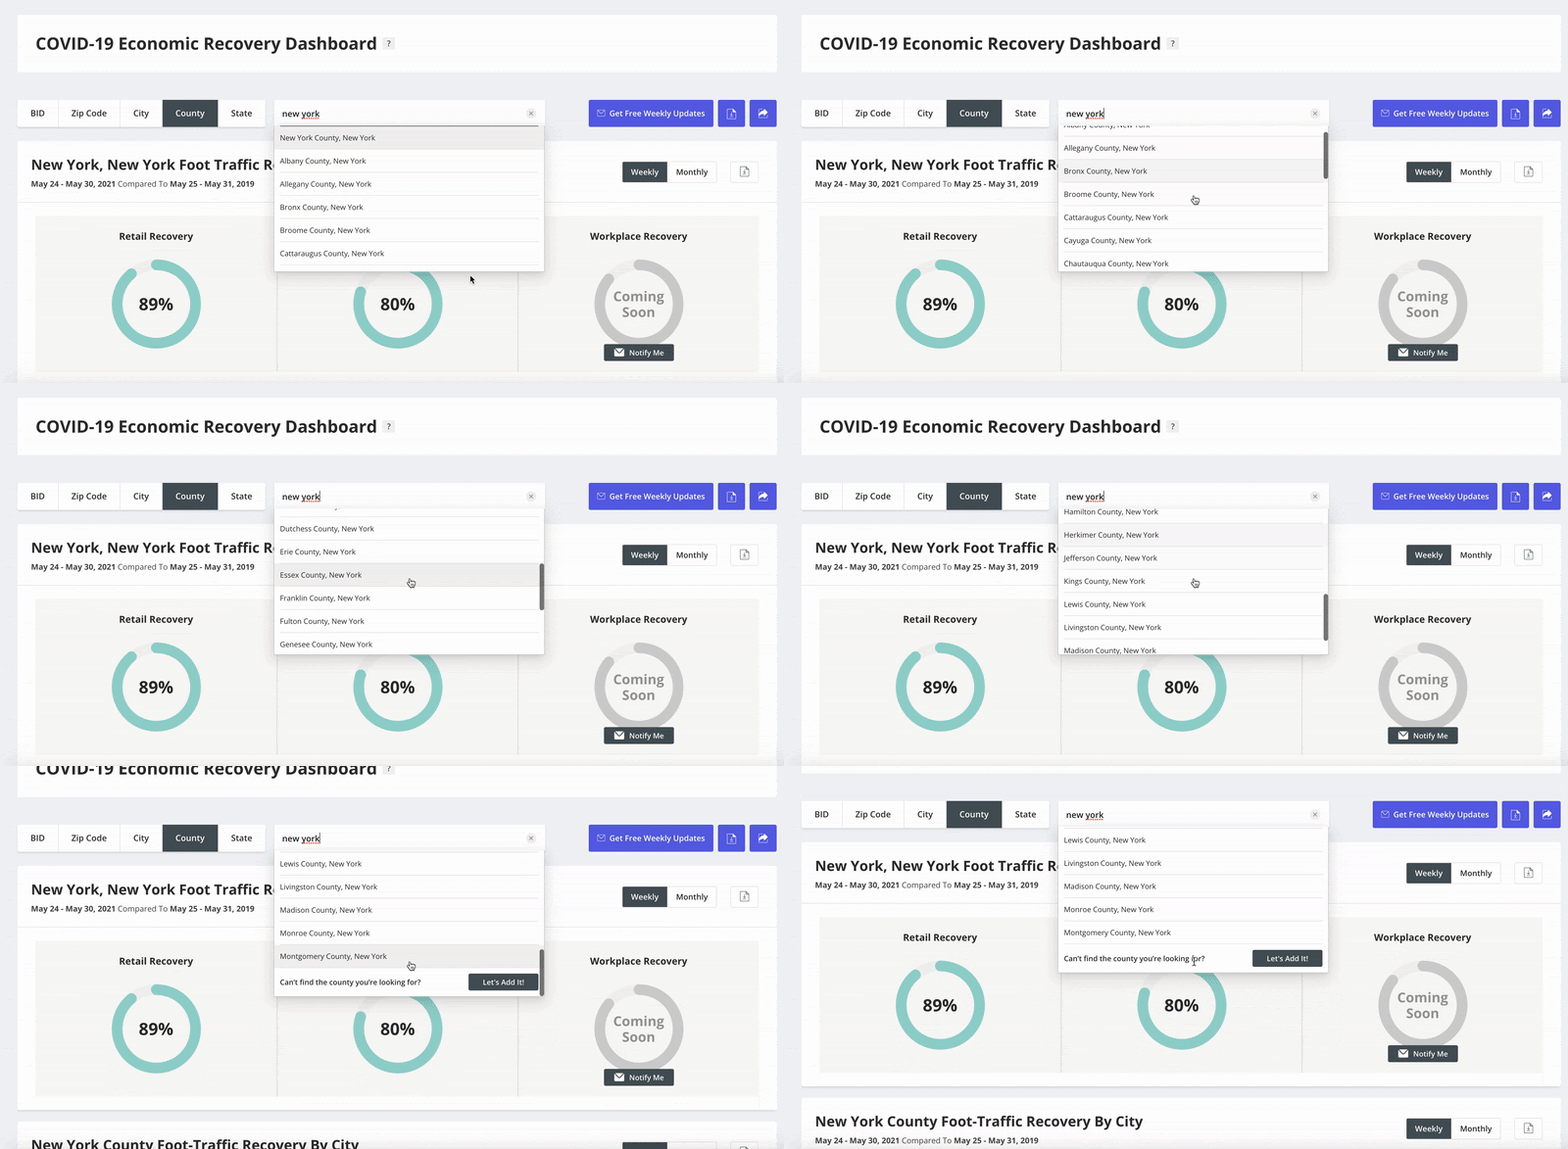
The Covid Recovery Dashboard allows users to zoom in or out of a region and see recovery data for every location. Data can be categorized to reveal foot traffic performance in each of the following place types:

* At the time of launch, we will have over 300 of the nation’s downtowns and business improvement districts mapped on the dashboard. If you don’t see the Downtown, BID, or other area you’re focused on, use the “Let’s Add It” button on the dashboard, and we’ll add it for you!
COMING SOON: Comparison Tool
Users will be able to compare recovery data for different locations across regions and subregions to learn where foot traffic is recovering more quickly, and where it continues to struggle. Comparing different regions will allow leaders to identify best practices and see where different efforts, initiatives, and investments are creating positive impacts.

Make the Most of the COVID Recovery Dashboard
Here are some of the ways government and business leaders are using COVID Recovery Data:
The pandemic challenged business, government, and economic development leaders to continue making positive impacts in a time of economic contraction. The COVID Recovery Dashboard provides these same leaders with data needed to make informed decisions, measure impact, and accelerate recovery.
We would love to hear your feedback on this tool. Let us know how you are using the data to support your recovery and growth efforts, and what additional data you need to be successful.
To learn more about the data behind this article and what Placer has to offer, visit https://www.placer.ai/.


Sign up to receive our stories in your inbox.
Data is changing the speed of business. Investors, Corporations, and Governments are buying new, differentiated data to gain visibility make better decisions. Don't fall behind. Let us help.


Sign up to receive our stories in your inbox.
Data is changing the speed of business. Investors, Corporations, and Governments are buying new, differentiated data to gain visibility make better decisions. Don't fall behind. Let us help.


