
Amid increased COVID cases, the rise of the Delta variant, and the return of in-person schooling, U.S. weekly hotel room demand dropped for a second consecutive week. The decrease in demand caused occupancy to fall to 68.0% for the week (1-7 August), the country’s lowest level of the past four weeks. The largest declines were seen in the south, where COVID-19 cases are surging and a high percentage of students have returned to the classroom. Louisiana and Florida saw the greatest occupancy declines, both falling more than 6 percentage points week over week. Mississippi and Wisconsin followed, with week-on-week occupancy decreases of 5 points each. In all, 32 states saw occupancy fall by a point or more this past week. Along with a slowdown in demand, occupancy was also impacted by an increase in supply, as 48,000 rooms reopened in the past week, with the largest number of reopenings in Orlando, New York City, and Boston. There are 68,000 rooms (1.2% of total supply) still closed in the U.S. due to the pandemic. On a total-room-inventory basis (TRI), which accounts for temporarily closed hotels, weekly occupancy was 65.5%.
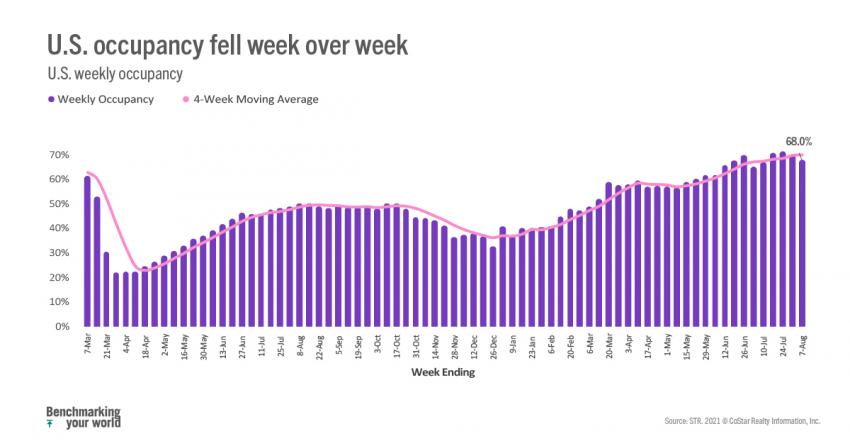
Room demand fell by more than 759,000 rooms in the week, the largest weekly decrease in five weeks, and just barely remained above 26 million. This was the second consecutive weekly decrease and the first back-to-back decline since the end of 2020, which is similar to what was seen in 2019. Additionally, demand was 93% of its 2019 level for the comparable week. The largest declines were noted in Chicago, Orlando, Atlanta, Los Angeles and Miami, which, combined, accounted for 20% of the U.S. demand decrease. In total, 124 of the 166 STR markets reported a decline in demand. On the positive side of the spectrum, Houston and Indianapolis led the markets that showed gains in the metric.
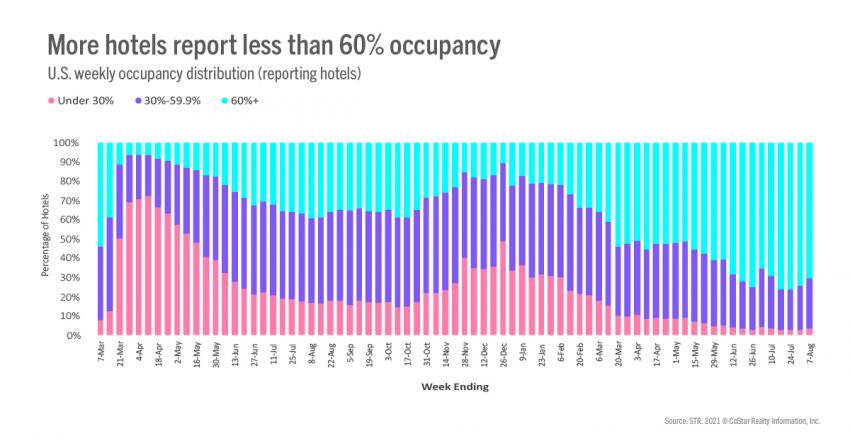
Even as demand fell, most hotels (71%) continued to report occupancy above 60%, but that composition is shifting. Two weeks ago, 20% of hotels had occupancy above 90%. This week, the percentage dropped to 15%. To put that number into context, at the beginning of July only 12% of hotels had occupancy at the 90% level. A bit worrisome, nearly 30% of all U.S. hotels reported occupancy under 60%, with 16% posting occupancy below 40%. TRI occupancy was lowest in New Orleans (46%) and highest in Portland, ME (88%). Among the Top 25 Markets, the highest TRI occupancy was in Norfolk/Virginia Beach (79%), with New Orleans reporting the lowest. New York and San Francisco were just above 50% for the week.
Weekly ADR slipped by its largest amount since mid-April, falling 1.4% week over week. The drop was seen on weekdays and weekends, with weekend ADR (-1.7%) falling slightly more than weekdays (-1.3%). The Top 25 Markets saw ADR drop by nearly 2% in the week, as weekday ADR declined a bit more than weekend. Outside the Top 25, the weekday/weekend decreases were nearly identical. Among markets with the highest weekly ADR, Maui continued to see growth (+2%) while the Florida Keys fell (-8%). Overall, 100 of the 166 STR markets reported a decline in weekly ADR.
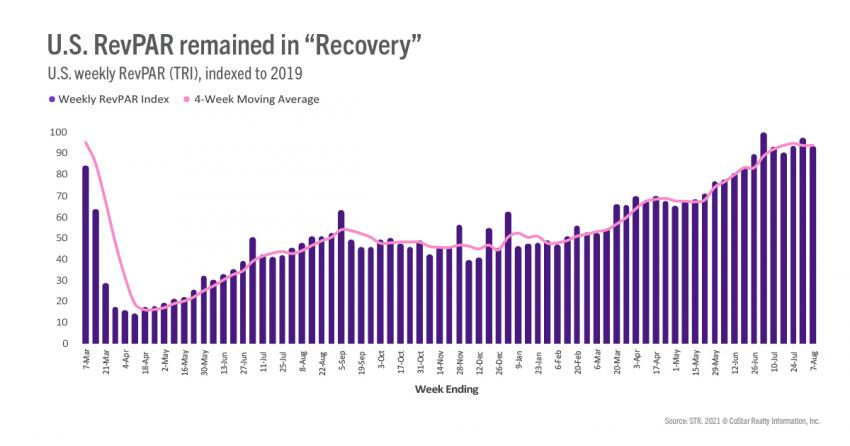
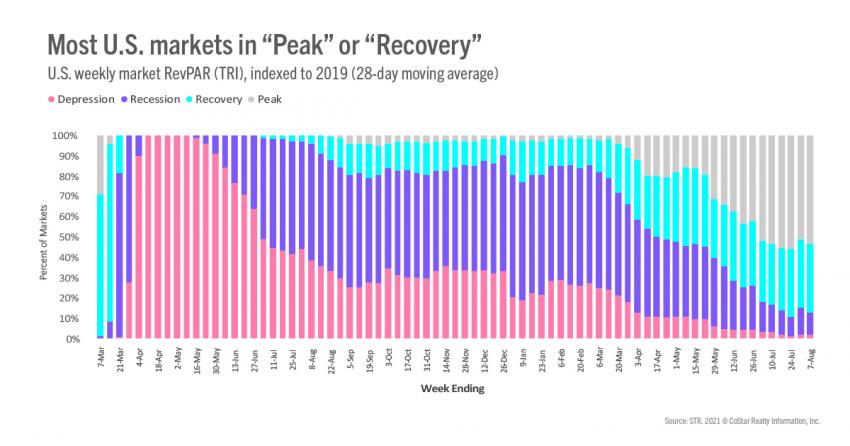
TRI revenue per available room (RevPAR) fell 4.7% week over week, the second consecutive weekly decline. Weekly TRI nominal RevPAR was 94% of what it was in 2019, down from 98% a week prior. On a 28-day moving total basis, TRI nominal RevPAR remained unchanged from last week’s 28-day total, as 54% of all markets remained in the “Peak” zone (TRI RevPAR indexed to 2019 greater than 100). Another 34% of markets were in “Recovery” (TRI RevPAR indexed to 2019 between 80 and 100). Eighteen markets were in “Recession” (TRI RevPAR indexed to 2019 between 50 and 80), while three (San Francisco, San Jose, and New York City) were in “Depression” (TRI RevPAR indexed to 2019 less than 50).
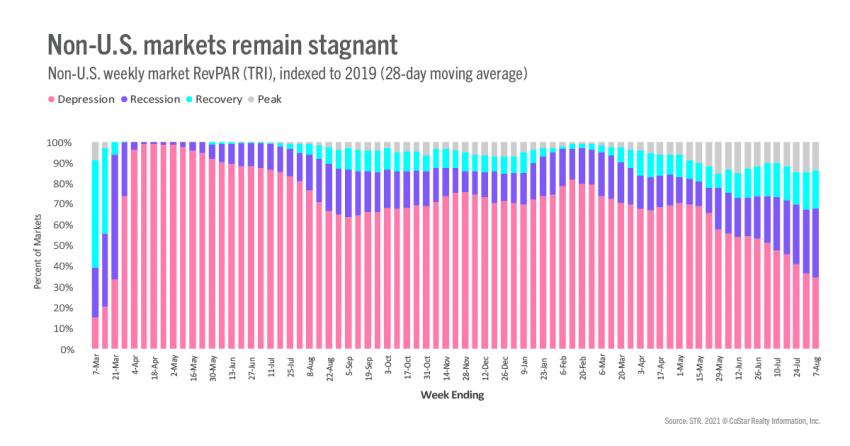
Outside of the U.S.
Global TRI occupancy, excluding the U.S., dropped to 38%, a 6-point decline week over week, which was the largest of the year. The decrease was led by China, where TRI occupancy fell to 33% from 54% a week prior. Among other key countries, U.K. occupancy remained above 64%, flat against the previous week. Canada continued to see improvement and reached its highest weekly occupancy level (57%) since the start of the pandemic. On a 28-day moving average total, 68% of non-U.S. markets remain in “Depression” and/or “Recession,” a slight increase from the previous week.
Big picture
In some respects, seasonality has returned to the industry with the reopening of schools, particularly in the U.S. south, but the increase in the Delta variant is also likely impacting demand. However, the demand pattern seen over the past three weeks is similar to what was seen in 2019, with declines in line with what was reported at that time. However, unlike in 2019, we expect further performance deterioration in the weeks ahead as business/group demand will not pick up the slack of waning leisure demand as it did in 2019.
To learn more about the data behind this article and what STR has to offer, visit https://str.com/.


Sign up to receive our stories in your inbox.
Data is changing the speed of business. Investors, Corporations, and Governments are buying new, differentiated data to gain visibility make better decisions. Don't fall behind. Let us help.


Sign up to receive our stories in your inbox.
Data is changing the speed of business. Investors, Corporations, and Governments are buying new, differentiated data to gain visibility make better decisions. Don't fall behind. Let us help.