Week ending 28 August
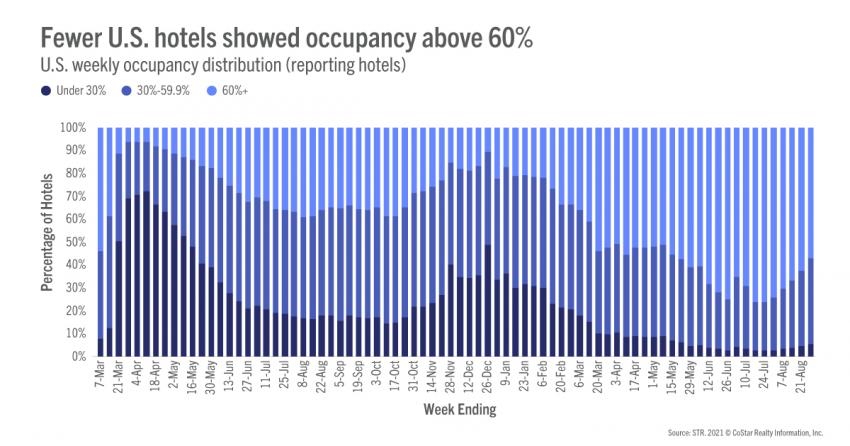
Occupancy fell by more than two percentage points to 61.0% for the week ending 28 August 2021. This was the fifth consecutive week with lower occupancy and the fourth straight week with an occupancy decline of more than two percentage points. More than 77% of all STR-defined markets in the U.S. reported lower weekly occupancy, and U.S. occupancy is now at its lowest level since mid-May as just 57% of hotels saw weekly occupancy above 60%—the lowest percentage in 14 weeks. Weekday and weekend occupancy have each been trending down for the past five weeks. On a total-room-inventory basis (TRI), which accounts for temporarily closed hotels, weekly occupancy was 58.8%. In the U.S., there are still 49,000 rooms closed, 40% of which are in New York and Orlando.
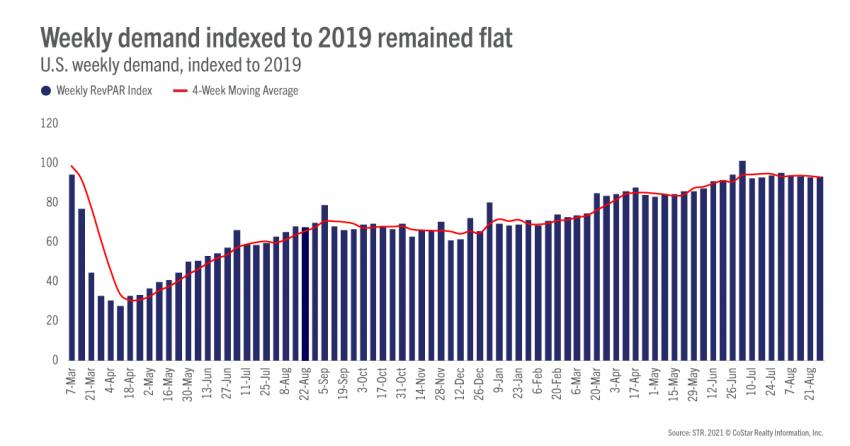
At 23.6 million, weekly room demand was the country’s lowest since early June and 93% of what it was in the comparable week of 2019. At the same time, the demand index to 2019 increased 0.8 points week on week because of the shift in the Labor Day holiday, which began at the end of the corresponding week in 2019. Daily demand indices showed a general rise across all days, particularly mid-week, as 2019 business/group travel slowed ahead of the holiday. For the past 12 weeks, room demand has been 90% or more of the comparable 2019 level. However, we expect it to soften further as leisure travel pauses given the resumption of in-person schools, increased anxiety from the delta variant surge, and limited business travel.
Taking a closer look, room demand fell the most in Florida with Orlando and Miami accounting for more than half of the state’s loss. Among other states, Louisiana’s room demand rose slightly over the weekend ahead of Hurricane Ida. Texas, Alabama, and Georgia also saw growth over the weekend. STR will produce more thorough analysis on the Ida impact on performance and closures in future weeks. Overall, only six states saw demand grow week over week, led by Massachusetts. And while there is noise due to the Labor Day holiday shift, it is worth noting that 14 states still reported weekly demand greater than what it was in 2019, down from 18 in the previous week.
Absolute average daily rate (ADR) was $132, a 10-week low and down 3% week on week, which was the largest weekly decrease since mid-April. Overall, ADR has come in lower for four straight weeks, and when indexed to 2019, the metric was down two points to 103 (meaning ADR was 3% higher than what it was in the comparable week of 2019). The decrease in the index was the steepest of the past two weeks. Despite the fall in the index, more than 130 markets (78%) continued to report ADR that was higher than 2019 on a nominal basis. The number of markets observing higher nominal ADR than in 2019 has shown little change over the past five weeks. Eighty-eight markets reported real ADR (adjusted for inflation) higher than what it was in 2019, down from 103 a week ago. Overall, U.S. weekly real ADR was at 98, down two points from the previous week.
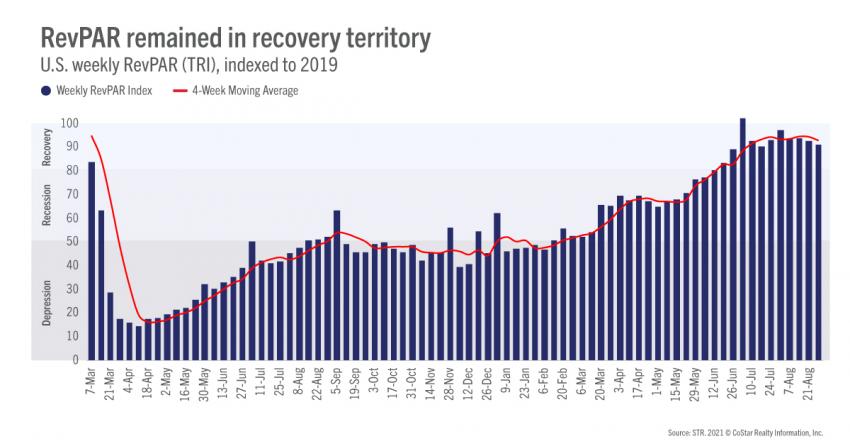
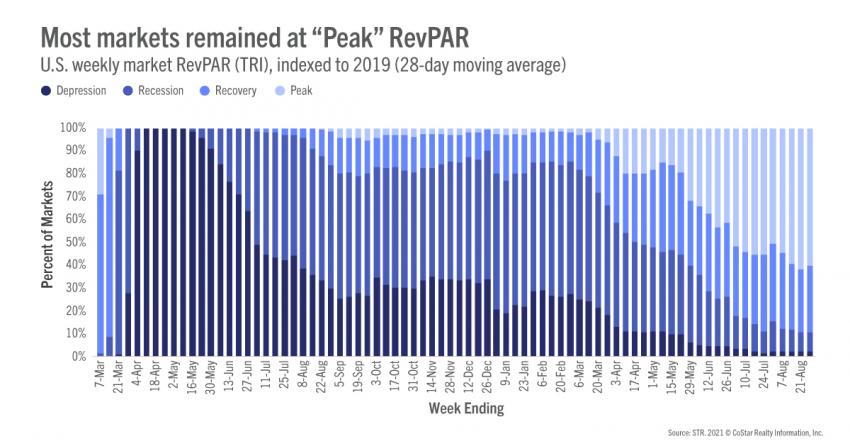
Revenue per available room (RevPAR) on a TRI basis declined 7.2% week on week to $78, which was the largest decrease in 19 weeks and the lowest absolute TRI RevPAR in 12 weeks. Indexed to 2019, nominal TRI RevPAR was 92, down 1.3 points week on week and the second consecutive weekly decrease. Real TRI RevPAR indexed at 87. On a 28-day moving total basis, TRI RevPAR indexed to 2019 dropped to 88 after coming in at 90 a week ago but remained in STR’s “Recovery” category as it was above 80. On a market-level, 100 markets had nominal TRI RevPAR at “Peak,” meaning it was above the level seen in the comparable 2019 week. A week ago, 103 were at “Peak,” which was the most so far. Seventeen markets remained in either “Depression” (TRI RevPAR indexed to 2019 under 50) or “Recession” (TRI RevPAR Indexed to 2019 between 50 and 80). The remaining markets (49) were in “Recovery.”
Outside the U.S.
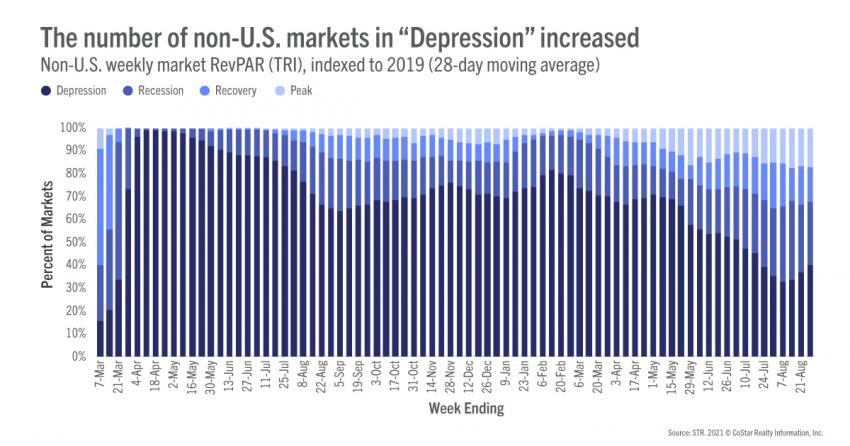
Weekly TRI occupancy showed little change and remained at 39% for a fourth consecutive week. Non-U.S. demand was 58% of what it was in 2019, up slightly week on week. TRI occupancy in China remained depressed for a fourth week but rose to 35% from 31% the week prior. U.K. TRI occupancy remained stable at 67%, while Canada saw a slight dip with weekly TRI occupancy remaining above 62%. Non-U.S. TRI RevPAR on a 28-day moving basis remained in STR’s “Recession” category. The index was also at its lowest level of the past five weeks. On a market-level, 40% of non-U.S. markets were in “Depression,” the most of the past six weeks with another 28% in “Recession.” The remaining non-U.S. markets (32%) were either in “Recovery” or “Peak.”
Big picture
This week’s performance reflected seasonal trends as well as the continued impact of the pandemic on business travel. Next week’s data is expected to see wider market-level variations due to this year’s Labor Day holiday along with the impacts of Hurricane Ida from Louisiana to the Northeast. While all key KPIs are falling, we don’t expect a fall to the levels seen earlier this year. TSA screenings, while down from their leisure highs, continue to be better than 70% of the levels they were in 2019. Of course, only time will tell.
To learn more about the data behind this article and what STR has to offer, visit https://str.com/.


Sign up to receive our stories in your inbox.
Data is changing the speed of business. Investors, Corporations, and Governments are buying new, differentiated data to gain visibility make better decisions. Don't fall behind. Let us help.


Sign up to receive our stories in your inbox.
Data is changing the speed of business. Investors, Corporations, and Governments are buying new, differentiated data to gain visibility make better decisions. Don't fall behind. Let us help.