

In July, Instacart led in grocery store deliveries with 63% market share, ahead of Amazon (25%), Shipt (6%), online-only grocers (4%) and other third-party delivery services (3%).
Key Takeaways
• Third-party delivery services (e.g. DoorDash, Uber Eats, and others) have seen the greatest combined growth (225%) in consumer spend on online grocery transactions in the last year. Instacart saw 6% growth.
• During the four weeks starting on June 21, 2021, customers spent 87% more on online restaurant purchases than they did on online grocery purchases.
The rise of online grocery delivery—alongside record growth of the restaurant and convenience store delivery sectors—continues to be an area of interest for many businesses this year. Uber Eats recently announced a grocery delivery partnership with Albertsons while DoorDash also expanded in recent months, partnering with convenience stores and grocery retailers to provide delivery on top of their already existing DashPass service.
Instacart also took steps to build and operate fulfillment centers for supermarkets to improve efficiencies further cement their place in grocery delivery, while traditional gocery retailers like Aldi, Kroger, and Walmart have added both delivery and curbside pickup options for their customers. As competition heats up in the digital ordering arena for grocery delivery, Edison Trends analyzed more than 10 million transactions to understand which brands are taking a lead.
How did overall online spend change across grocery, restaurant, and convenience store sectors in the last year?
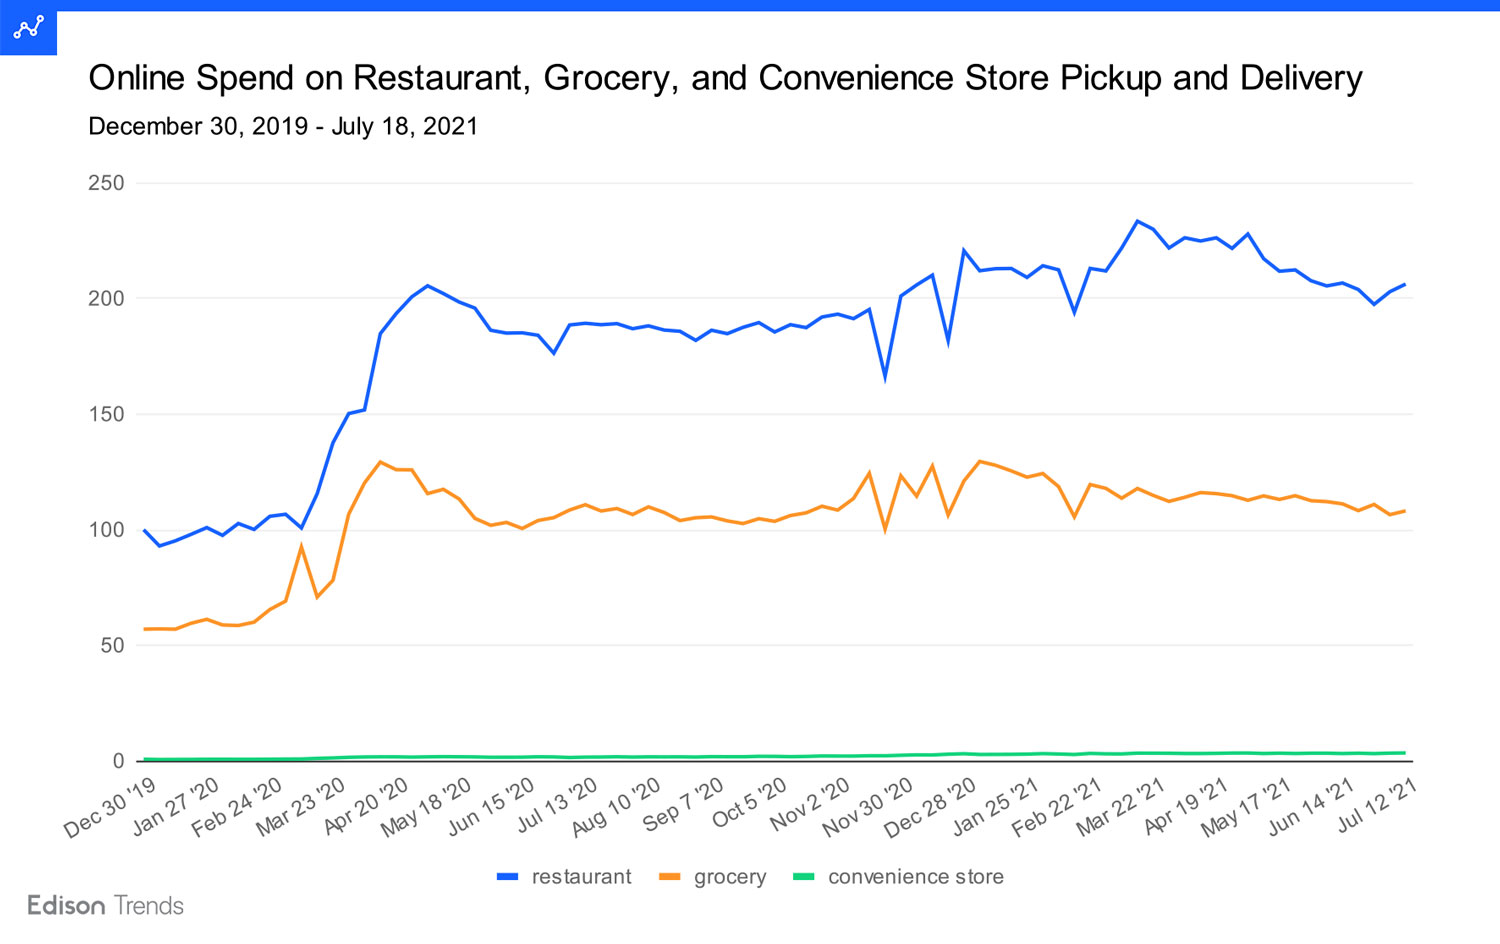
Figure 1a: Chart shows estimated online spend on restaurant, grocery, and convenience store pickup and delivery from December 30, 2019 - July 18, 2021, according to Edison Trends. Note: The highest spend for the first week was set to 100, and all other values scaled accordingly. This analysis was based on over 10 million transactions. “Restaurant” includes 21 third-party services, 39 ordering platforms, and 76 restaurant websites. “Grocery” includes 48 grocery stores and ordering services, as well as Walmart and Target. It does not include pickup orders direct from Target, but does include Shipt. “Convenience store” includes orders from over 60 convenience store and pharmacy stores through 11 third-party services and Instacart, as well as direct from goPuff, Casey’s, and 7-Eleven.
This chart shows spend on restaurant, grocery, and convenience store transactions. Restaurants win, and by a larger margin of spending now than a year ago. Here, restaurant spending in the first week was set to 100, and the remaining values for all segments were scaled accordingly, allowing us to see the true relationships between each segment.
The size of the gap between restaurant and grocery spending continues to change. During the four weeks starting on June 21, 2021, customers spent 87% more on online restaurant purchases than they did on online grocery purchases. In the four-week period starting June 22, 2020, they had spent 72% more on restaurants.
The point at which grocery and restaurant spending most closely approached each other was the week of March 9, 2020, in which customers spent only 9% more on online restaurant purchases than on online grocery purchases. This was the week in which Walmart grocery pickup took off during the start of social distancing.
Online spend on convenience stores, while very small compared to that on restaurant and grocery venues, continues to grow.
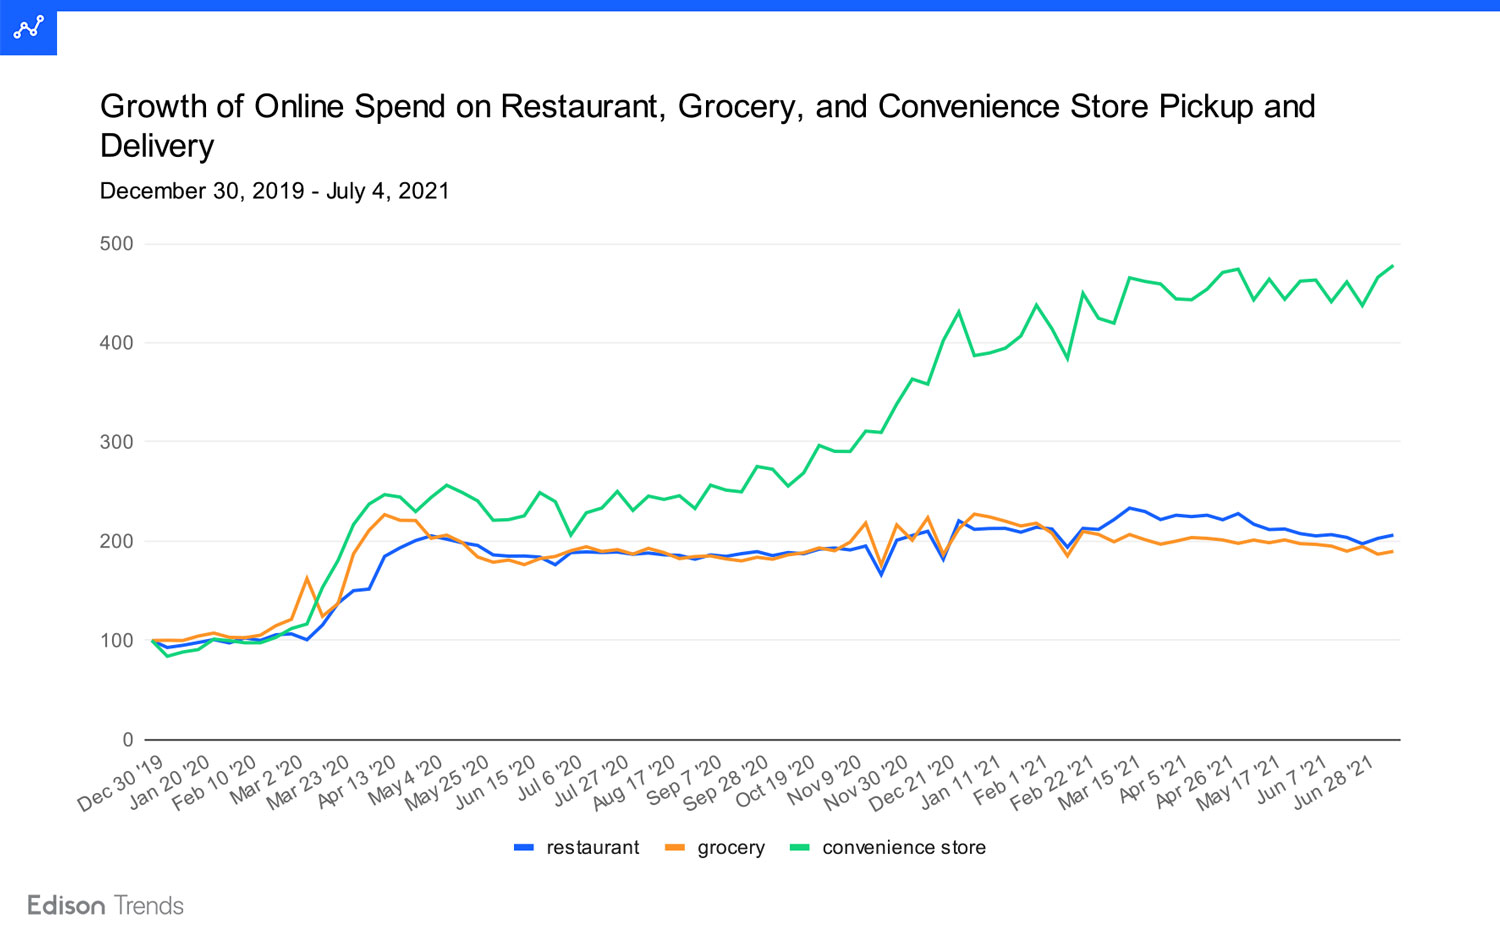
Figure 1b: Chart shows estimated growth of online spend on restaurant, grocery, and convenience store pickup and delivery from December 30, 2019 - July 4, 2021, according to Edison Trends. Note: for each category, the highest spend for the first week was set to 100, and all other values in that category scaled accordingly. This analysis was based on over 10 million transactions. “Restaurant” includes 21 third-party services, 39 ordering platforms, and 76 restaurant websites. “Grocery” includes 48 grocery stores and ordering services, as well as Walmart and Target. It does not include pickup orders direct from Target, but does include Shipt. “Convenience store” includes orders from over 60 convenience store and pharmacy stores through 11 third-party services and Instacart, as well as direct from goPuff, Casey’s, and 7-Eleven.
This chart examines the growth of each segment of food pickup and delivery. Comparing spend for the week of July 12, 2021 to that of the equivalent week the year before, restaurant spend has grown 9% and convenience store spend 109%, while grocery has fallen 2%.
Which on-demand delivery platform has the highest market share of Online Grocery transactions across the USA?
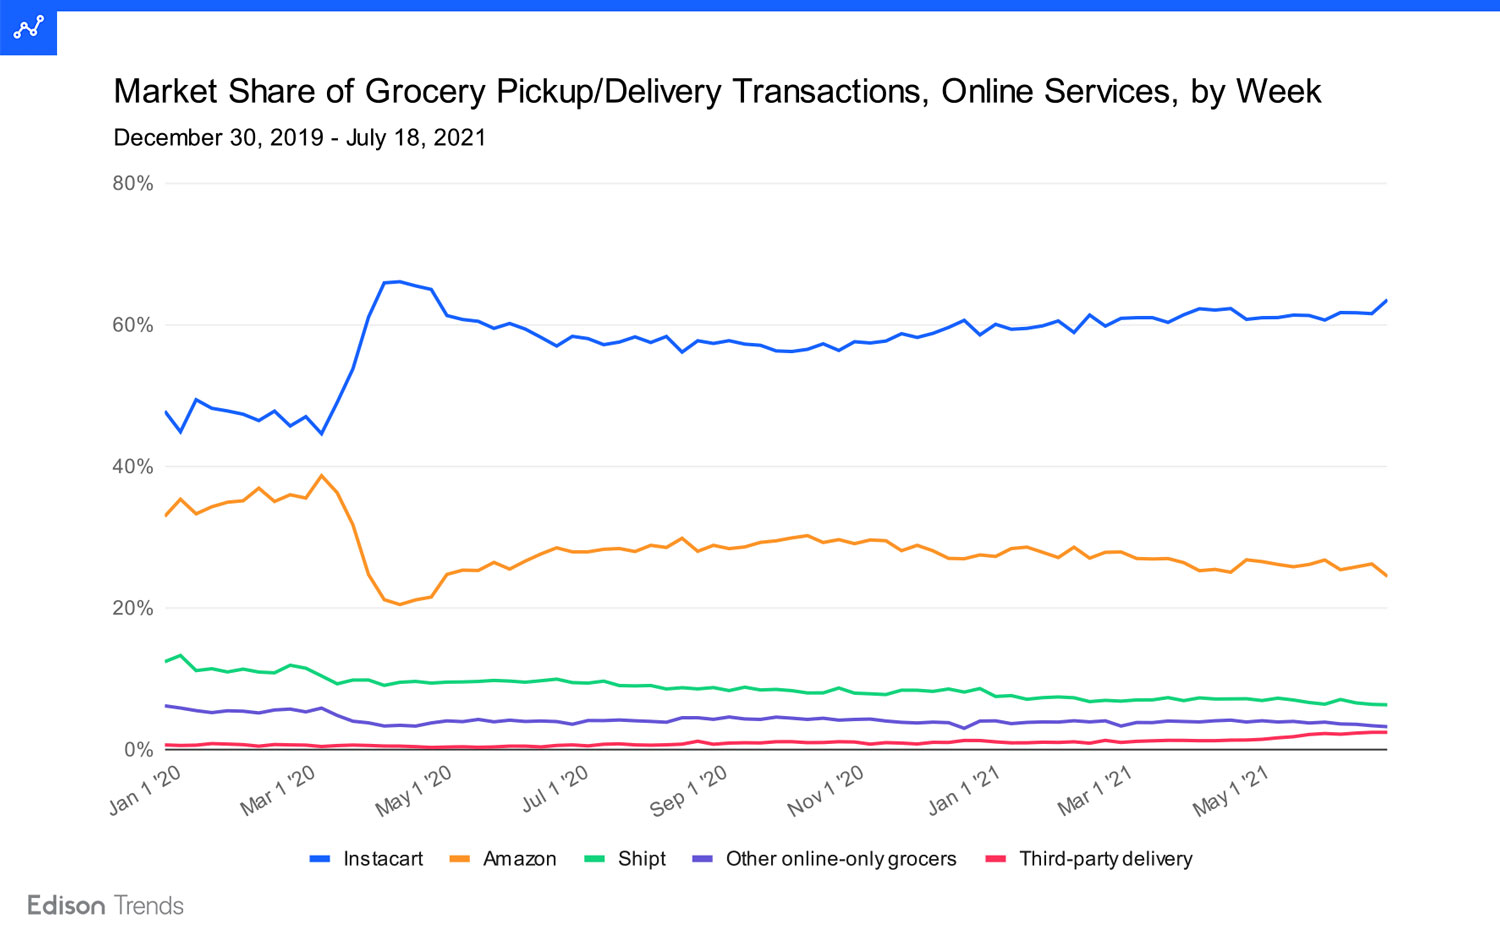
Figure 2a: Chart shows estimated market share of grocery pickup/delivery transactions for online services by week from December 30, 2019 - July 18, 2021, according to Edison Trends. This analysis is based on over 700,000 transactions. “Other online-only grocers” includes Thrive Market, Fresh Direct, My Web Grocer, Green Bean Delivery, and Mercato. “Third-party delivery” includes grocery orders through Bite Squad, Delivery.com, Grubhub, NeighborFavor, Postmates, and Seamless. Only orders from grocery stores are included for Instacart. Note: due to rounding, numbers may not add to 100%.
Among online grocery pickup and delivery services, Instacart currently has the largest slice of the pie, taking in 63% of such transactions in the week of June 12, 2021. Amazon (including Whole Foods, Amazon Fresh, and Prime Now) took 25%. Shipt was third with 6%. Other online-only grocery services had 4%, while third-party delivery services had 3%.
The effects of COVID-19 can be seen clearly in Spring of 2020. Nearly all services grew their number of transactions from February through May 2020 — this includes Amazon. However, Instacart’s rise was steep enough that they managed to take market share away from their competitors.
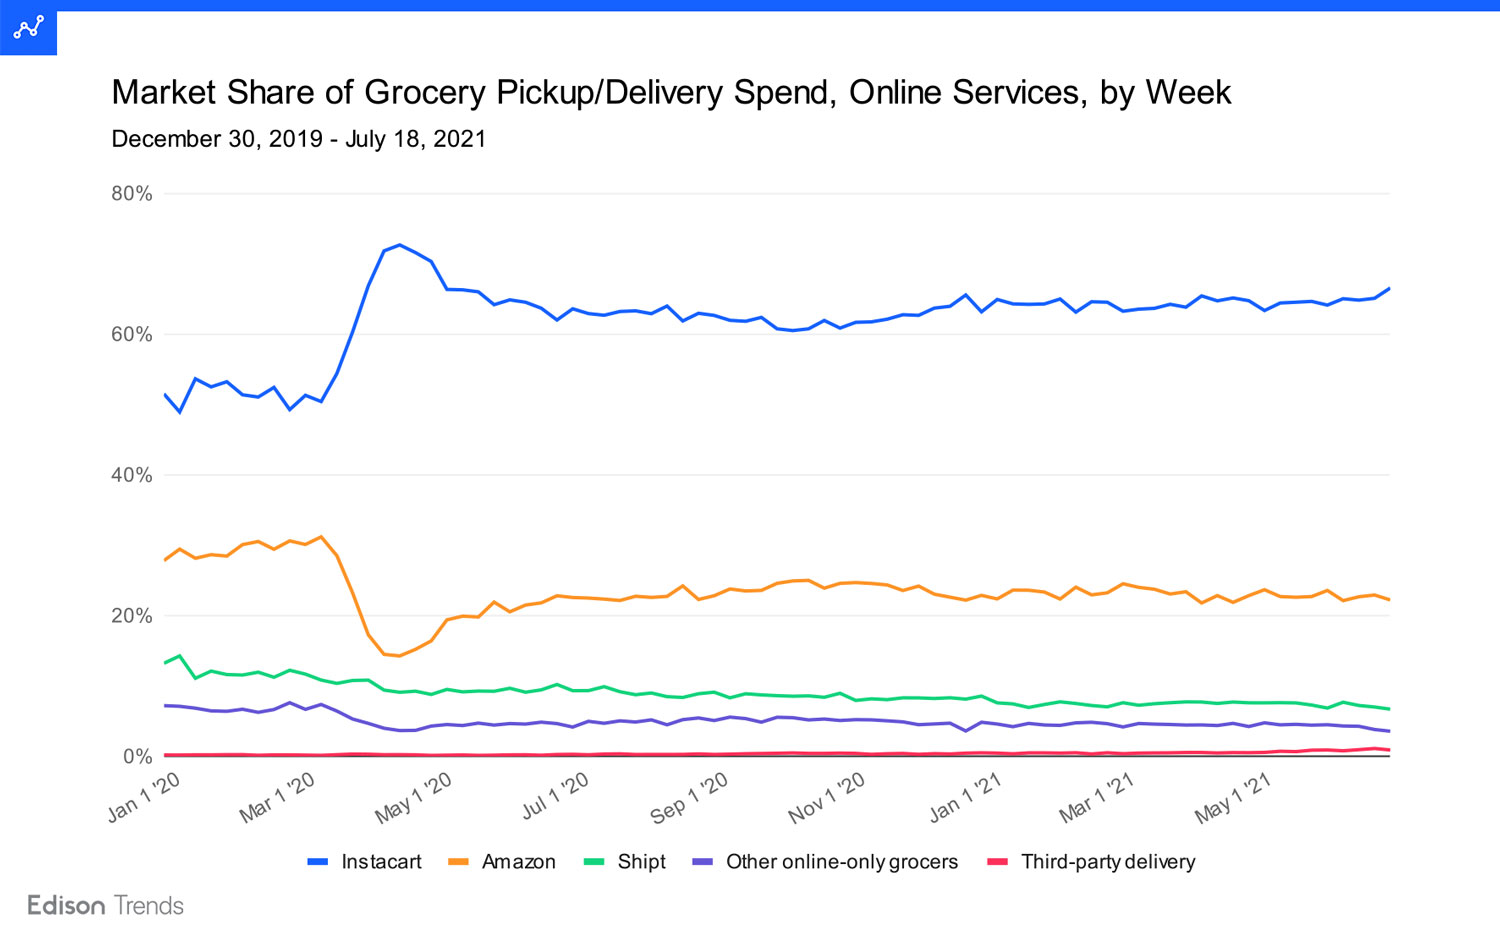
Figure 2b: Chart shows estimated market share of grocery pickup/delivery spend for online services by week from December 30, 2019 - July 18, 2021, according to Edison Trends. This analysis is based on over 700,000 transactions. “Other online-only grocers” includes Thrive Market, Fresh Direct, My Web Grocer, Green Bean Delivery, and Mercato. “Third-party delivery” includes grocery orders through Bite Squad, Delivery.com, Grubhub, NeighborFavor, Postmates, and Seamless. Only orders from grocery stores are included for Instacart. Note: due to rounding, numbers may not add to 100%.
Among online grocery pickup and delivery services, Instacart currently has the largest share of spend, taking in 66% of what customers spent on such transactions during the week of July 12, 2021. Amazon (including Whole Foods, Amazon Fresh, and Prime Now) took 22%. Shipt was third with 7%. Other online-only grocery services had 4%, while third-party delivery grocery transactions (such as from DoorDash or Postmates) came in at 1%.
The effects of COVID-19 can be seen clearly in Spring of 2020. Pure customer spending increased for nearly all services from February through May 2020, including for Amazon. Again, Instacart’s rise was steep enough that they managed to take market share away from even rapidly-growing competitors during this time.
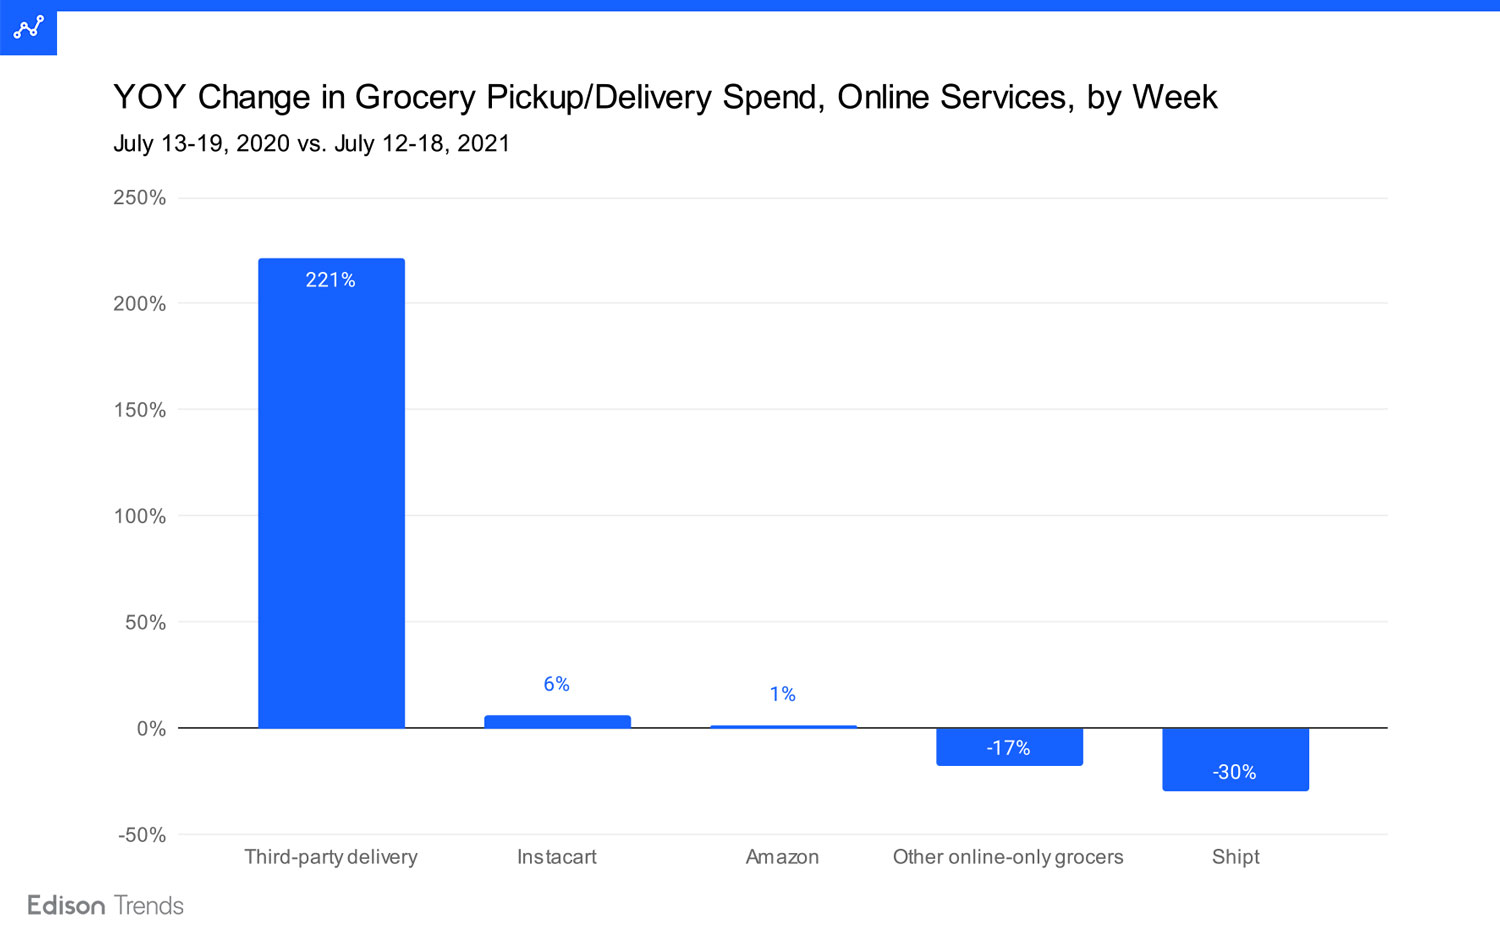
Figure 2c: Chart shows estimated year-over-year change in grocery pickup/delivery spend for online services by week, comparing July 13 - 29, 2020 vs. July 12 - 18, 2021, according to Edison Trends. This analysis is based on over 19,000 transactions. “Other online-only grocers” includes Thrive Market, Fresh Direct, My Web Grocer, Green Bean Delivery, and Mercato. “Third-party delivery” includes grocery orders through DoorDash, Bite Squad, Delivery.com, Grubhub, NeighborFavor, Postmates, and Seamless. Only orders from grocery stores are included for Instacart.
Third-party delivery services as a whole have seen the greatest uptick in what customers spent on grocery transactions over the last year, growing spend an impressive 225%. Instacart saw ~6% growth and Amazon (including Whole Foods, Amazon Fresh, and Prime Now) remained about the same. Some services saw a decline.
To learn more about the data behind this article and what Edison Trends has to offer, visit https://trends.edison.tech/.


Sign up to receive our stories in your inbox.
Data is changing the speed of business. Investors, Corporations, and Governments are buying new, differentiated data to gain visibility make better decisions. Don't fall behind. Let us help.


Sign up to receive our stories in your inbox.
Data is changing the speed of business. Investors, Corporations, and Governments are buying new, differentiated data to gain visibility make better decisions. Don't fall behind. Let us help.