

Understanding food delivery growth across the US, UK, Canada and Australia.
Key Takeaways
• The US, UK, Canada and Australia showed generally increasing food delivery spend and transactions throughout the last three years.
• The timing and severity of drops due to COVID-19 were varied.
• All countries studied saw renewed growth after the initial COVID-19 related drop.
• YOY growth ranged from 30% (Australia) to 171% (UK).
The food delivery industry hasn’t stopped evolving since its birth. 2020 was a big year for change, with unprecedented changes introduced across the food delivery market. This year promises more of the same, as many wonder whether a post-COVID drop may be in store for the industry. To understand how the pandemic has impacted the food delivery market, as well as see consumer spending habits are shaping up in 2021, Edison Trends examined over 3.3 million de-identified food delivery transactions worldwide.
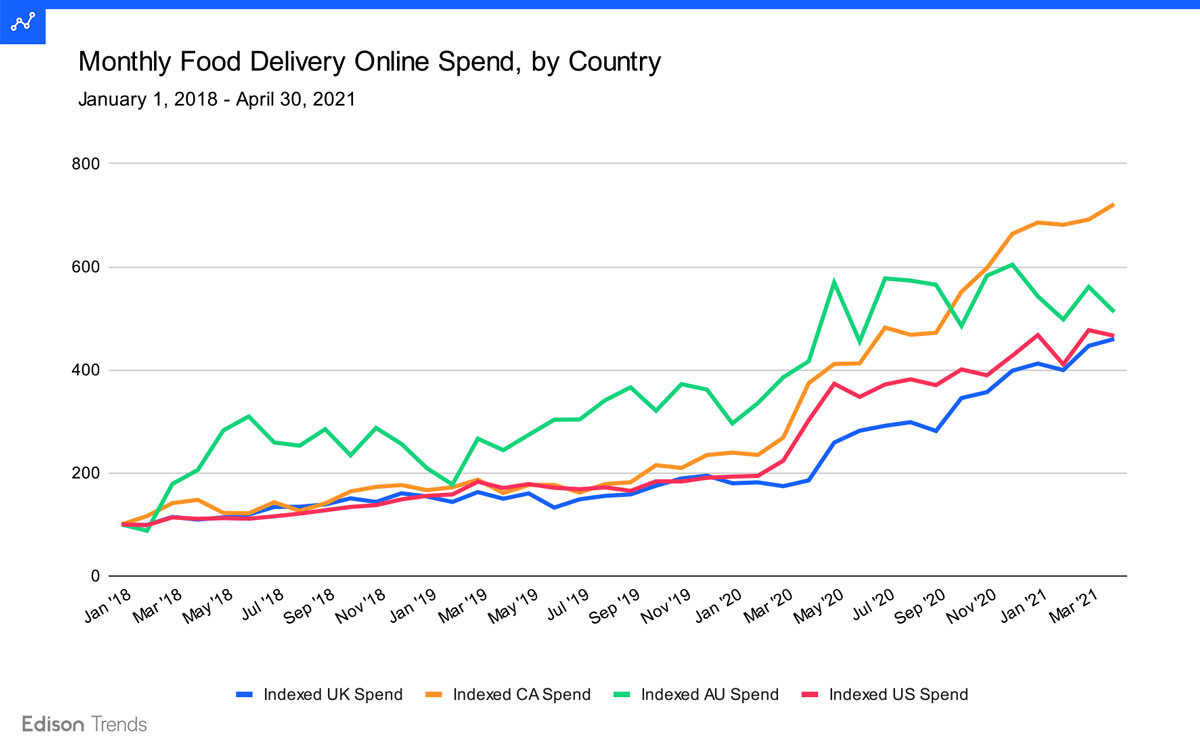
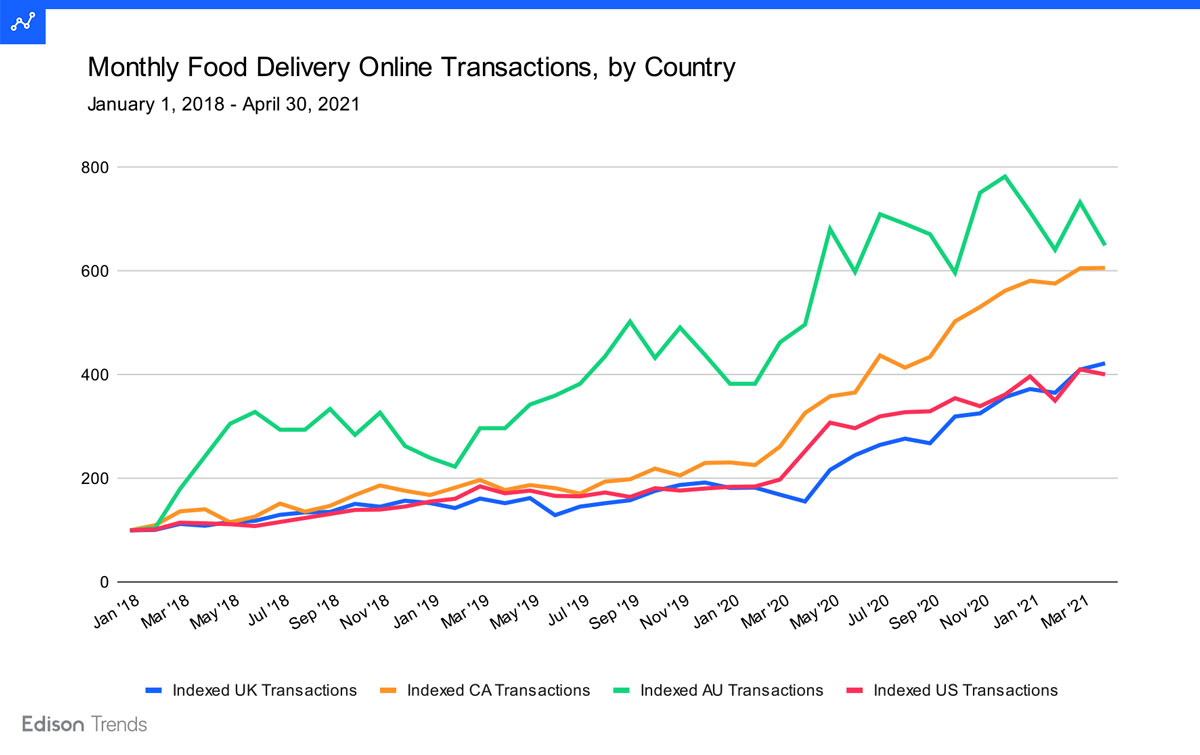
Figures 1a and 1b: Charts show estimated overall food delivery online spend and transactions in the United States, United Kingdom, Canada, and Australia from January 1, 2018 - April 30, 2021, according to Edison Trends. Note: This analysis is based on over 3.3 million pickup and delivery transactions, including over 12,000 from Australia, over 60,000 from Canada and over 200,000 from the UK. Transactions come from DoorDash (including Caviar), Grubhub (including Seamless, Eat24, and Tapingo), Uber Eats, OrderUp, Foodler, Amazon Restaurants, Delivery.com, Delivery Dudes, Ritual, Bite Squad, Yelp, and Fooda.
While the US, UK, Canada and Australia showed generally increasing transaction numbers throughout the last three years, the timing and severity of drops due to COVID-19 was varied.
All four countries had a rising trend throughout 2018 and 2019, with notable dips in late 2018 for Australia and spring 2019 for the UK. This trend continued in 2020, with a flattening in the early part of the year for most nations.
In the US, growth was slow from January into February 2020 and February into March. Transactions increased into April and May 2020 before growth slowed down again. April saw a 28% month-over-month rise; for May, the figure was 22%.
In the UK, transactions fell in March and again in April 2020, before jumping up 39% in May. There was another dip in September, and then a 19% rise going into October.
Canada’s numbers fell slightly in February 2020 and then began to rise again, with a big lift of 25% in April (over the previous month). Another dip occurred in June before numbers began to rise again.
Similarly, in Australia, a slight drop in February 2020 was followed by strong growth in March, April, and May, with the average monthly increase during these three months being 22%.
Growth during the pandemic has been remarkable. For a comparison: US transactions grew 85% between January 2018 and February 2020. Between February and December 2020, a period about 2/5ths the length, the increase was 96%—that is, the number of transactions per month almost doubled.
Looking at YOY numbers for April 2021 (vs. the previous April), US transactions were up 58%. UK transactions increased 171%, while Australia grew 30% and Canada 86%.
To learn more about the data behind this article and what Edison Trends has to offer, visit https://trends.edison.tech/.


Sign up to receive our stories in your inbox.
Data is changing the speed of business. Investors, Corporations, and Governments are buying new, differentiated data to gain visibility make better decisions. Don't fall behind. Let us help.


Sign up to receive our stories in your inbox.
Data is changing the speed of business. Investors, Corporations, and Governments are buying new, differentiated data to gain visibility make better decisions. Don't fall behind. Let us help.