At the very start of the global pandemic airlines had to make rapid – and major – adjustments to their flight schedules as demand fell away and travel restrictions prevented flying. Throughout the past 18 months airlines have remained ‘light on their feet’, continually adjusting their schedules to optimise networks and capacity to meet travel demand as and when it occurs. The notion of planning an airline schedule for the next 6 months still seems like a distant memory but schedule volatility is improving. It still has some way to go before it achieves the stability that was once familiar, but the trend is in the right direction.
Measuring Volatility
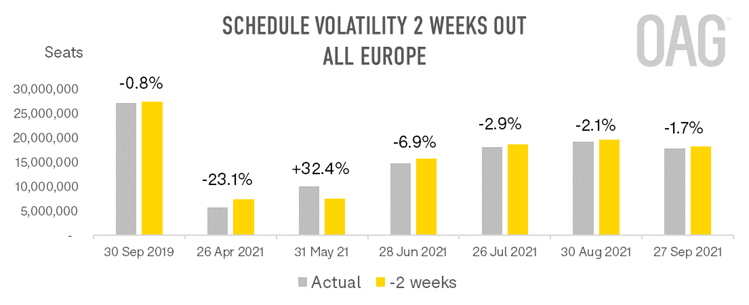
One way to measure volatility is to compare the volume of airline capacity in the schedule two weeks in advance of flights being scheduled to depart and comparing this with the airline capacity at the start of the actual week when flights are scheduled. The volatility is the change that takes place in those two weeks and can be observed as an increase in scheduled airline capacity or a decrease.
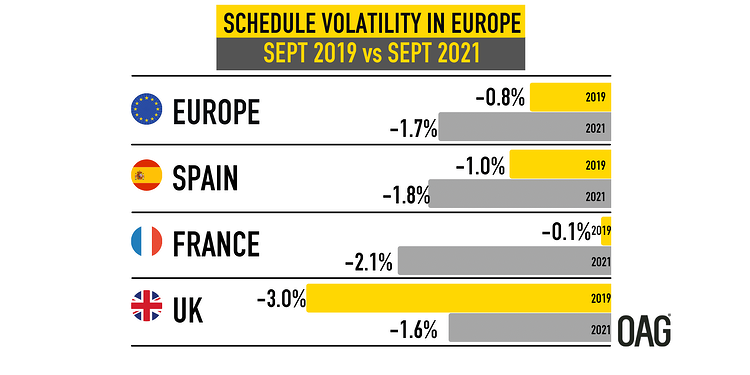
Two years ago, for the week commencing 30th September 2019, the change in airline capacity from all European airports over those two weeks was just 0.8%, a slight decrease in capacity as the actual week for flight departures approached. Today the figure is 1.7%, and also a decrease in capacity. That is more than twice the volatility that was observed pre-pandemic.
However, over the past 6 months there has been a steady improvement. At the end of April, the airline schedule had 23% less capacity than two weeks earlier, and then, at the end of May, it had 32% more capacity than two weeks earlier. Airlines were clearly still challenged to predict what they would need to fly only weeks before a flight was scheduled and needed to make last-minute changes in response to new travel restrictions or new announcements about the lifting of restrictions. The effect was a huge amount of schedule volatility.
By June, as air travel volumes started to pick up, this figure came down to 6.9%, followed by 2.9% in July. In August the volatility fell further, to 2.1%, and has reached 1.7% today.
A similar pattern is observed across the major outbound and inbound markets in Europe.

Spain and France
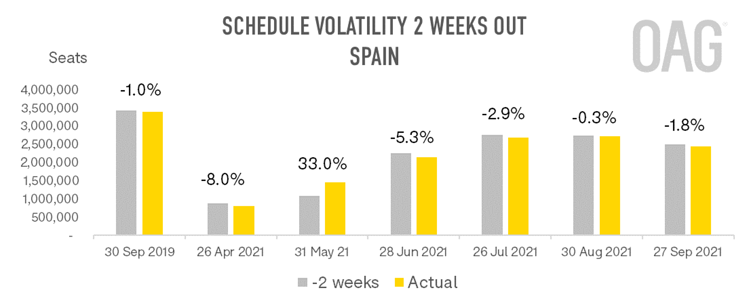
Spain is Europe’s largest aviation market and while scheduled capacity is still some 27% below this point in 2019, it picked up significantly this summer. Schedule volatility over the past 2 weeks is 1.8%, compared to 1.0% pre-pandemic, but has shown steady improvement over the summer, aided by a more consistent approach to international travel rules.
Two years ago, airline schedule volatility in the weeks preceding a flight was negligible, at 0.1%. Today it is 2.1%, significantly higher. The pattern of improvement in France has been less consistent than for Spain but volatility today is much improved from April and May this year when around a quarter of the flight schedule was being added or removed in the weeks before flying. The slight increase in schedule changes currently may point to over-optimism about traffic volumes at the end of the main summer period.

United Kingdom
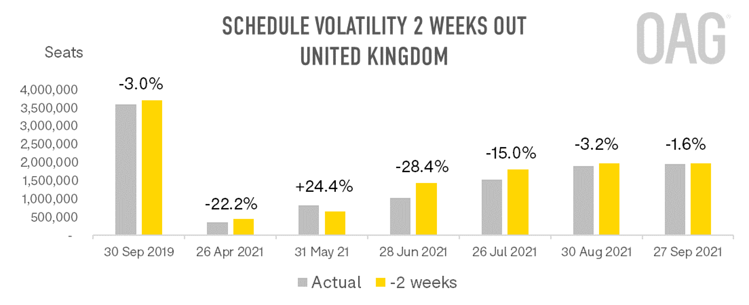
Turning to the UK, while a broadly similar pattern emerges there are some distinct differences. First, volatility in 2019 appears to have been much stronger than in many other European markets with 3% of seats being pulled from schedules in the fortnight before the week of flights starting on 30th September 2019. Today the volatility is almost half that figure. Comparing the UK to France, with a smaller proportion of airline capacity provided by low-cost airlines in 2019, might have pointed to low-cost carriers as a reason why capacity was more volatile. However, the proportion of capacity provided by LCCs is even higher in the UK than it was two years ago.

The second, observed difference is how much longer the high levels of volatility endured this past summer, with 28% of capacity being removed in the two weeks before the end of June and 15% before the end of July. Airlines must be hoping that they have finally reached a point where markets are more stable and the task of schedule planning can be done with more certainty.
Overview:

To learn more about the data behind this article and what OAG has to offer, visit https://www.oag.com/.


Sign up to receive our stories in your inbox.
Data is changing the speed of business. Investors, Corporations, and Governments are buying new, differentiated data to gain visibility make better decisions. Don't fall behind. Let us help.


Sign up to receive our stories in your inbox.
Data is changing the speed of business. Investors, Corporations, and Governments are buying new, differentiated data to gain visibility make better decisions. Don't fall behind. Let us help.


