Introduction
Welcome to the November Apartment List National Rent Report. Our national index increased by 0.8 percent from September to October, the lowest month-over-month growth rate since February. Although the pace of rent growth has slowed down significantly from its July peak, growth is still outpacing pre-pandemic trends, with rents continuing to rise during a time of year when seasonality normally causes prices to dip. Since January of this year, the national median rent has increased by a staggering 16.4 percent. To put that in context, rent growth from January to October averaged just 3.2 percent in the pre-pandemic years from 2017-2019.
While our national index continues to trend upward, 22 of the nation’s 100 largest cities saw rents fall this month, ending a six month stretch in which virtually all of these cities were experiencing uninterrupted rent growth. In particular, Boise saw the nation’s sharpest decline in rents this month, with prices down 3.1 percent from September to October. Boise has long been topping our list for fastest rent growth since the start of the pandemic, but with this month’s dip, that top spot now belongs to Tampa, FL, where rents are up 36 percent compared to March 2020. Prices also fell this month in San Francisco, one of the few cities where rents remain below pre-pandemic levels. With our national vacancy index ticking up for the second straight month, the rental market seems to be turning a corner from the unprecedented rent growth that has characterized most of this year.
Rents still rising, but growth has slowed significantly
Rents grew by 0.8 percent this month nationally, the third straight month that growth has slowed, after peaking at 2.6 percent in July. This month’s growth rate is the lowest since February, and less than a third of July’s record-setting growth rate. For the past seven months, month-over-month rent growth has exceeded the pre-pandemic record going back to 2017. In contrast, there were six individual months from 2017-2019 in which growth matched or exceeded this month’s 0.8 percent rate. However, in those prior years, rent growth of this magnitude only occurred during the late spring or summer months, in the midst of peak rental season. October normally sees prices declining due to seasonality in the market; in the pre-pandemic years from 2017-2019, rents fell by an average of 0.3% from September to October.
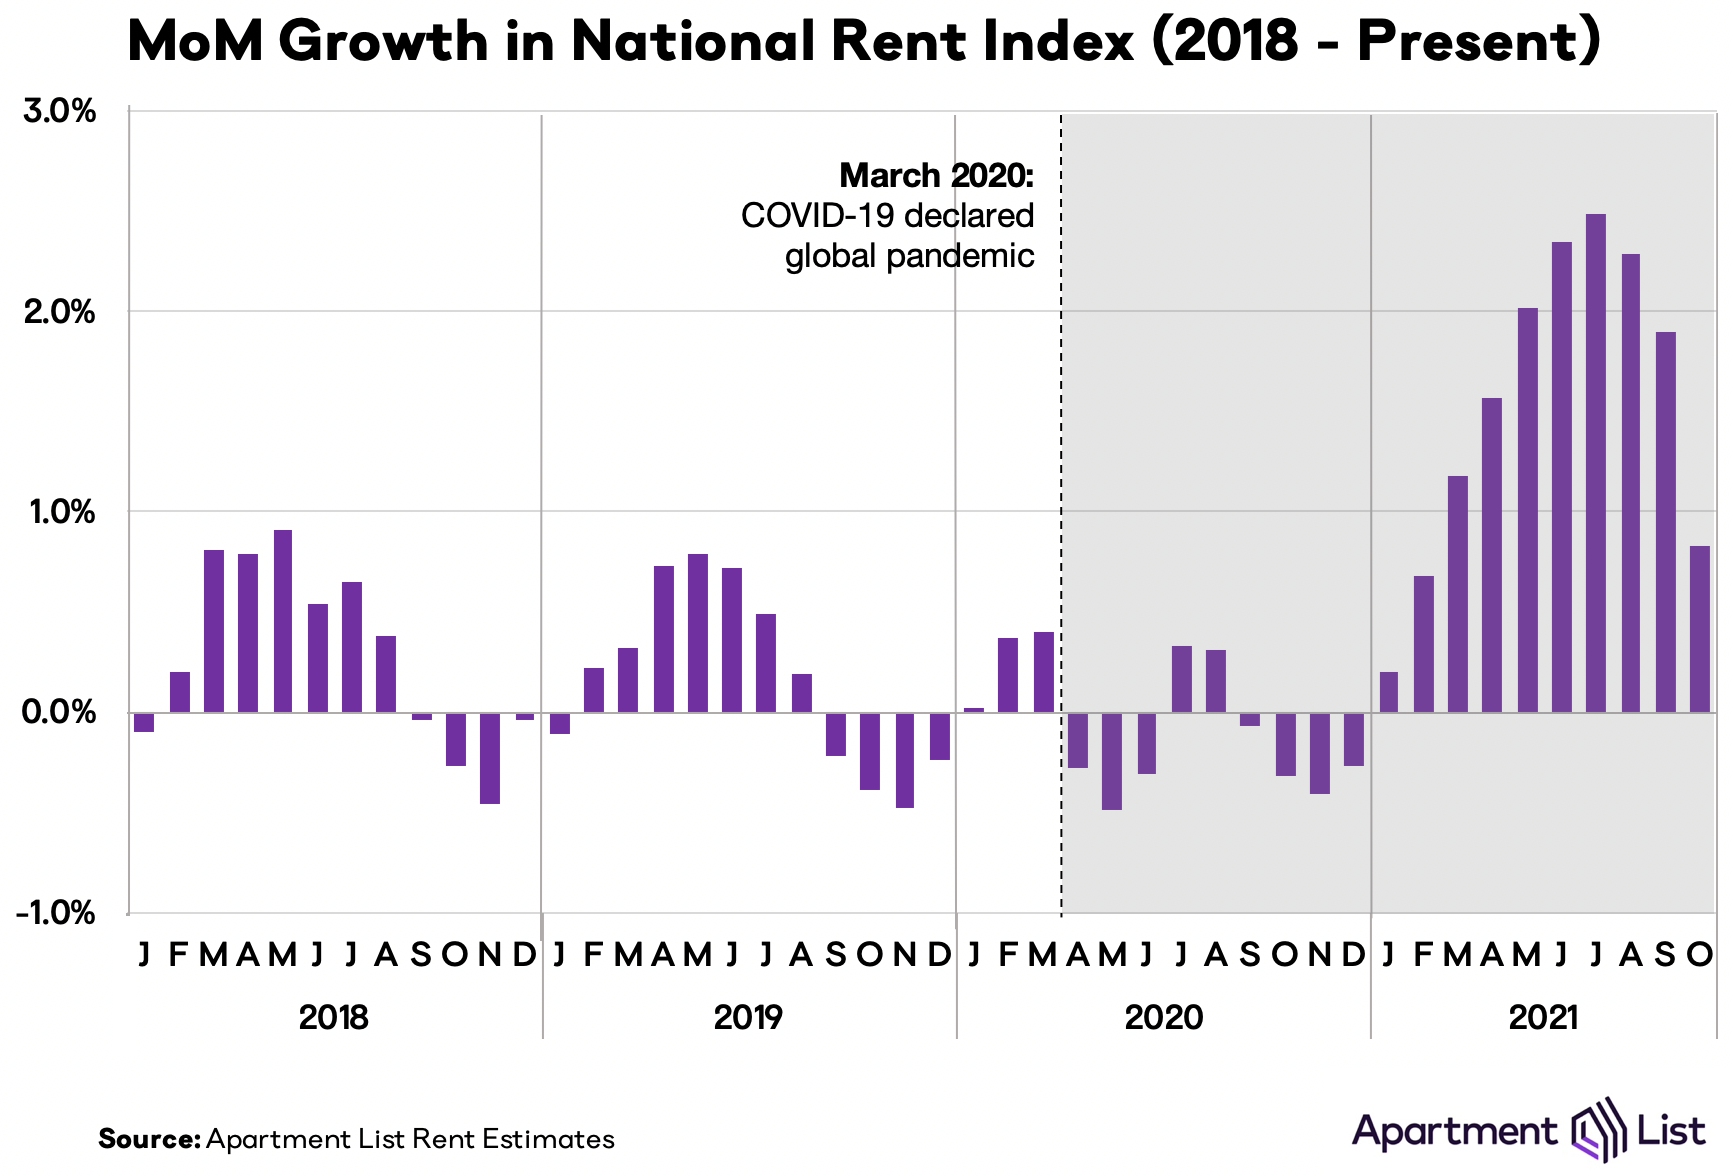
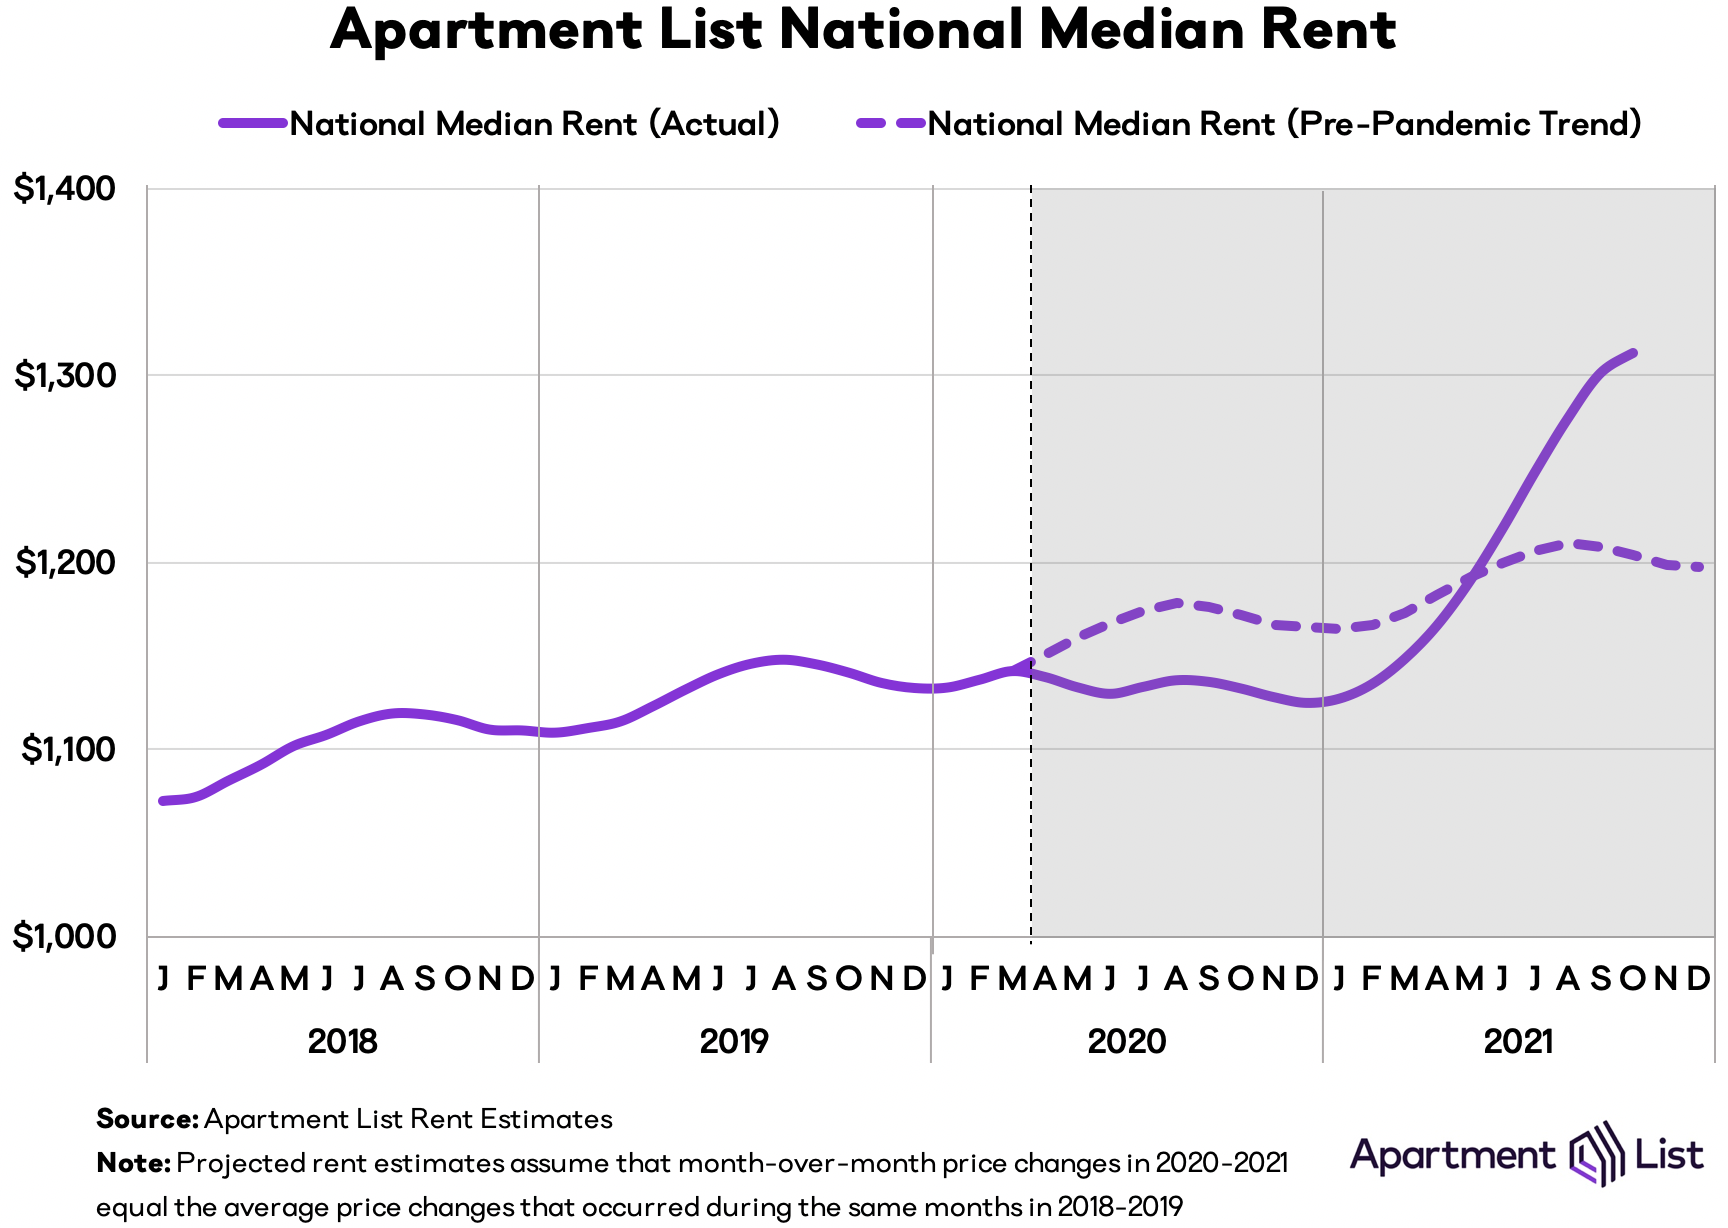
In other words, despite a significant slowdown, rent growth is continuing to exceed its pre-pandemic trend. To make this more clear, the chart below plots our national median rent estimate against a projection of pre-pandemic rent growth. The national median rent rose to $1,312 this month, which is $107 greater than where we project it would be if rent growth over the past year and a half had been in line with the growth rates we saw in 2018 and 2019.
Rent growth cooling almost everywhere
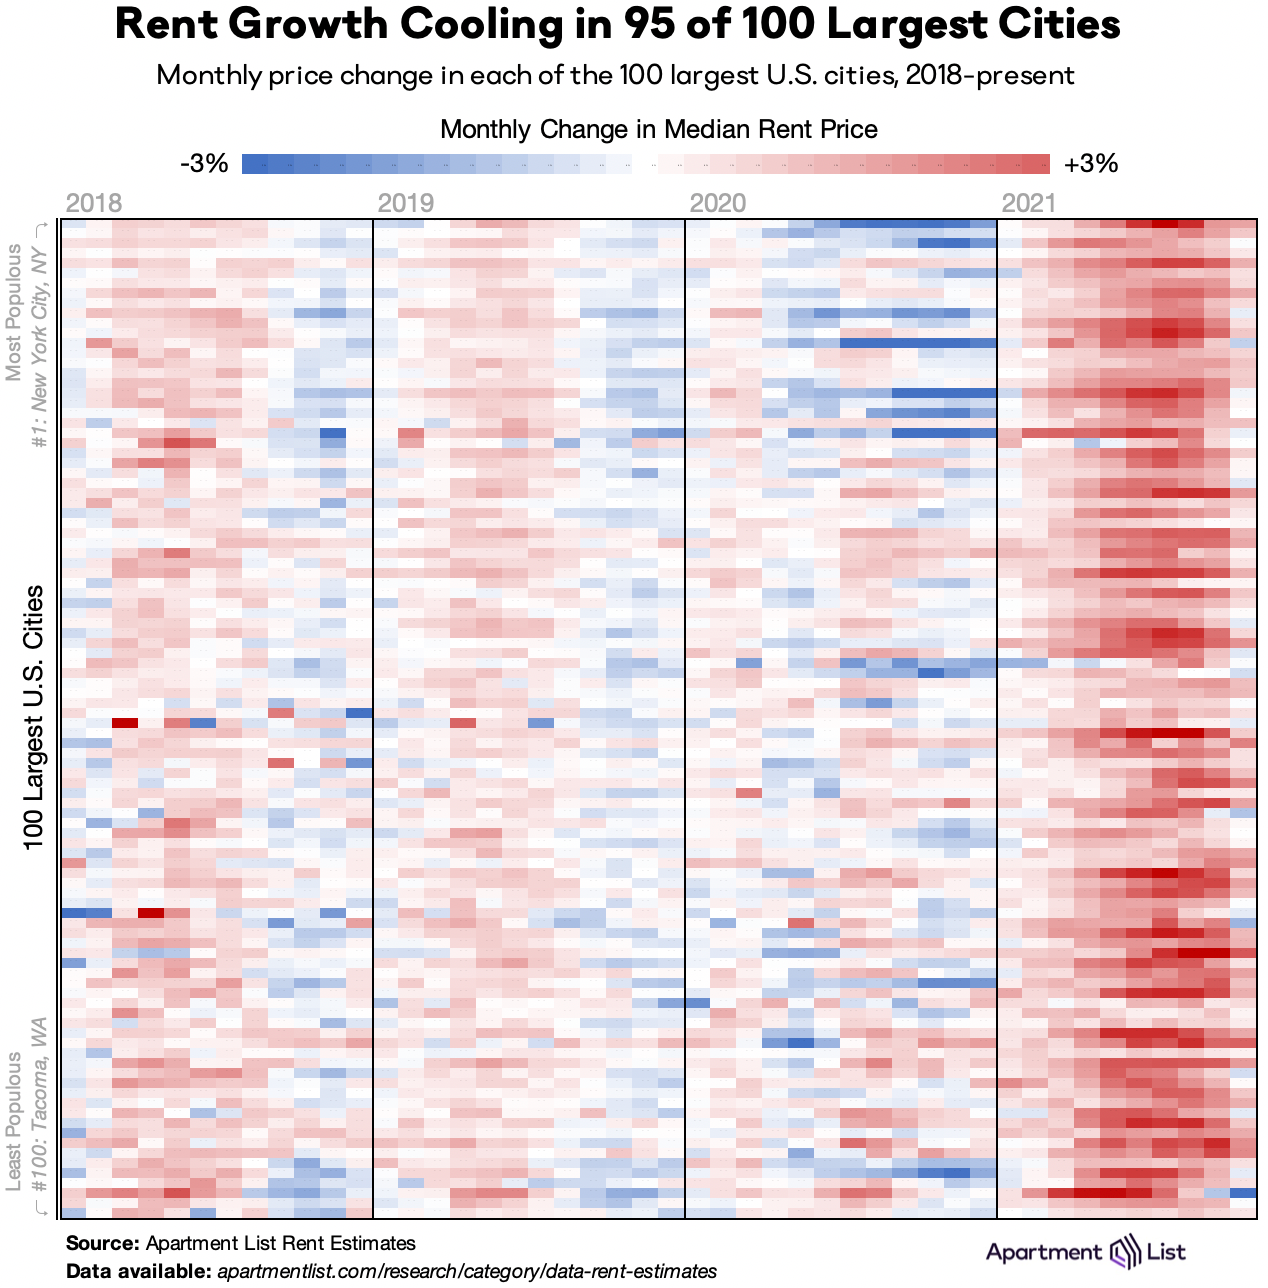
From March through September, virtually all of the nation’s 100 largest cities have experienced rapid and uninterrupted rent growth. This can be seen in the chart below, which visualizes monthly rent changes in each of the nation’s 100 largest cities from January 2018 to September 2021. The color in each cell represents the extent to which prices went up (red) or down (blue) in a given city in a given month. The dark red band on the right side of the chart depicts this year’s rent boom, but the final column shows that this month’s cooldown has also been geographically widespread. 95 of the 100 largest cities in the U.S. saw slower rent growth this month compared to last. And 22 of these cities actually saw rents fall this month, the most since January. Keep in mind, however, that in October 2019, rents declined in 76 of these cities.
Among the 22 cities where prices have started their winter cooldown, many are the expensive coastal markets that also saw the steepest rent declines throughout 2020. For example, prices fell across the San Francisco Bay Area this month: 1 percent in San Francisco, 0.4 percent in San Jose, and 0.1% in Oakland. They also fell in Minneapolis, MN; Boston, MA; Seattle, WA; and Arlington, VA; all cities that experienced significant “pandemic pricing” discounts during 2020. This marks the end of a strong rebound period for these cities, as visualized in the chart below which contains rent trends since March 2020 for the 10 cities that saw the sharpest rent declines in 2020. If this month’s slowdown is indicative of what’s to come, the San Francisco Bay Area may be settling into a new normal in which prices lag pre-pandemic levels for some time to come. And even for the cities on this list that have already seen rents rebound back to their March 2020 levels, this month’s data could be a sign that growth will continue to lag the national average going forward.
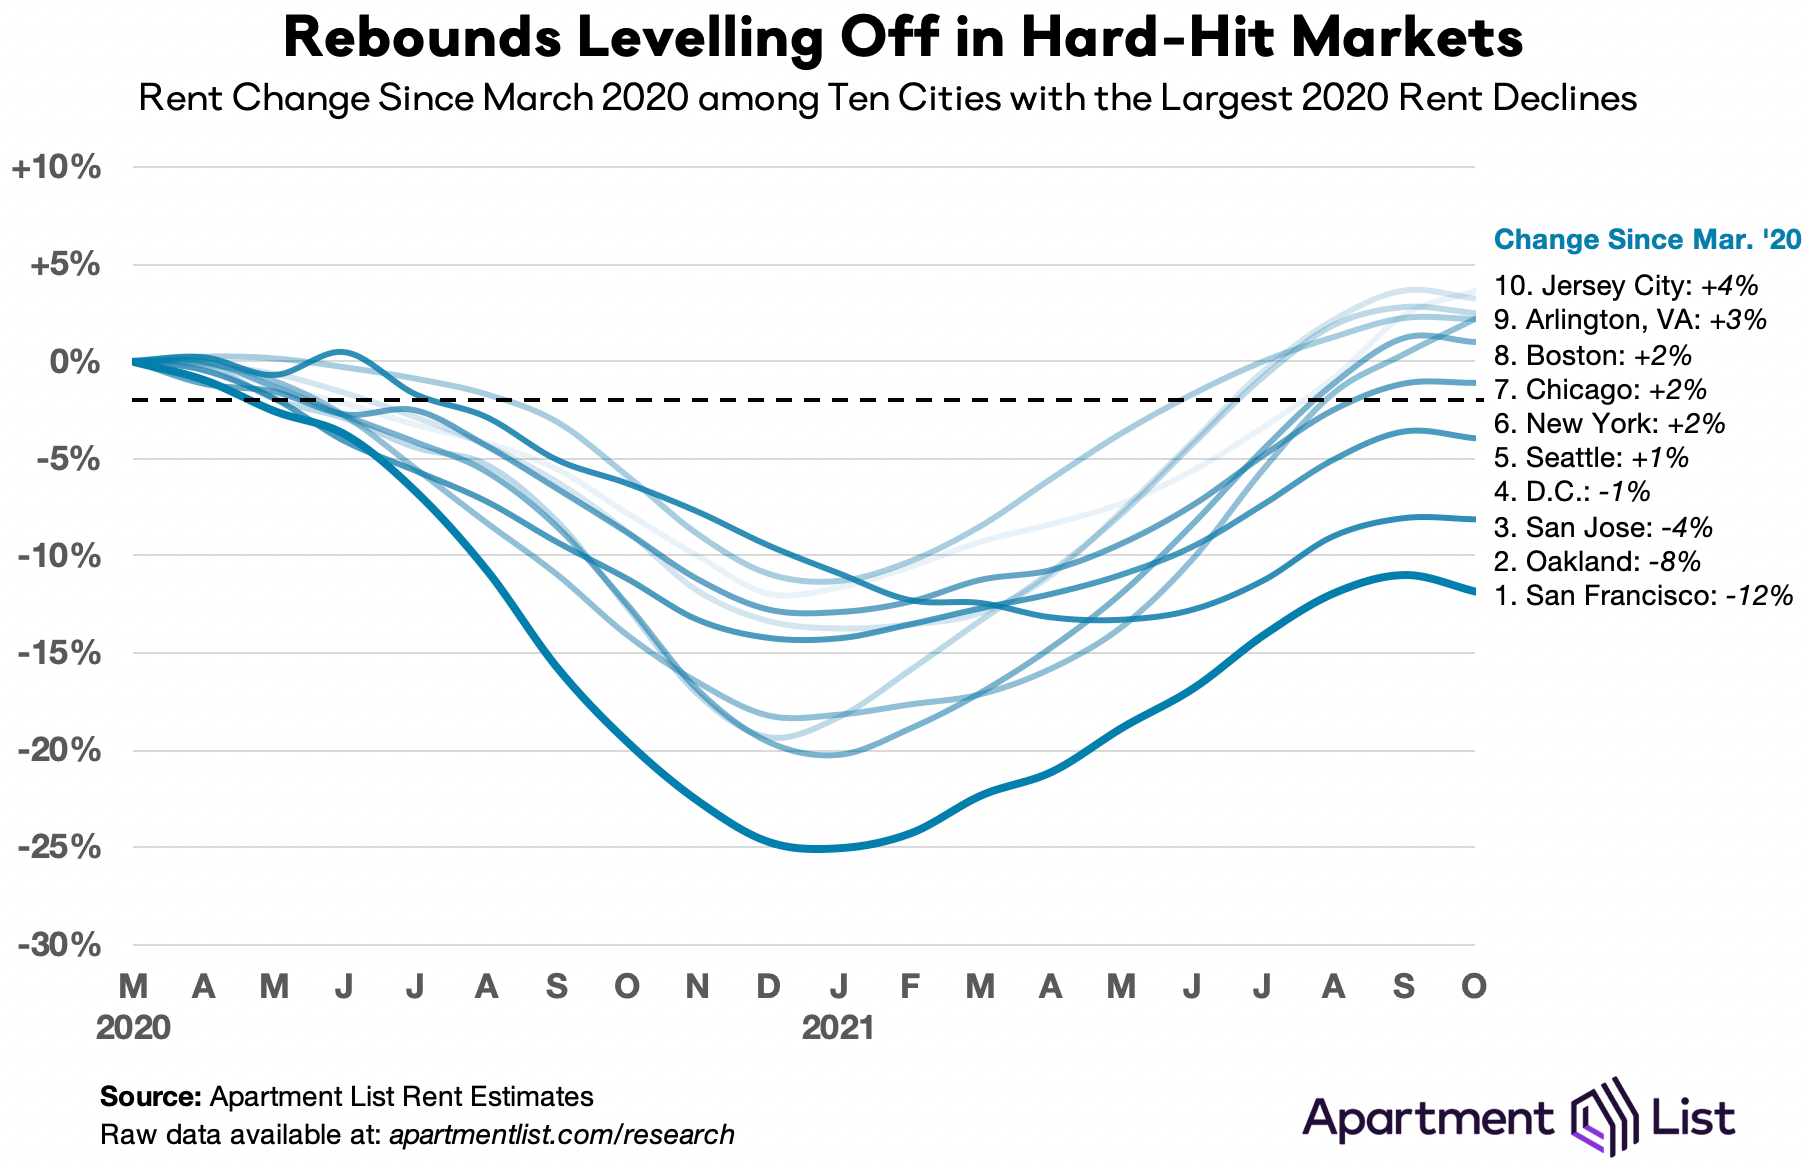
On the other end of the spectrum, among the cities that have seen the most dramatic rent increases throughout the pandemic, rent growth has slowed but continues on an upward trajectory. The one major exception is Boise, ID, which for the past 18 months has served as an archetype for rapid price growth spurred by remote work and shifting location preferences. After prices there flattened last month, Boise rents fell 3.1 percent this month, the steepest drop observed across all of the nation’s 100 largest cities. While local rents are still 34 percent higher than they were in March 2020, Boise no longer occupies the top spot for rent growth over that period. That designation now belongs to Tampa, FL, where rents have increased every month since June 2020 – including 1 percent this month – and sit a full 36 percent higher than they did at the start of the pandemic.
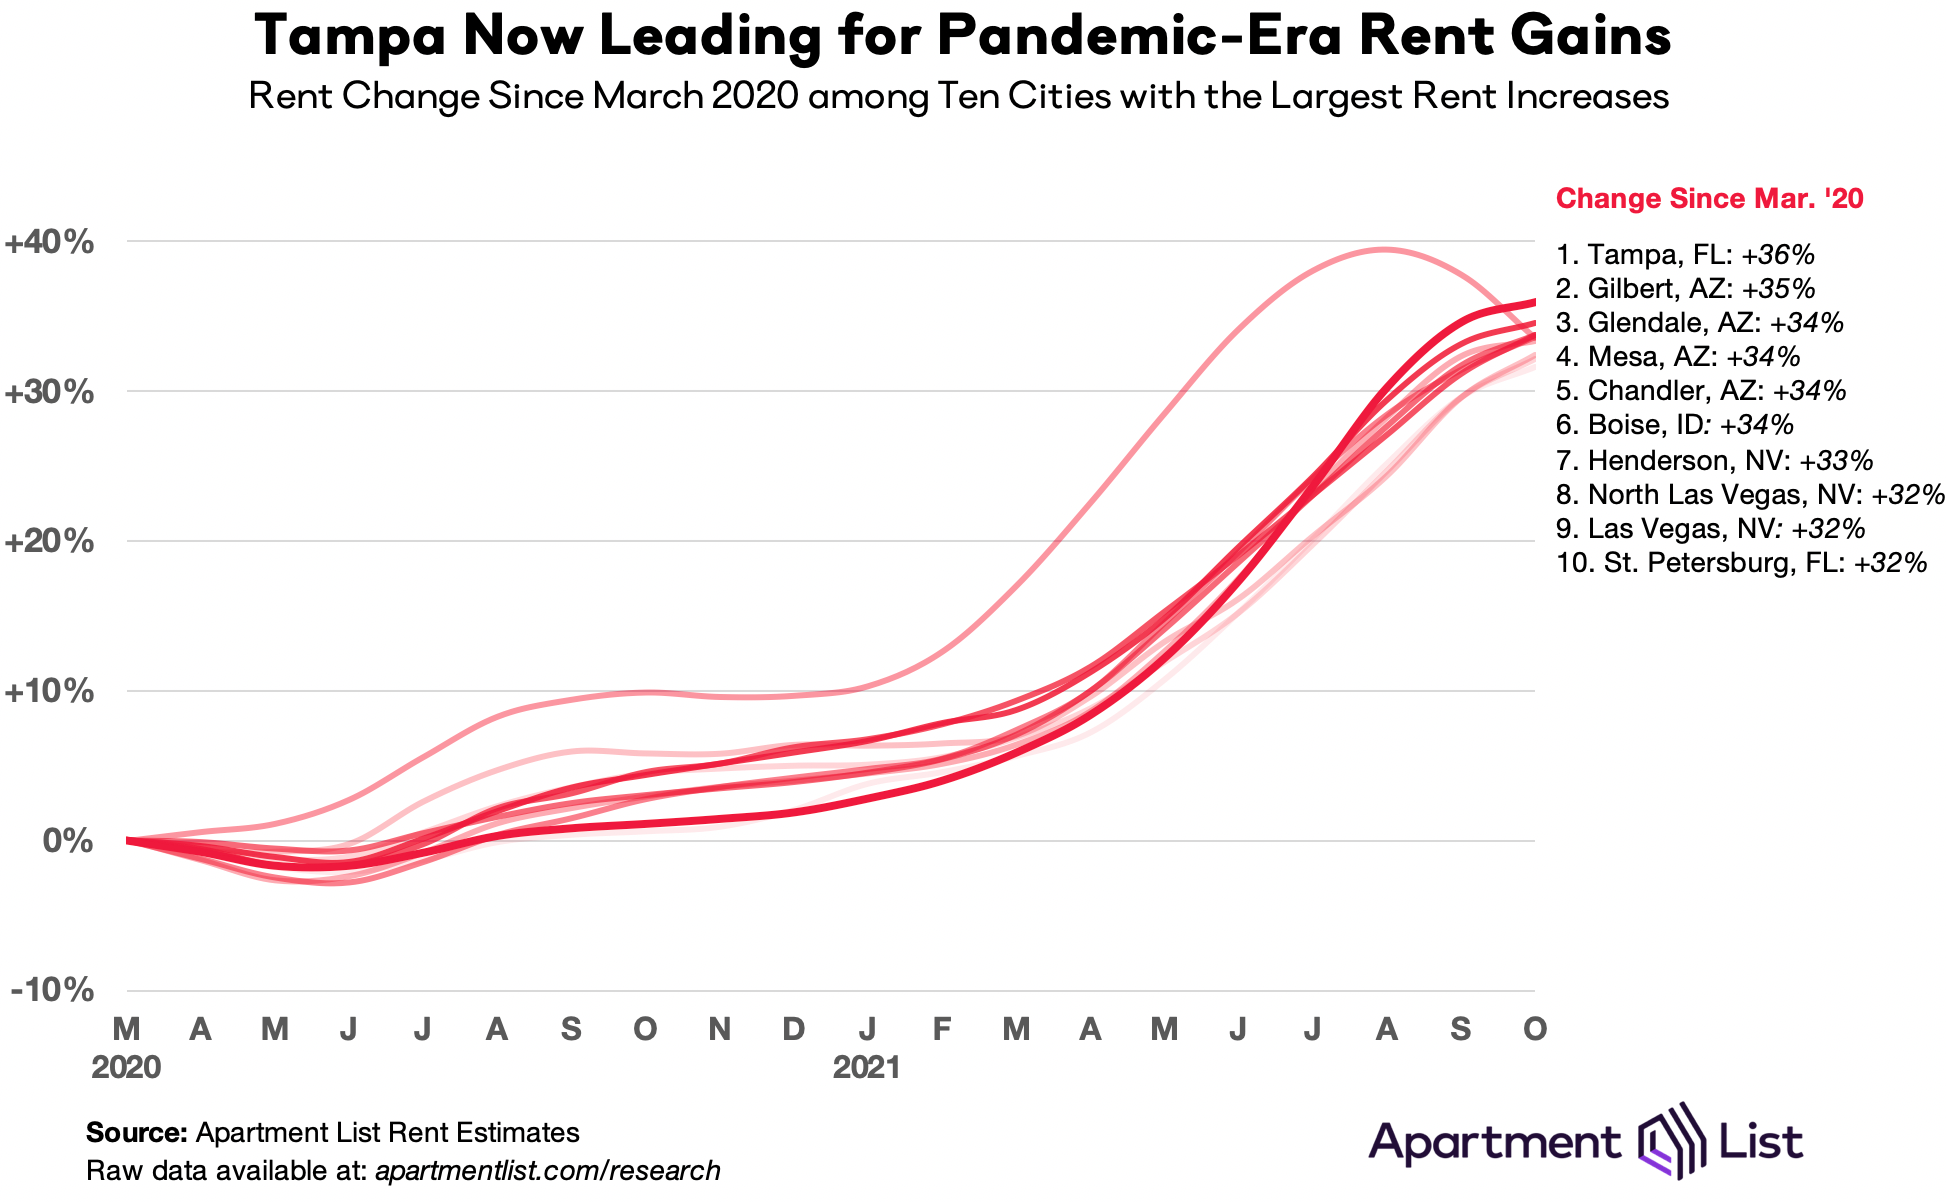
Excluding Boise, the other nine cities on this list all saw rent growth exceeding the national average, with an average increase of 1.5 percent. These nine cities are also concentrated in three Sun Belt metros – Tampa, Phoenix, and Las Vegas. In these markets the pandemic did not start a new trend, so much as accelerate an existing one. Affordability here was waning even before the pandemic ignited a rush of new rental demand. For example, from 2017 through 2019, rents in Mesa, AZ increased 25.5 percent, the fastest growth in the nation over that period. Although prices have crested in Boise, rapid rent growth is continuing to pose a threat to housing affordability across the Sun Belt.
Vacancy rate ticks up for second straight month
As we’ve explored in detail, much of this year’s boom in rent prices can be attributed to a tight market in which more households are competing for fewer vacant units. Our vacancy index spiked from 6.2 percent to 7.1 percent last April, as many Americans moved in with family or friends amid the uncertainty and economic disruption of the pandemic’s onset. Since then, however, vacancies have been steadily declining. For the past several months, our vacancy index has been hovering just below 4 percent, significantly lower than the 6 percent rate that was typical pre-pandemic.
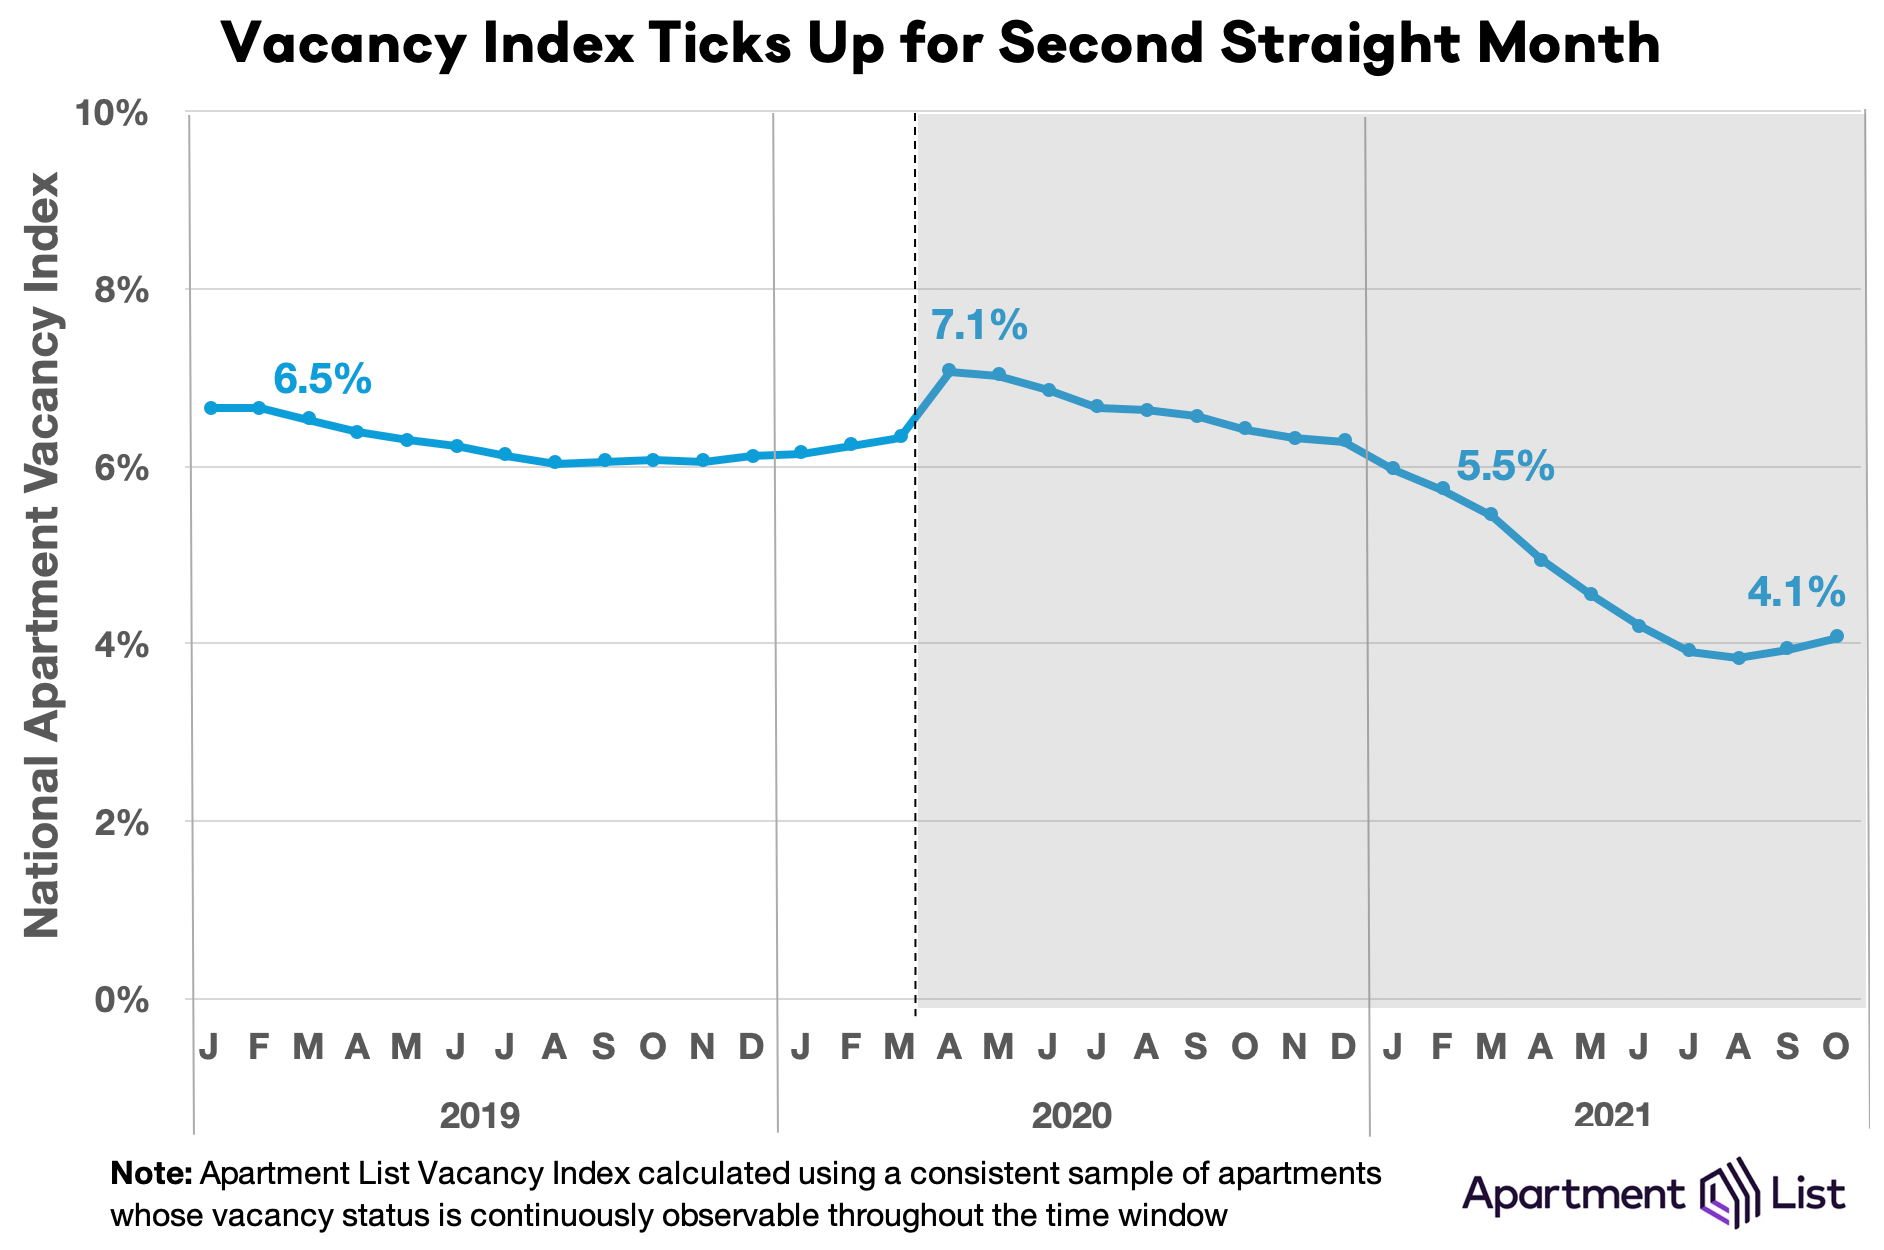
However, after bottoming out at 3.8 percent in August, our vacancy index has ticked up slightly for two straight months, and now stands at 4.1 percent. Although this is a fairly modest increase, it represents an important inflection point, signalling that tightness in the rental market is finally beginning to ease. If our vacancy rate continues to increase in the coming months, it’s likely that rent growth will also continue to cool.
Conclusion
Although the pandemic created some softness in the rental market last year, 2021 has brought the fastest rent growth we have on record in our data. Nationally, and in nearly all individual cities across the country, rent growth in 2021 has exceeded average growth rates from pre-pandemic years. This month however, that record-setting growth is finally showing signs of a meaningful slowdown. Although growth is still exceeding pre-pandemic trends, our vacancy index ticked up for a second straight month and month-over-month rent growth came in at less than one-third of its July peak. While the market remains extremely tight, we’re now seeing the first signals of that pressure beginning to ease. That said, it’s important to bear in mind that 35 of the nation’s 100 largest cities have seen rents jump by more than 20 percent since the start of the pandemic. Even if rent growth is finally cooling, this year’s rent boom has already added significant housing affordability pressure for America’s renters.
To learn more about the data behind this article and what Apartment List has to offer, visit https://www.apartmentlist.com/.


Sign up to receive our stories in your inbox.
Data is changing the speed of business. Investors, Corporations, and Governments are buying new, differentiated data to gain visibility make better decisions. Don't fall behind. Let us help.


Sign up to receive our stories in your inbox.
Data is changing the speed of business. Investors, Corporations, and Governments are buying new, differentiated data to gain visibility make better decisions. Don't fall behind. Let us help.