
Introduction
2021 was a year of staggering price growth on both the rental and for-sale sides of the housing market, but even before these recent spikes, housing affordability was already a major concern. Generally accepted wisdom holds that a household should not spend more than 30 percent of gross household income on housing costs (i.e. rent or mortgage payments) in order to maintain good financial health. However, as of 2019, nearly one-in-three American households spent above this threshold; these 36.5 million households are considered to be “cost-burdened.” 16.9 percent of American households were “moderately cost-burdened,” spending between 30 and 50 percent of household income on housing costs, while an additional 13.7 percent of households spent over 50 percent of their income on rent or mortgage payments, qualifying them as “severely cost-burdened.” The situation is especially acute for America’s renters; nearly half of renter households (48 percent) were cost-burdened in 2019, compared to 21 percent of owner households.
This is an issue we’ve tracked closely in the past, but in the time since our [most recent cost burden report](most recent cost burden report), the pandemic has spurred a remote work revolution which is quickly altering the relationship between where Americans’ jobs are located and where they choose to live. Given the stark economic disparity between those who work in remote-friendly occupations and those whose jobs must be performed onsite, we’ve framed this edition of our cost burden report around this divide. This report is based primarily on pre-pandemic data from the 2019 Census American Community Survey, but we supplement this with an analysis of pandemic-era trends from other data sources, including our own rent growth estimates.
Onsite workers are 41% more likely to be cost-burdened than those in remote-friendly jobs
Nationally, we estimate that roughly one-third of the American workforce are employed in occupations that can be performed remotely. Occupations are classified based on whether or not we deem them to be compatible with remote work, regardless of whether the individual working in that occupation was actually working remotely at the time of data collection. Remote-friendly occupations include software developers, accountants, and office clerks, while onsite occupations include retail salespeople, foodservice workers, construction workers, and teachers. The median worker in a remote-friendly occupation earns $59K annually, 64 percent more than the median for onsite workers ($36K). However, the median monthly housing costs of remote-friendly workers is only 24% greater than that of onsite workers ($1,540 vs $1,242). As a result, workers in onsite occupations are significantly more likely to live in cost-burdened households than their remote-friendly counterparts.
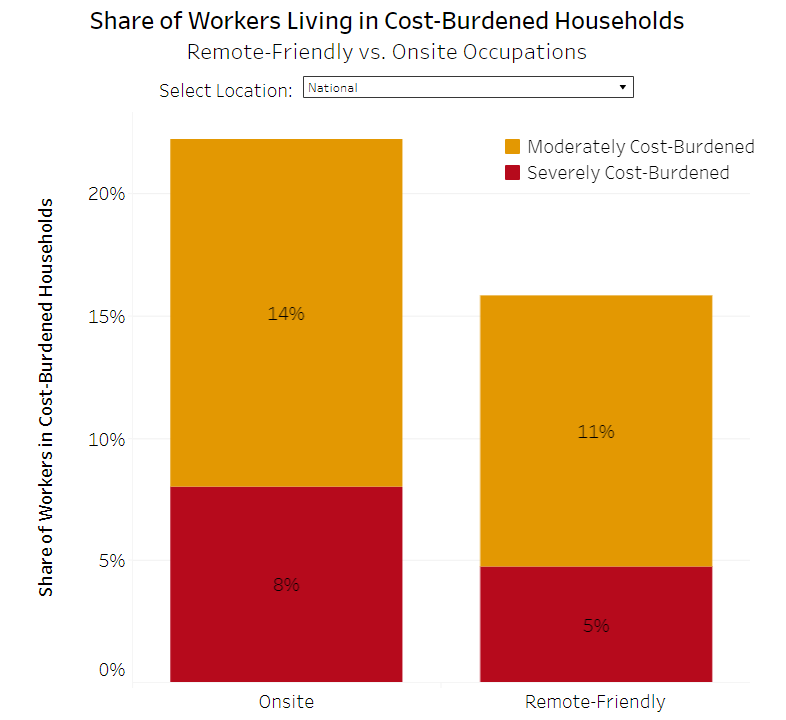
Nationally, 22.2 percent of employed adults who work in jobs that must be performed onsite live in cost-burdened households, compared to 15.8 percent of those working in remote-friendly occupations. In other words, onsite workers are 41 percent more likely to be burdened by their housing costs. Perhaps even more concerning, onsite workers are 70 percent more likely to be severely cost-burdened (8 percent vs 4.7 percent).
San Francisco Bay Area has the biggest gap in cost burden rates between remote-friendly and onsite workers
Cost burden rates are worse for onsite workers in every market in the U.S., but there is significant regional variation in both the overall prevalence of cost burden and the magnitude of the gap between onsite and remote-friendly workers. The chart below shows cost burden rates for these two groups of workers for each of the nation’s 25 largest combined statistical areas (CSAs).
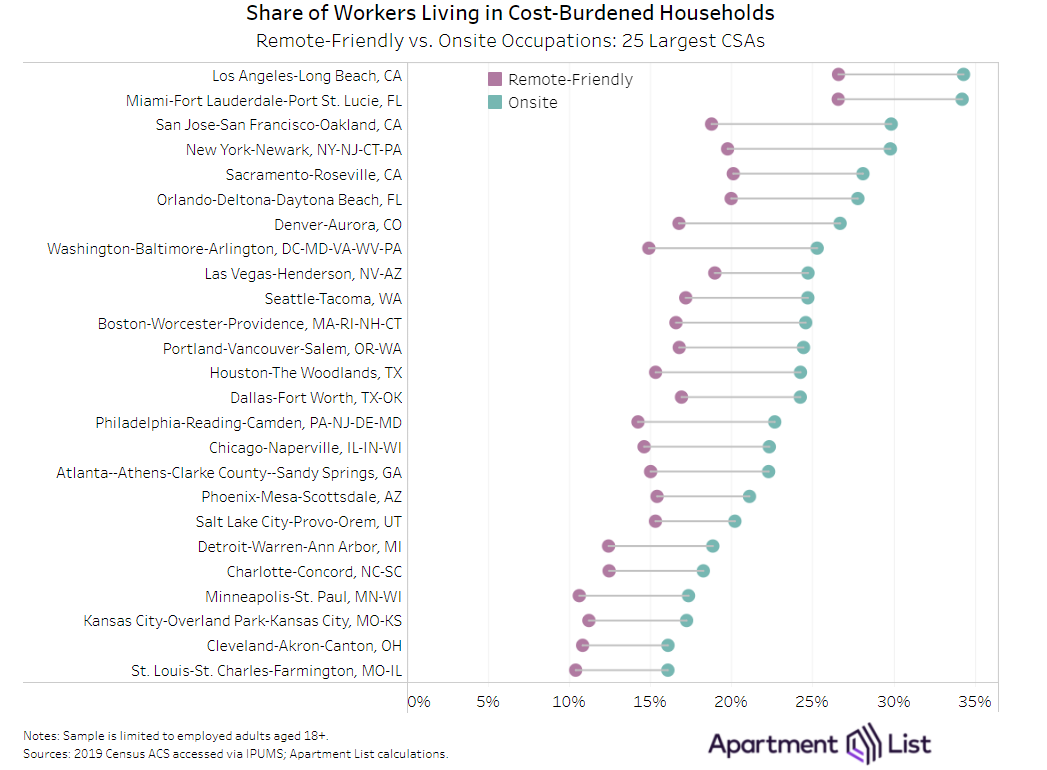
The Greater Los Angeles region has the nation’s worst cost burden rates for both remote-friendly and onsite workers. More than one-in-three onsite workers (34.3 percent) in the Los Angeles CSA live in cost-burdened households, compared to 26.6 percent of remote-friendly workers. The Miami CSA has the second highest cost burden rate for workers in onsite occupations (34.2 percent), while the San Francisco Bay Area comes in third. The Bay Area – where remote-friendly tech jobs dominate the local economy – also has the largest gap in cost burden rates between the two groups of workers (29.9 percent vs 18.8 percent). The Washington, D.C., New York City, and Denver CSAs also stand out for having the largest gaps between remote-friendly and on-site workers. These are some of the nation’s most expensive housing markets, putting significant financial strain on workers in lower-paid onsite occupations. At the other end of the spectrum, lower cost regions such as St. Louis and Cleveland have both less significant cost burden rates, and less extreme gaps between the two groups of workers.
Onsite workers are less likely to own homes, and more likely to be cost burdened even if they do
As previously mentioned, cost burden is a much more pressing concern for renters than for homeowners. Part of the large gap in cost burden rates between remote-friendly and onsite workers is attributable to the fact that onsite workers are significantly more likely to be renters. Nationally, 35.8 percent of employed adults in onsite occupations live in renter households, compared to just 29.2 percent of those employed in remote-friendly occupations. On top of being less likely to own homes, onsite workers are more likely to be cost-burdened regardless of their housing tenure status.
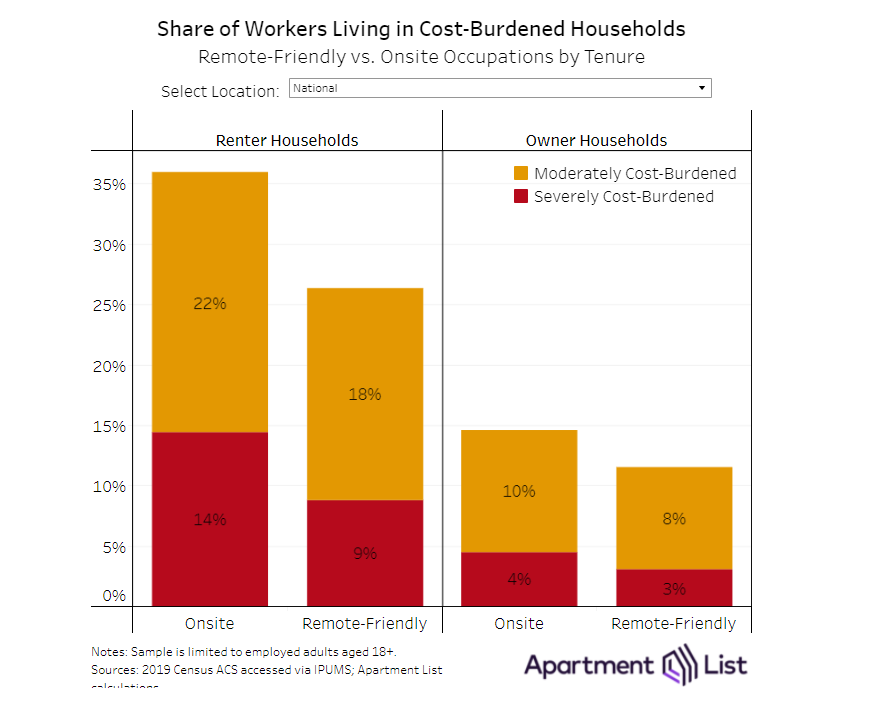
Homeowners in both groups are significantly less likely to struggle with housing costs, but even among homeowners, workers in onsite occupations are still more likely to be cost-burdened (14.6 percent vs 11.5 percent). However, the situation is notably worse for renters. More than one-in-three renters employed in onsite occupations live in cost-burdened households, and one-in-seven live in households where more than half of household income goes toward paying the rent. Compared to renters in remote-friendly occupations, renters in onsite occupations are 37 percent more likely to be cost-burdened and 64 percent more likely to be severely cost-burdened.
Black and Hispanic households are more likely to be cost-burdened, even those in remote-friendly jobs
As is unfortunately true of many aspects of the housing market, cost burden rates exhibit significant disparity when broken down by race and ethnicity. Cost burden rates are worst for Black and Hispanic households, and least severe for white households, regardless of occupation type.
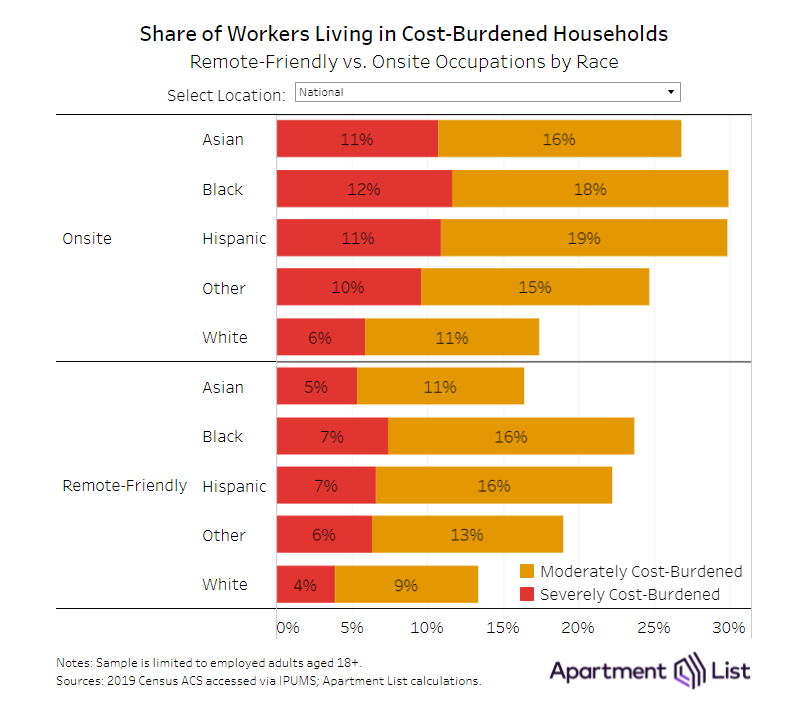
Within a given race, cost burden rates are consistently lower for those working in remote-friendly occupations, but within a given subset of workers – remote friendly or onsite – we observe significant gaps in cost burden rates between races. For example, among Black workers, those in remote-friendly occupations have a notably lower cost burden rate than those working in onsite occupations (30 percent vs 23.7 percent). However, Black workers in remote-friendly occupations are 78 percent more likely to live in cost-burdened households than white remote-friendly workers. Perhaps even more strikingly, the Black remote-friendly group is 36 percent more likely to be cost burdened than those white workers in onsite occupations. In fact, the cost burden rate for white onsite workers (17.4 percent) is lower than the rate for remote-friendly workers in each minority group except for Asians. In addition to having the lowest cost burden rates, White workers also have the smallest gap in cost burden rates between remote-friendly and onsite workers (Asian workers, on the other hand, have the largest gap between the two groups). It seems that while remote compatibility plays an important role in the likelihood of being cost-burdened, race remains a more salient factor.
Rents are growing fastest in the markets where onsite occupations are more prevalent
Given that the analysis in this report is based on data that precedes the pandemic, it’s natural to wonder how these trends have been evolving in recent years. It may be some time before official Census data paints a complete picture, but other available data points can provide clues. In terms of housing costs, our rent estimates show that after a slight 1.4 percent dip in 2020, the median rent increased by a staggering 17.8 percent over the course of 2021. On the for-sale side, the Case-Shiller National Home Price Index spiked by 30 percent from the beginning of 2020 through the end of 2021. Meanwhile, the Bureau of Labor Statistics estimates that average hourly earnings have increased by just 10.4 percent over the same period. Although wages are actually growing faster now than they were before the pandemic, that growth has not kept pace with rising housing costs. It’s also important to bear in mind that this rapid growth in housing costs has not hit all parts of the country equally. In fact, according to our data, there is a relationship between a metro’s pandemic-era rent growth and it’s pre-pandemic workforce composition with relation to remote-friendly vs onsite occupations.
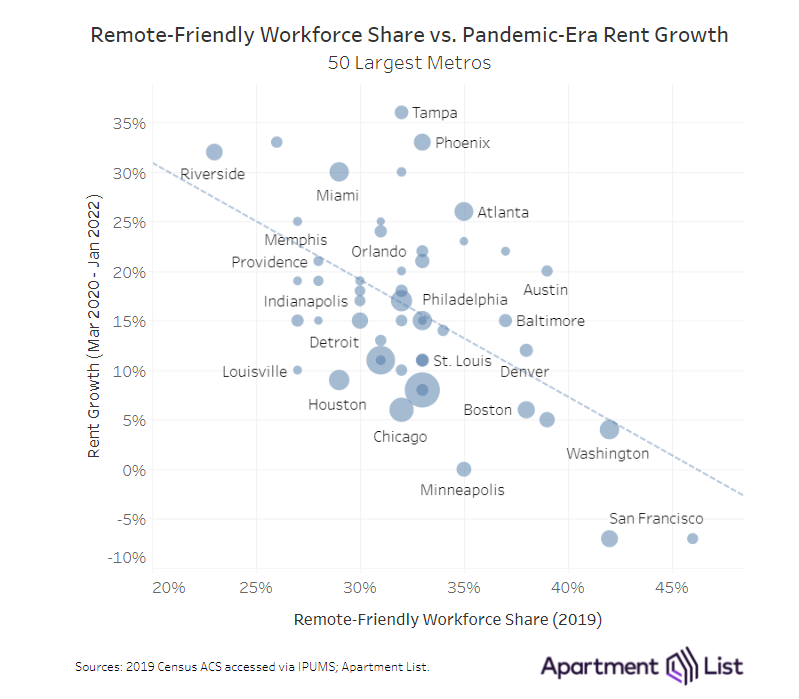
Specifically, the metros where remote-friendly occupations are most common have tended to see the slowest rent growth since the start of the pandemic, while those metros with the highest concentration of onsite occupations have tended to see faster growth. For example, in San Jose metro – home to Silicon Valley – nearly half of all workers (46 percent) are employed in remote-friendly occupations, the nation’s highest share. As some of these newly untethered workers take advantage of their geographic flexibility to move elsewhere, rents in the San Jose metro have fallen by 6.9 percent since March 2020, the largest decline among the nation’s 50 largest metros.
Conversely, just 23 percent of workers in the Riverside, CA metro had remote-friendly jobs as of 2019, the lowest share among the 50 largest metros. Rents there have jumped by a staggering 32.2 percent since the start of the pandemic. A similar trend is at play in the Las Vegas metro. The Tampa metro has seen the nation’s fastest rent growth over this period (35.6 percent), followed closely by Phoenix (33 percent). While these metros have higher shares of remote-friendly jobs than Riverside or Phoenix, they still rank in the middle of the pack on this metric. This trend is notable, given that onsite workers are already more likely to struggle with their housing costs, and also have less flexibility to move in search of more affordable housing.
Further exploration
As part of a recent collaboration with the Census Bureau for The Opportunity Project, our team built out a housing indicator dashboard which allows users to further explore the disparity in housing outcomes between remote-friendly and onsite workers. In addition to the CSA-level cost burden statistics presented above, our tool also contains a map view that provides a more granular look at how trends vary within a given region. We also overlay our Apartment List rent growth estimates as an indicator of how housing costs have changed since the start of the pandemic.
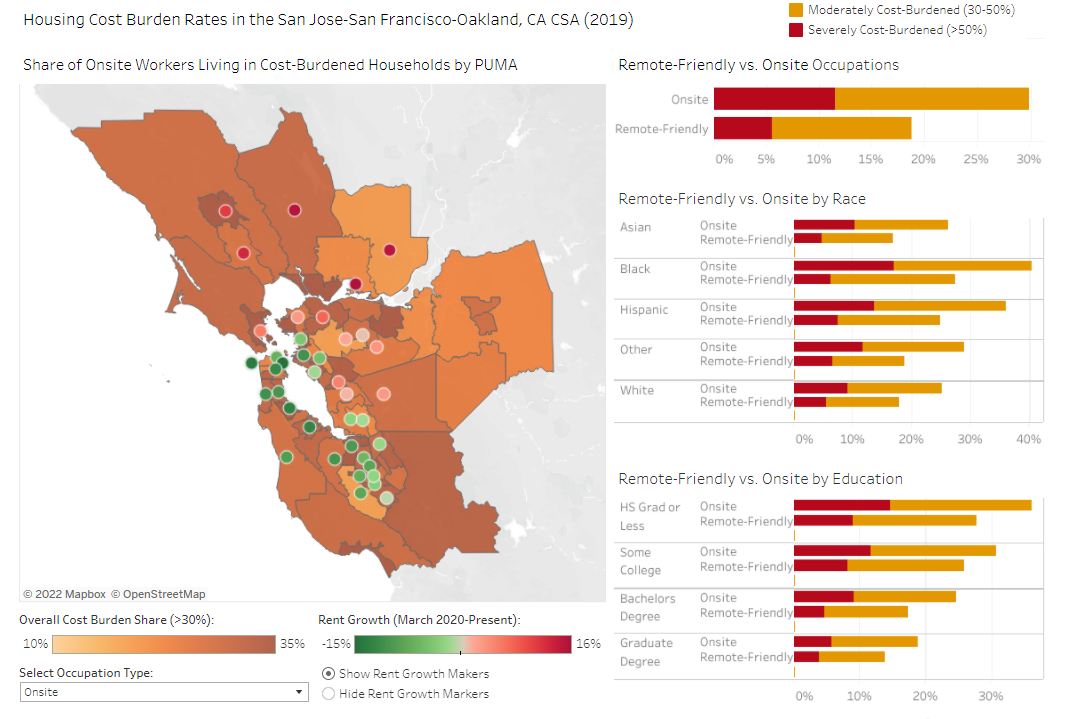
We hope that presenting the data in this way will allow users to draw new insights on how recent price trends could be exacerbating gaps between remote-friendly and onsite workers. For instance in the default view above for the San Francisco Bay area, it can be seen that some of the areas that had the lowest cost burden rates for onsite workers before the pandemic have actually seen some of the region’s fastest rent growth over the past two years. In addition to cost burden rates, the tool also contains data on median incomes, housing tenure, and the distribution of remote-friendly vs onsite jobs. We invite you to explore the data contained in this interactive tool to draw your own insights.
To learn more about the data behind this article and what Apartment List has to offer, visit https://www.apartmentlist.com/.


Sign up to receive our stories in your inbox.
Data is changing the speed of business. Investors, Corporations, and Governments are buying new, differentiated data to gain visibility make better decisions. Don't fall behind. Let us help.


Sign up to receive our stories in your inbox.
Data is changing the speed of business. Investors, Corporations, and Governments are buying new, differentiated data to gain visibility make better decisions. Don't fall behind. Let us help.