
U.S. weekly hotel performance continued to rev up with the largest week-over-week increase in occupancy this year. A level of 54.6% for 6-12 February 2022 was 4.2 percentage points better than the week prior, and in absolute terms, occupancy was highest since the second week of December. All day parts saw growth with the largest occupancy gain over the weekend (Friday and Saturday), up 6.6 percentage points to 64.1%. Of the 166 STR-defined markets, 91% reported week-over-week gains in weekend occupancy. Even more impressive, 36% of markets reported weekend occupancy above 65%. Weekday (Monday-Wednesday) occupancy, an indicator of business/group travel, increased 3.7 percentage points to 52.5%. Shoulder (Sunday & Thursday) occupancy was also up 2.5 percentage points. Besides gains in occupancy, average daily rate (ADR) also increased strongly, up 6.8% from the previous week. As a result, weekly revenue per available room (RevPAR) rose 15.6% from the prior 7-day period. Excluding the Christmas/New Year’s week, both ADR and RevPAR increased by the largest amounts in nearly a year.
The weekend was powered somewhat by Valentine’s Day, even though it fell on a Monday this year. What was more surprising and encouraging was the gain seen in weekday occupancy, which was led by the Top 25 Markets where weekday demand increased 11% week on week. Sharp growth was seen in Orlando, up 21 percentage points, where weekday occupancy reached 71% ahead of the UCA Nationals Cheerleading event. With the exception of the Christmas/New Year week, this was Orlando’s highest weekday occupancy since mid-July 2021. Phoenix also saw a large weekday occupancy gain before the PGA’s Phoenix Open as weekday occupancy reached near 80%, the highest weekday occupancy of any Top 25 Market. New York City was the surprise gainer as weekday occupancy increased 11 percentage points, even though weekday occupancy remained low in absolute terms at 49.5%. All but two Top 25 Markets (Nashville and New Orleans) saw weekday occupancy gains this week. Overall, Top 25 Market occupancy hit 54% with the weekday demand index to 2019 rising 7.4 points to 76, meaning this week’s weekday demand was 76% of what it was in the comparable week of 2019.
Central Business Districts (CBDs) also saw a nice bump in weekday occupancy, up 4.9 percentage points to 42%. The Tampa CBD again led the group followed by Miami. The CBDs in San Diego, Los Angeles, Denver, Dallas, and Boston all reported double-digit weekday occupancy gains. On the other hand, Houston CBD saw the largest decrease, falling 24 percentage points from the previous week. While nearly all CBDs saw growth, weekday occupancy in Washington DC, St. Louis, Chicago, Philadelphia, and Minneapolis remained below 30%. While this was a better week for CBDS, demand remained on the low side with the weekday index to 2019 at 61.
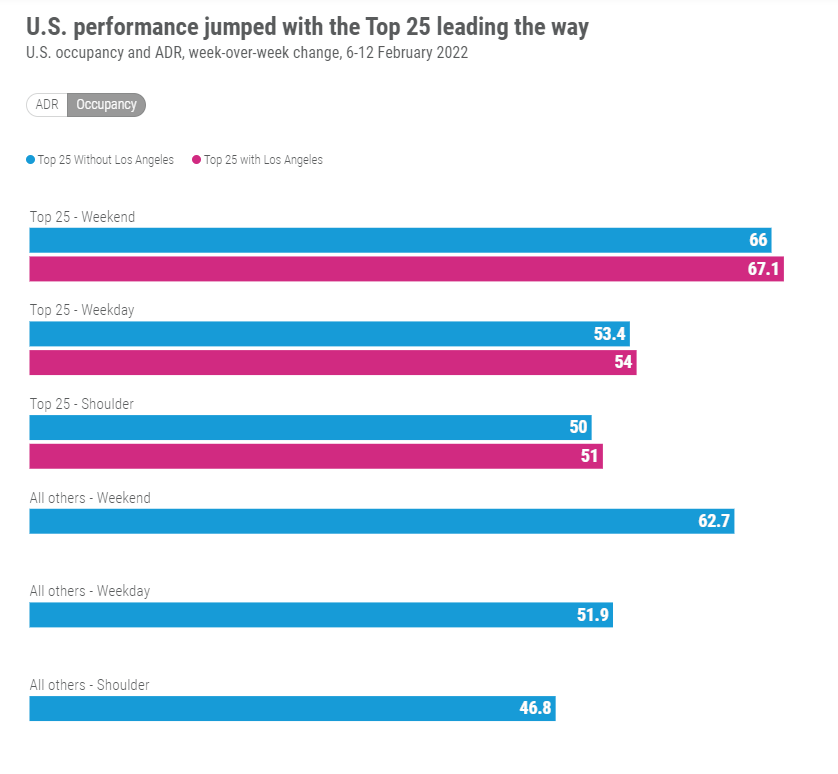
For the first time this year, all chain scales saw occupancy above 50%. Weekday Upper Upscale occupancy in the Top 25 Markets rose 7 percentage points to 48%. The largest weekday occupancy gain was among Luxury hotels, which rose 8 percentage points to 46%. Some of the gain among these hotels came from group demand. Group demand among Luxury and Upper Upscale hotels increased for the sixth consecutive week. Remarkably, group demand in Los Angeles, Orlando, Phoenix, and Tampa looked almost normal. Overall, group demand indexed to 2019 moved to 59, up from 48 the week prior. Looking only at weekdays, the 2019 group demand index was slightly lower (53) but up from the previous week.
For the entire week, market-level occupancy ranged from 87% in the Florida Keys to 37% in Myrtle Beach, the latter should see a boost as Spring Break kicks in. Like the weekdays, occupancy growth leaders were led by Orlando and Phoenix but were then followed by Harrisburg PA, New York City, and San Antonio. Both New York City (54%) and San Antonio (62%) saw their highest weekly occupancy since the holidays. San Antonio benefited from the opening of the annual Stock Show and Rodeo. Los Angeles, the site of this year’s Super Bowl, had the nation’s eighth largest occupancy increase this week with weekly occupancy topping 69%.
While weekend occupancy was the strongest of the past nine weeks, it remained below what was seen in 2019 with the index falling 4.5 points to 87, which was the second consecutive weekly fall. The decrease in the index was much less among Top 25 Markets (-0.3 points) with the index sitting at 84. It should be noted that the Top 25 saw much stronger weekend occupancy growth (8.2 percentage points) with an absolute level (67%) also higher than the national average. Tampa, Miami, Phoenix and Los Angeles all reported occupancy above 80% for the weekend. Another five markets, led by Orlando, had weekend occupancy above 70%. The lowest weekend occupancy was in Minneapolis (51%), followed by San Francisco at a similar level.
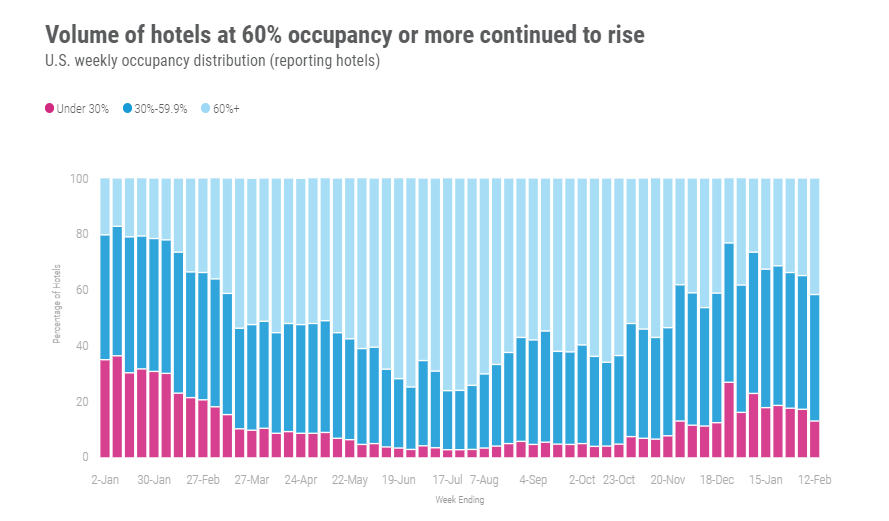
The Top 25 also drove ADR growth with a 12% week-on-week gain led by Los Angeles (+59% WoW) and Phoenix (+22% WoW). ADR in Orlando was up 17%. Excluding Los Angeles, weekly ADR was up 7.2%. While weekday and shoulder days saw solid gains, ADR benefited the most from the weekend, rising 17% among the Top 25 Markets (+7.9% excluding Los Angeles). Los Angeles’ weekend ADR rose 103% WoW to USD$348. Outside the Top 25, weekend ADR was up 4.5%. Total weekly U.S. ADR indexed to 2019 at 101. This was the first time in six weeks that weekly ADR was above the 2019 level. On an inflation-adjusted basis, the ADR index to 2019 was 91. Eighteen of the Top 25 markets had a nominal ADR above their 2019 levels with seven above 2019 on an inflation-adjusted basis.
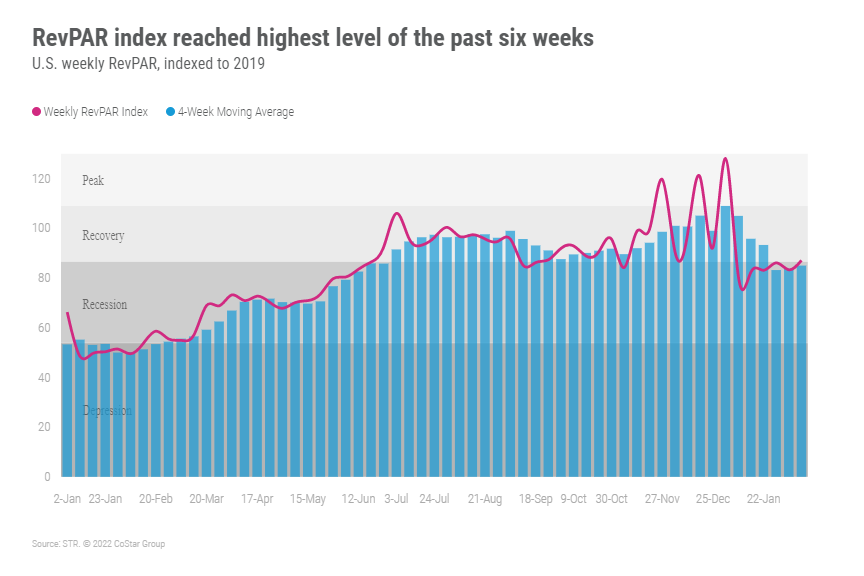
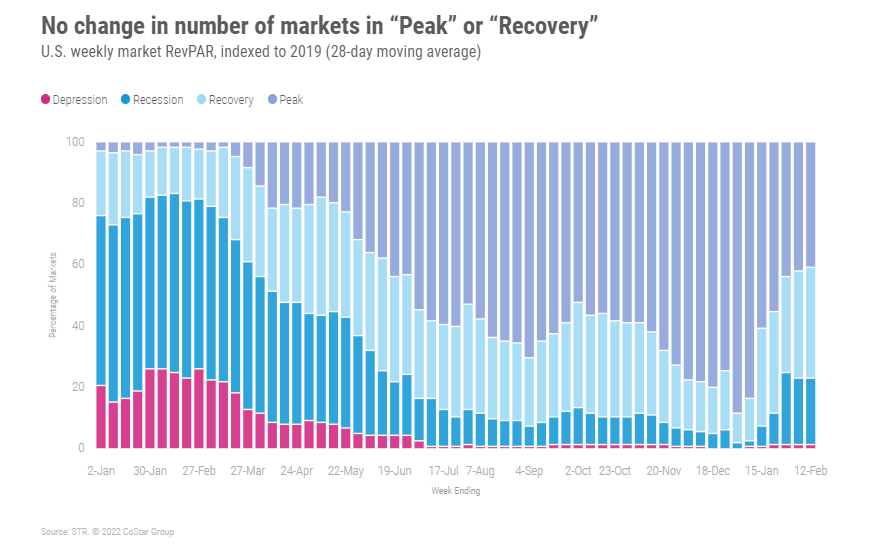
As with occupancy and ADR, RevPAR too was driven by the Top 25 where it increased 25% from the previous week. All but one market in the Top 25 saw a RevPAR increase. More astonishing, 17 of the Top 25 Markets reported double-digit week-on-week gains in the measure. As it has for the past 38 weeks, the hotel industry remained in STR’s “Recovery” category (RevPAR indexed to 2019 between 80 and 100) with this week’s index rising to 87. The 28-day index also remained in the “Recovery” category with 77% of all markets in either the “Recovery” or “Peak” (RevPAR indexed to 2019 above 100) categories. On an inflation-adjusted basis, the 28-day index was at 76, which is in the “Recession” category (RevPAR indexed to 2019 between 50 and 80). This was the third consecutive week that inflation-adjusted RevPAR was below 80. As result, less markets (69%) are in “Recovery” or “Peak” RevPAR.
Around the globe
In markets around the world, occupancy showed a significant jump, up 5 percentage points to a six-week high of 43%. Unfortunately, ADR didn’t follow, decreasing 5% after a fortnight of gains. The United Arab Emirates led with the week’s highest occupancy (77%) followed by Guam, which had a similar level. After weeks at the bottom due to strict COVID travel restrictions, Morocco saw its occupancy increase 17 percentage points to 29%.
Among the top 10 countries based on supply, the U.K. was on top with occupancy of 61%, up 5 percentage points week on week. Germany remained at the bottom with weekly occupancy of 32%. Due to COVID restrictions, China hasn’t benefited much from the Winter Olympics with occupancy of 40% this week. Beijing was at a similar level. However, several China markets saw significant week-over-week growth after the Lunar New Year. Standout cities included Zhengzhou, Shenyang and Chengdu. Occupancy in Canada was also 40%, while Ottawa, the site of the truckers’ protest, continued to see elevated levels.
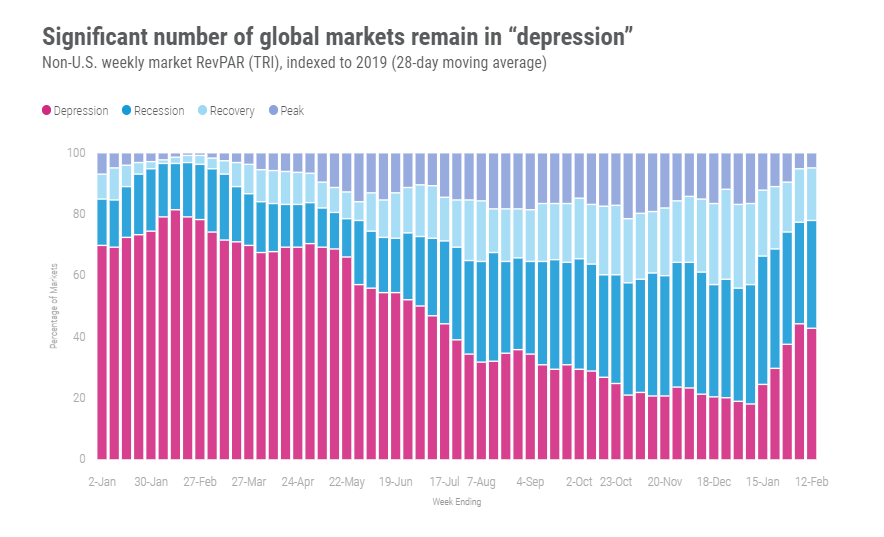
In the 28 days ending 12 February 2022, 43% of non-U.S. markets were in the “Depression” category (RevPAR indexed to 2019 below 80) with another 35% in “Recession.”
Big Picture
Historically, this part of February shifts the hotel industry into high gear starting with Valentine’s Day, continuing with the Presidents’ Day holiday weekend, and then Spring Break. We are encouraged by the gains seen in weekday occupancy and believe that it is the beginning increased business and group travel. Our conversations with travel planners confirm that meetings scheduled in February and March are moving forward, which is good news. Additionally, we are seeing a rise in the percentage of individuals returning to their offices in key cities like Chicago, New York, and Washington DC. This too should bode well for our industry and business travel. As we have been saying, better days are ahead.
To learn more about the data behind this article and what STR has to offer, visit https://str.com/.


Sign up to receive our stories in your inbox.
Data is changing the speed of business. Investors, Corporations, and Governments are buying new, differentiated data to gain visibility make better decisions. Don't fall behind. Let us help.


Sign up to receive our stories in your inbox.
Data is changing the speed of business. Investors, Corporations, and Governments are buying new, differentiated data to gain visibility make better decisions. Don't fall behind. Let us help.


