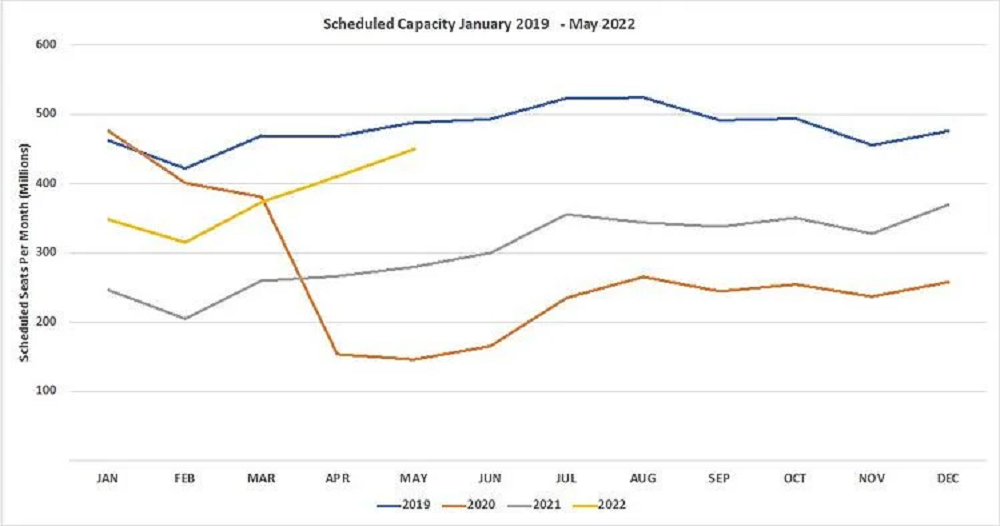
Two years ago, global airline capacity fell off a cliff; 21 million seats were cut in the space of seven days representing a 24% reduction, the Covid-19 pandemic was gathering pace and markets around the world were closing rapidly. Today, global capacity has settled at 82 million seats a week, an aviation recovery of sorts but still 22% below the same week in 2020 - although for the optimistic amongst you that is a 39% increase on this time last year. It seems that things are heading in the right direction, but as we expected the journey to recovery will not be without some bumps along the way and perhaps from events that we had not anticipated.
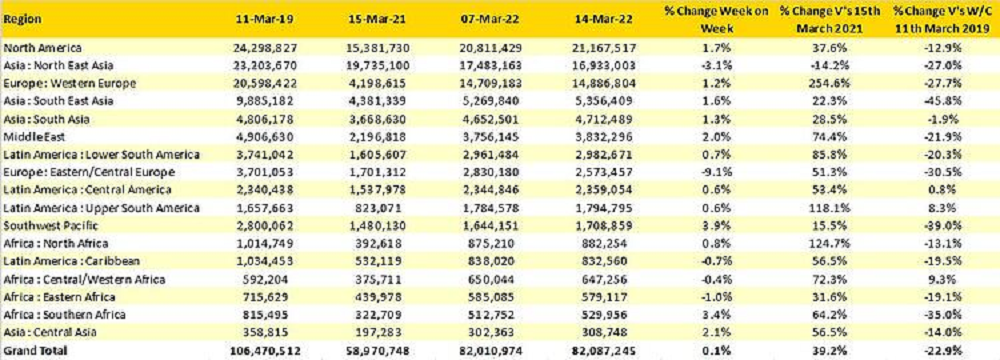
Last week we reported that forward-looking airline capacity was growing strongly for the next three months. However, this week’s data suggests that airlines are adjusting capacity down around the world to reflect the impact of sanctions; nearly 16 million seats have been removed through to the end of May, a 1% drop.
Weekly Capacity Changes by Region, Forward Quarter

Movement has taken place, most notably in Central / Eastern Europe where airline capacity has fallen by 9%. North America remains the single largest region with an extra 350,000 seats this week and with North East Asia slipping back by some 550,000 the gap between the two regions has grown to 4.2 million seats and is now at one of its widest points since the Covid-19 pandemic began.
Compared to 2021 some markets have significant recovery statistics; Western Europe for example is +254% on the same week last year now at 14.9 million compared to just 4.1 million twelve months ago, although to keep that in context the region still remains at -28% on the same week in 2019.
Scheduled Airline Capacity by Region

Beyond the regional summary we have reviewed those country and airline markets that are still struggling to recover, comparison to what was a “normal” week in 2019 makes for some interesting insights about how far some places still have to travel on the recovery.
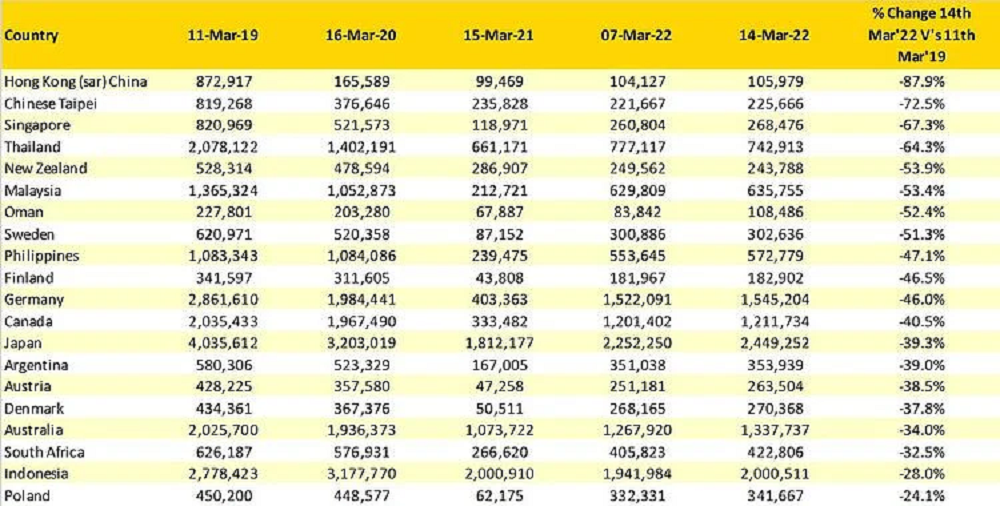
Throughout the pandemic, Hong Kong has been one of the most impacted aviation markets and continues to have around just 12% of its “normal” levels of airline capacity. The impact on local airlines has been devastating and therefore it is not surprising that Chinese Taipei is second on the table given that its two largest markets, China and Hong Kong, remain effectively closed. Eight countries are still at less than half of their 2019 capacity and six of the “Top Ten” are in the Asia/Pacific region which has been the slowest region for recovery in the last few months. Some of those Asian markets may see a noticeable improvement in their capacity position in the coming weeks, Malaysia will reopen from the 1st April and the national airline is already planning double daily services to London Heathrow - if there will be enough demand is of course another thing!
Six countries in Europe are in the list of twenty as well with Sweden the most impacted at just half of the 2019 capacity levels and Finland similarly at -46% with recent events impacting some of their potential traffic and routings to Asia. Finnair are still scheduling flights to Seoul Incheon and Tokyo Narita this week but with longer journey times and routings than normal; AY73 a regular scheduled service had a journey time of some 12:50 last week compared to a more normal 8:30 a few weeks back.
At the beginning of the pandemic, some country markets transitioned the balance of their capacity with an increasing emphasis on domestic airline capacity. A great example is China, where domestic airline capacity was 20% higher at one point in March 2021 than in March 2019. However, for some countries the loss of international capacity has not been replaced by increased domestic capacity. Japan is a case in point where 86% of international capacity has yet to return, and with the country continuing to have limited resources for testing a re-opening of the market remains some way off. China does however remain the most “closed” international market with just 7% of its normal capacity operating this week.
Scheduled Capacity, Top 20 Country Market Capacity Declines W/C 14th Mar’22 V’s 11th Mar’19

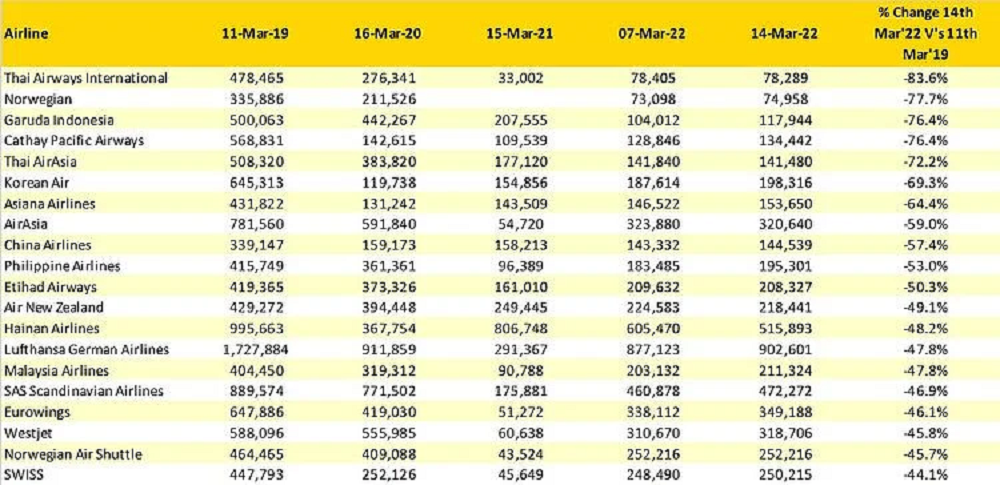
As we analyse the ongoing impact to airlines, we have placed a minimum operating criteria of 300,000 seats in the week of the 11th March 2019 on the data, to ensure that we avoided some of the very small carriers with even larger capacity reductions than reported below. Those carriers may not be in the list but we haven’t forgotten about them either! Not surprisingly Thai International are the airline with the largest capacity shortfall against their 2019 levels as the country struggles to recover capacity and major source markets such as China and Hong Kong are effectively closed.
Two very large Asian carriers, Garuda and Cathay Pacific have very similar levels of capacity reduction and indeed in terms of absolute seats now on sale are at similar levels; for both airlines, the recovery remains uncertain.
Through the pandemic many airlines reshaped their networks and adjusted their strategies, partly driven by the immediate impact on their business but in some cases as a rason to accelerate a change in strategy that was already underway. One such case is in the United Arab Emirates where Etihad were already adjusting their operation; capacity for the carrier remains at just half of 2019 levels whilst Emirates who perhaps also have less fleet flexibility than Etihad are at 65% of 2019 levels.
Another example of airlines in the same market with different rates of recovery is in the UK where Jet2 are actually 16% up on their 2019 capacity whilst Ryanair are at 90%, Virgin Atlantic at 78%, easyJet at 77% and British Airways at 67%. Of course, filling all of those seats is more important than just the capacity number but those numbers highlight just how quickly the LCC’s have built back compared to legacy carriers.
Top 20 Capacity Declines W/C 14th Mar’22 V’s 11th Mar’19

So, this week’s data once again shows a slight positive improvement in numbers, and whilst we have focussed on those markets still yet to see any significant recovery things are turning around in many of those countries. Capacity will always change from week to week and airlines will always adjust their operation based on demand but as we head for the second quarter of the year it looks like many markets are in recovery.
To learn more about the data behind this article and what OAG has to offer, visit https://www.oag.com/.


Sign up to receive our stories in your inbox.
Data is changing the speed of business. Investors, Corporations, and Governments are buying new, differentiated data to gain visibility make better decisions. Don't fall behind. Let us help.


Sign up to receive our stories in your inbox.
Data is changing the speed of business. Investors, Corporations, and Governments are buying new, differentiated data to gain visibility make better decisions. Don't fall behind. Let us help.


