Consumer interest in department stores sometimes seems to come and go as frequently as a “One-Day Sale.” With so many shifting dynamics, CE data provides several tools for checking on Department Store health. In today’s Insight Flash, we look at how overall industry growth has paced versus Full-Price and Off-Price chains, how online penetration has been trending, and whether number of transactions or spend per transaction has been a bigger growth driver for certain chains this year.
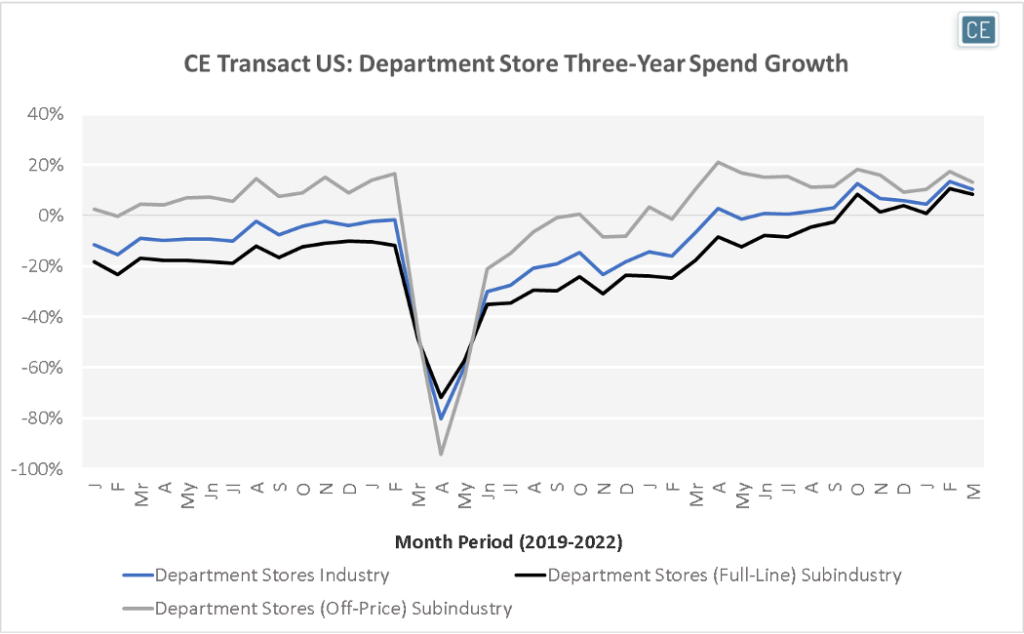
Looking at spend growth on a three-year basis to compare versus pre-pandemic trends, the Department Store Industry has been in positive territory since the second half of 2021. With the exception of April and May of 2020 when many stores were closed, Off-Price growth has consistently been stronger than Full-Line growth every month since the beginning of 2019. This is partly due to store count expansion. However, that gap has been narrowing recently. While Off-Price spend growth was almost 30% higher than Full-Line spend growth in the spring of 2021, in the last four months that gap has been a single-digit percentage, down below 5% in March 2022 as Full-Line Department Store spend grew 8.5% versus three years prior and Off-Price Department Store spend grew 13%.
Spend Growth

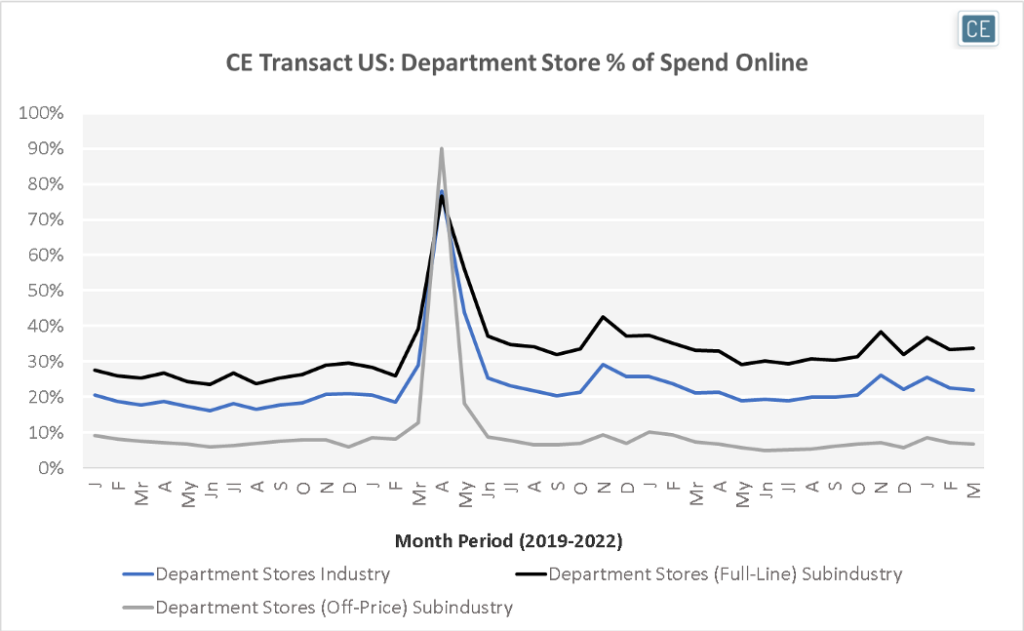
One driver of this narrowing gap may be that Full-Line Department Stores have much higher exposure to online sales trends. Over the past three months, Full-Line Department Stores have seen over a third of their spend online. This is up from only about a quarter of spend pre-pandemic. Meanwhile, Off-Price Department Stores only saw 8.5% of spend online in January, 7.2% in February, and 6.7% in March. These percentages are actually down from 2019, partly due to Burlington shuttering online sales in March 2020**.** Ross, another major Off-Price chain, has never sold merchandise on its website.
Online Penetration

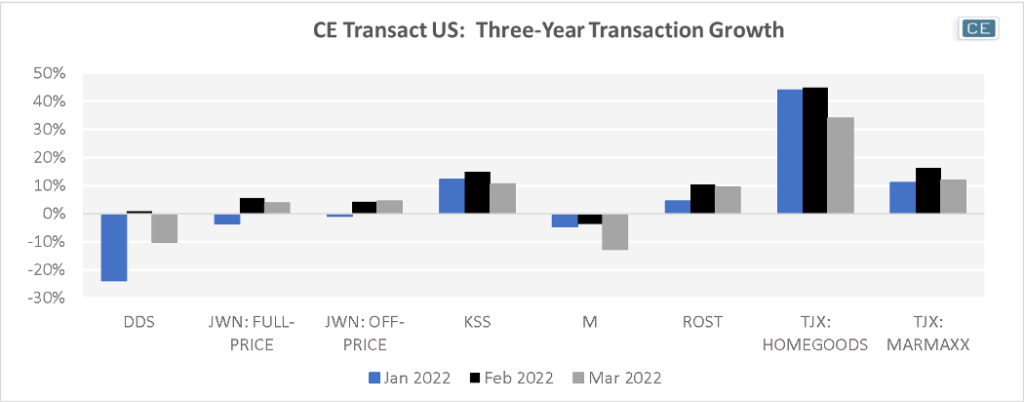
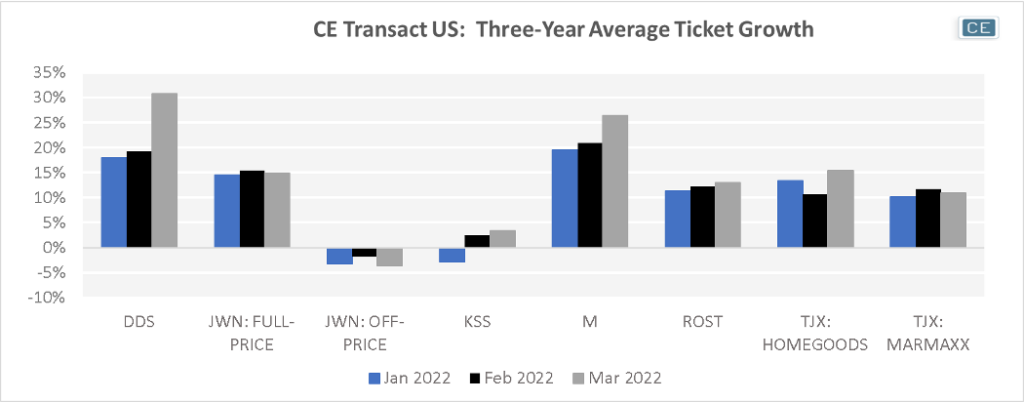
Another important difference in Department Store growth is whether chains are seeing increased transactions or higher spend per transaction. Over the last three months, TJX’s HomeGoods segment has seen the strongest three-year transaction growth in the space, with its Marmaxx segment in second place. However, Full-Line Department Stores such as Macy’s and Dillard’s have been seeing much higher spend per transaction – up 31% on a three-year basis in March for Dillard’s and 26% for Macy’s.
Spend Growth Drivers


To learn more about the data behind this article and what Consumer Edge Research has to offer, visit www.consumer-edge.com.


Sign up to receive our stories in your inbox.
Data is changing the speed of business. Investors, Corporations, and Governments are buying new, differentiated data to gain visibility make better decisions. Don't fall behind. Let us help.


Sign up to receive our stories in your inbox.
Data is changing the speed of business. Investors, Corporations, and Governments are buying new, differentiated data to gain visibility make better decisions. Don't fall behind. Let us help.


