Our most recent white paper takes a closer look at the ripple effects domestic migration can have on local industries. We examined how office buildings, grocery stores, smaller cities, and even restaurant preferences are reacting to seemingly small fluctuations in local demographics.
We explore one such change below. For in-depth insights into the way domestic migration can shape an industry.
The Consumer Demographics Impact
As demographics shift, the types of households populating a given geographical region often shift as well. Identifying what kind of changes are taking place can help both stores and suppliers improve merchandising decisions and anticipate local demand. And with supply chain concerns continuing for the foreseeable future, retailers that combine migration and demographic data to stay aware of an evolving customer base can better anticipate local demand.
The Growing State of Delaware
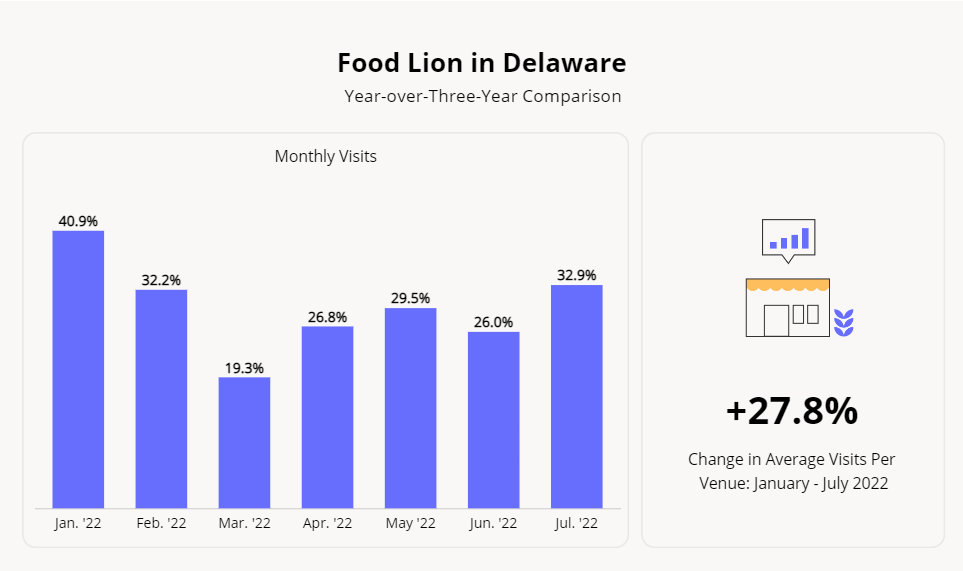
Delaware, one of the most sparsely populated states in the country, has increased in population by nearly 10% over the past decade. These changes are boosting local businesses like Food Lion, a regional grocer with over 1,000 stores in 10 states located mostly in the mid-Atlantic region. The company operates 20 stores in Delaware, and these stores saw an average 32.9% year-over-three-year (Yo3Y) increase in July 2022. And the average visit per Delaware Food Lion store has increased as well, with 27.8% more shoppers per location between January and July 2022 when compared to the same period in 2019.

Digging Deeper into Local Population Shifts
To see how Food Lion’s demographic landscape has evolved over the past three years, we used STI: Popstats data. This dataset employs a unique algorithm to combine data from the U.S. Postal Service ZIP, the U.S. Census, and field tests to build both historic and future population growth forecasts.
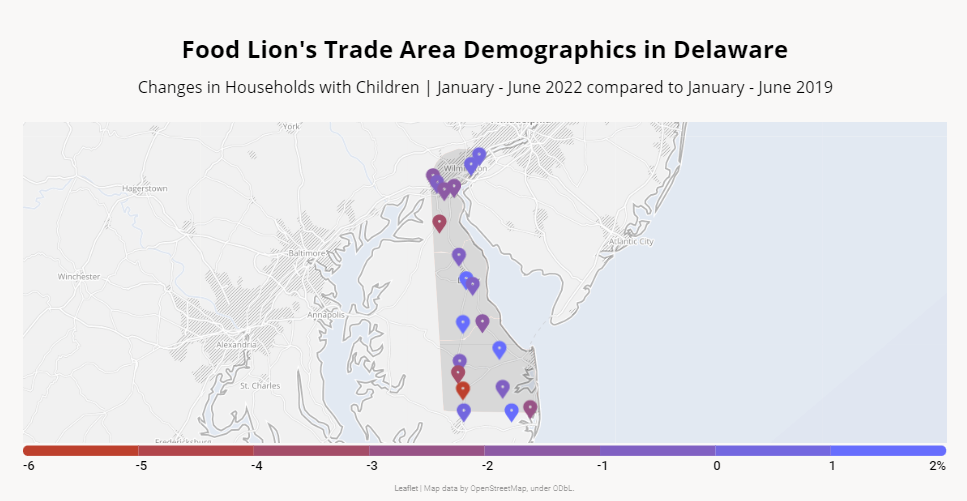
We compared the demographic makeup of the trade areas of two Food Lion locations – one on Sussex Highway, Laurel, and one located at North Dupont Highway, Selbyville in the first half (H1) of 2019 and H1 2022, focusing on the share of households with children in each trade area. Both stores saw changes in their shopper demographics, but the changes went in opposite directions. The Sussex Highway location had a 6.1% decrease in households with children in H1 2022 compared to the trade area of the same store in H1 2019. Meanwhile, the trade area of the North Dupont Highway location in H1 2022 had 2.9% more households with children than the store’s trade area in H1 2019.
Understanding these shifts can help store managers stock their shelves appropriately while improving chain-level merchandising decisions – especially in times of supply chain challenges. For example, in the event of a possible chocolate shortage, Food Lion can prioritize chocolate shipments for stores with higher rates of households with children and even redirect products between different branches as needed.

Chains that understand the differences in demographics between its various stores’ trade areas can align promotional strategies to the populations it serves and make sure its branches are stocked with the products local shoppers need and seek out.
To learn more about the data behind this article and what Placer has to offer, visit https://www.placer.ai/.


Sign up to receive our stories in your inbox.
Data is changing the speed of business. Investors, Corporations, and Governments are buying new, differentiated data to gain visibility make better decisions. Don't fall behind. Let us help.


Sign up to receive our stories in your inbox.
Data is changing the speed of business. Investors, Corporations, and Governments are buying new, differentiated data to gain visibility make better decisions. Don't fall behind. Let us help.


