Abstract There has been a heated debate over the last few months over the question of how many real human users Twitter has. While all previous work focused on analysis of Twitter accounts and attempts to classify bots, Similarweb takes a different, unique approach.
We apply an explainable machine learning algorithm using datasets of digital activities of panels of users to provide robust estimates of Twitter’s average Monetized Daily Active Users (mDAU) for the US over the period of Q3 2021-Q2 2022. Our approach has several advantages that allow us to provide estimates for various user populations beyond what is reported by Twitter or investigated in previous work. For one, our approach allows us to ensure with a significantly higher level of confidence that a user is not a bot using their complete digital footprint beyond just tweets. We can further estimate the additional unauthenticated users that do not hold a Twitter account yet consume content on Twitter and as such can be monetized. We provide a clearer insight into the fact that a relatively small portion of authentic Twitter users is responsible for most of the content published by authentic users. Finally, our study shows that, even under the assumption that a relatively small number of active bots generate content, their overall content contribution is actually significant.
1. Introduction
Twitter began using the mDAU metric in its financial reports for Q1 2019 [1]: “Twitter defines monetizable daily active usage or users (mDAU) as Twitter users who logged in or were otherwise authenticated and accessed Twitter on any given day through twitter.com or Twitter applications that are able to show ads. Average mDAU for a period represents the number of mDAU on each day of such period divided by the number of days for such period.”
In the Q2 2019 financial report, Twitter added a clarification [6]: “We also treat multiple accounts held by a single person or organization as multiple mDAU because we permit people and organizations to have more than one account. Additionally, some accounts used by organizations are used by many people within the organization. As such, the calculations of our mDAU may not accurately reflect the actual number of people or organizations using our platform”.
As stated in Twitter’s reports, such as the 2021 annual report: “The substantial majority of our revenue is currently generated from third parties advertising on Twitter. We generate substantially all of our advertising revenue through the sale of our Promoted Products: Promoted Ads, Twitter Amplify, Follower Ads and Twitter Takeover.”
Observe that Twitter considers monetizable users as users holding a Twitter account, whereas potentially, unauthenticated users, e.g. users that consume Twitter content without holding a Twitter account, can also be monetized through ads.
Twitter’s CEO Parag Agrawal tweeted on May 16th 2022 on the subject of Twitter’s mDAU estimate: “…we have estimated that <5% of reported mDAU for the quarter are spam accounts”. He also tweeted on the same day on the subject of how the mDAU of non-bot users is estimated: “Our estimate [of the mDAU of real users] is based on multiple human reviews (in replica) of thousands of accounts, that are sampled at random, consistently over time, from accounts we count as mDAUs”. Also he added: “Unfortunately, we don’t believe that this specific estimation can be performed externally”.
Our first goal is in fact to do just that: estimate Twitter’s average US mDAU for Q3 2021- Q2 2022, using an explainable machine learning algorithm and compare it to the corresponding quantities reported in Twitter quarterly earning reports. Moreover, under certain conservative assumptions, our analysis provides interesting insights on the impact bots have on Twitter content.
Our contribution
Main results
In Table 1 below, we provide our estimates for Twitter’s bot-free US mDAU for 21Q3-22Q2. OAs can be seen, our estimates are well correlated with Twitter’s mDAU as reported in their quarterly earning reports. We note, however, that from a trend perspective, we do not observe Twitter’s reported increase of mDAU in 22Q2.
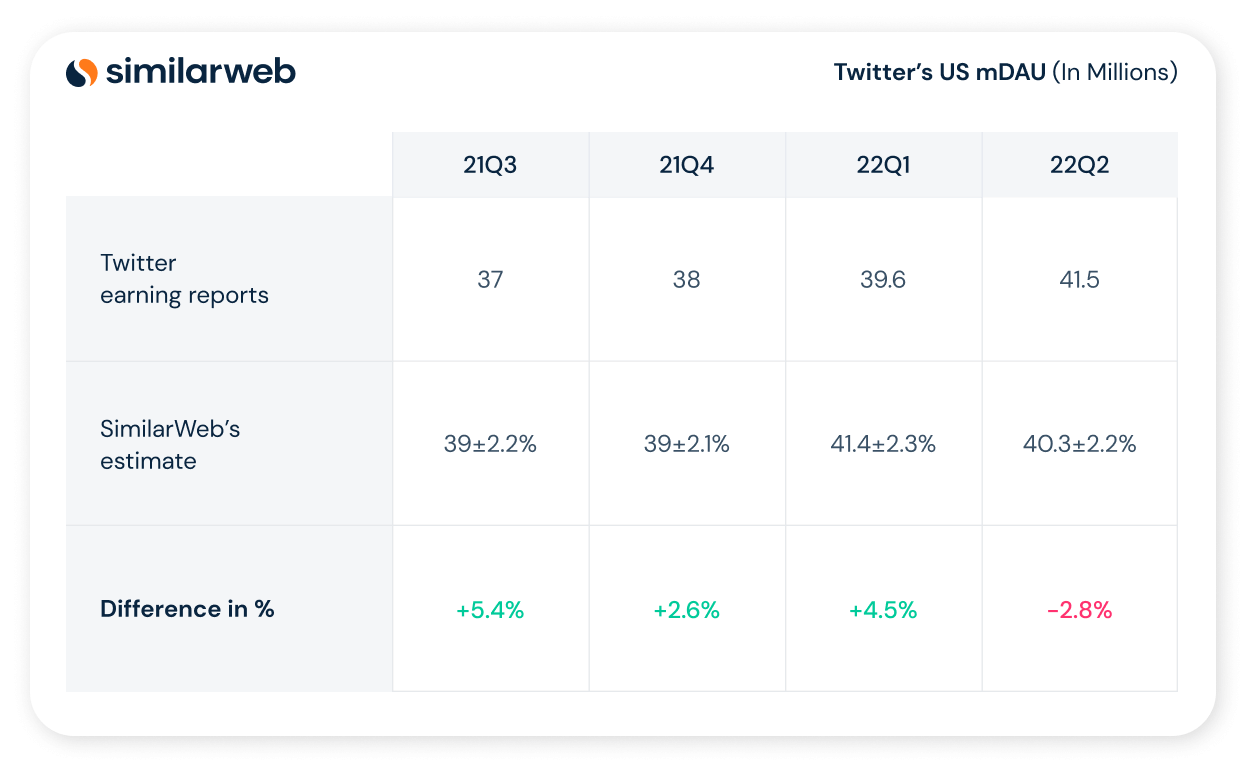
Table 1: Twitter’s US mDAU (in millions)
In Table 2 below we list our estimates for Twitter’s US unauthenticated mDAU which are not reported by Twitter and are not estimated by any of the previous work. We believe that from a monetization perspective these estimates are very relevant since users that do not have a Twitter account or users that consume Twitter content without logging into their account can obviously be shown ads.
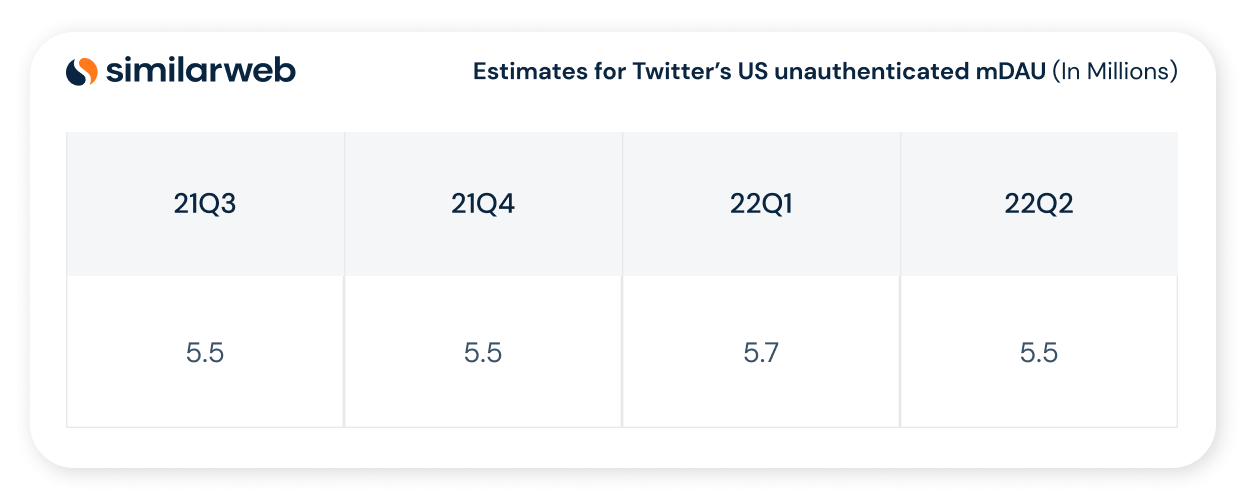
Table 2: Estimates for Twitter’s US unauthenticated mDAU (in millions)
In Figure 1 below, we provide our estimates for Twitter’s US user distribution of authenticated and unauthenticated users. We further segment the authenticated Twitter users into active and passive users, where an active user is defined as a user who created content at least once within the relevant time period. Twitter content is a new tweet or a reply to an existing tweet. Observe that there is a significant number of unauthenticated users accessing Twitter content though mobile devices, but not using the app.
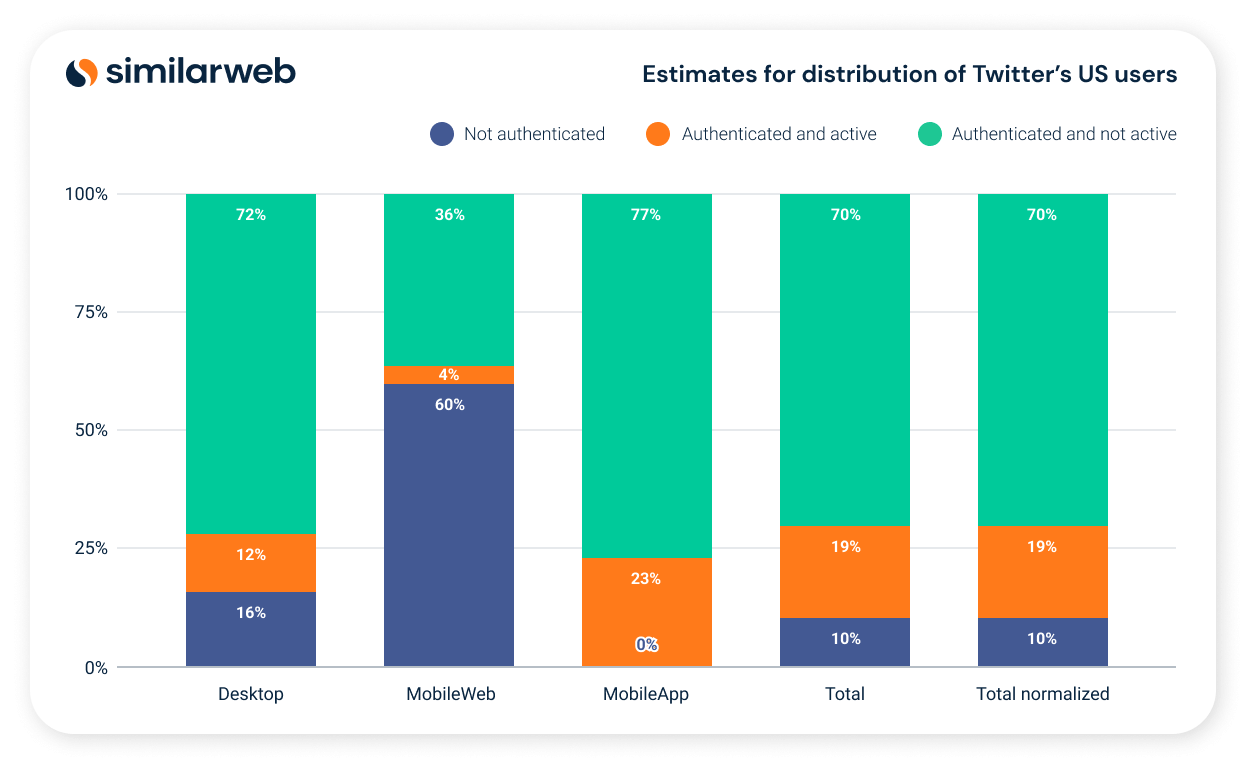
Figure 1: Estimates for distribution of Twitter’s US users: active, passive and unauthenticated over the period 21Q3-22Q2.
Using the activity distribution presented in Figure 1 we can see that only 19% of the real US mDAU generate content on any given day. What does this imply with regards to bot activity? Assume that the amount of daily active bots for definitions and discussions of what bots are) generating content via tweets or replies is equivalent to 5% of the real US mDAU, which according to Twitter is possible. Then this immediately implies by our analysis that at least 20.8% of the US content on Twitter is generated by bots as depicted in Figure 2 below. This estimate correlates with SparkToro’s research , where they evaluate the fraction of active bots from the total of active Twitter accounts.
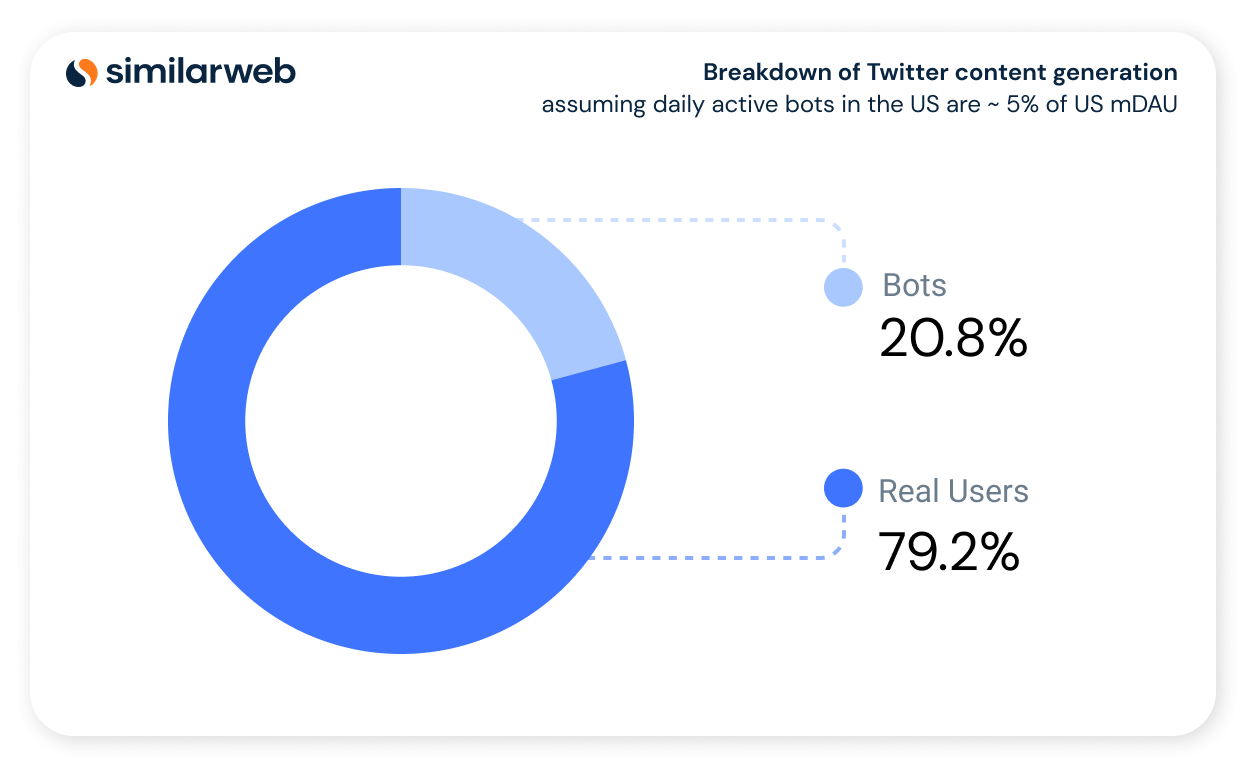
Figure 2: Breakdown of Twitter content generation assuming daily active bots in the US are ~ 5% of US mDAU
If we also consider re-tweets as content, then it can be argued that bots generate 1.57x more content than humans. This would imply the breakdown of human-bot US content generation depicted in Figure 3 below.
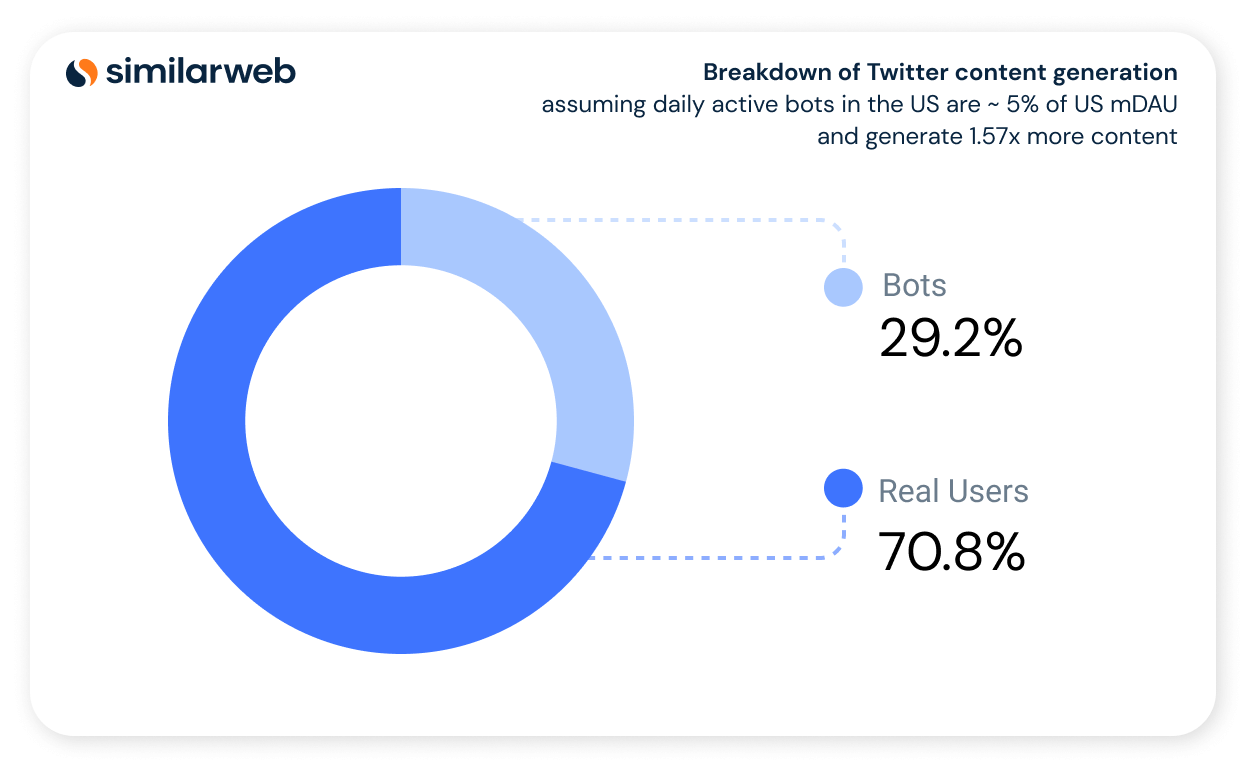
Figure 3: Breakdown of Twitter content generation assuming daily active bots in the US are ~ 5% of US mDAU and generate 1.57x more content
In Figure 4 below we show our estimate for the distribution of the content generation per active non-bot Twitter user. It is evident from the figure that only a relatively small fraction of users (~30%) generated 5 or more pieces of content within the time frame of 21Q3-22Q2 and yet are responsible for most of Twitter’s content (~70%).
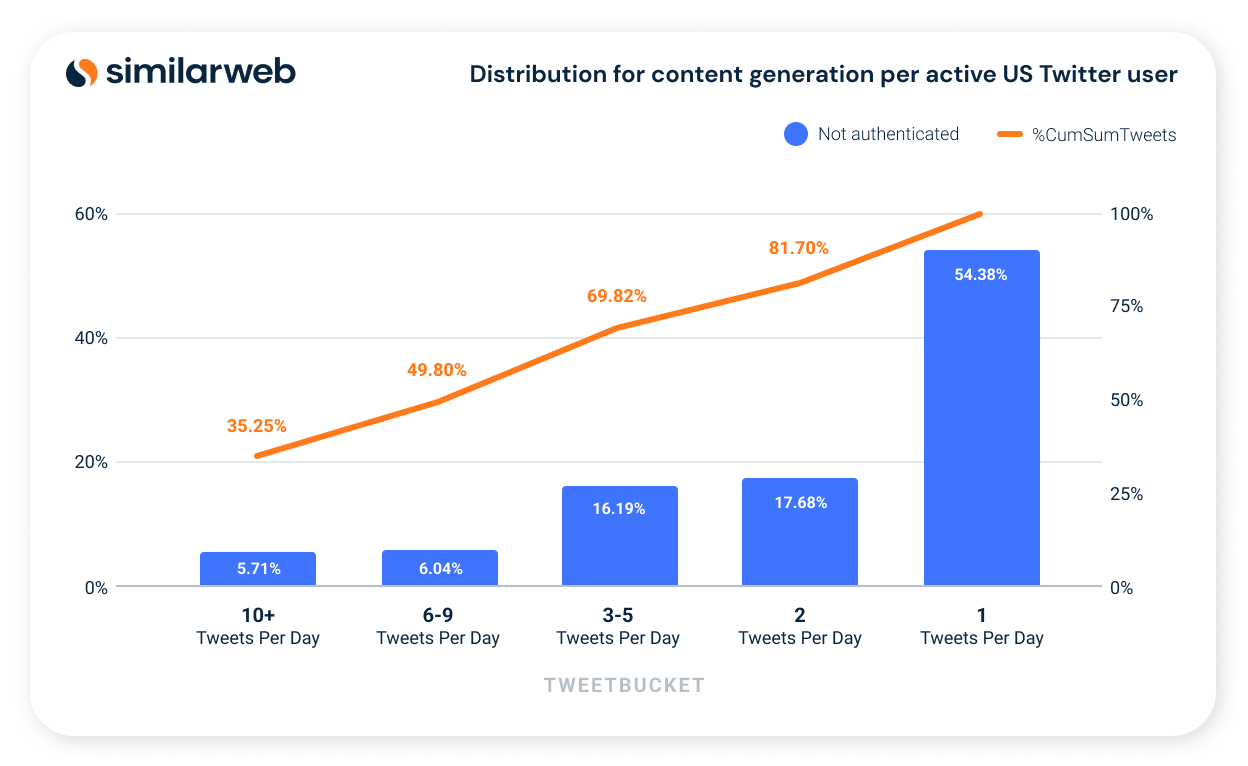
Figure 4: Estimates for distribution for content generation per active US Twitter user over the period 21Q3-22Q2.
2. Methods
In this section we review the datasets, data preparation and machine learning models we used to derive the estimates presented in the previous section
A. Datasets
Our algorithm uses the following types of datasets:
User Panels: High quality meter user panel datasets consisting of the digital activities collected on the various platforms: desktop, mobile web and mobile apps. The panels, by design, are ensured to have a good demographic and geographic distribution. Observe that when estimating quantities of unique users, one needs to detect overlaps in the activities over the different platforms and remove them. For example, a user accessing a Twitter account both on the desktop and through the mobile app on the same day, should be counted once as a monetized user (see subsection 2.D).
Google Analytics (GA): We use direct measurements of US traffic of websites and application usage taken from GA reports of 1972 applications, 1028 websites from desktop devices, and 1605 websites from mobile devices. In our study we only used websites and apps with a sufficiently high scale of digital engagement. This data is used as a ground truth Learning Set (LS) for our machine learning models.
Publicly available data of large digital entities: Although our learning set is quite comprehensive, it does not include many digital entities on a scale similar to that of Twitter. So as to ensure our models perform well on the large end of the digital presence scale where Twitter resides, we added additional data points from publicly available external data sources: financial reports of the associated public companies and reports from some companies on their ad usage metrics. This required additional pre-processing to convert the available data into quarterly US only mDAU data.
B. Verification of user panels
Our first step of data preparation is ensuring our datasets of panel digital activities contain only human non-bot activity. Indeed, Twitter is unique in the landscape of websites / social networks, as it has a built-in automation mechanism [8] that enables automated tweeting, retweeting, etc. We first observe that our panels’ digital activity data does not contain such API calls. We then apply the following criterias to verify the digital activities used in our study are authentic.
Using these rules, we created a model which ranks a user for daily abnormal activity with a score which ranges from 0 to 5, where 5 represents absolute confidence that the observed user is abnormal. The score was then averaged for the given time period. We found that only 0.07% of the users were detected as abnormal with a score >=1, which suggests our panels are indeed almost entirely composed of legitimate human users. We then proceeded to filter out these abnormal users.
C. Estimation of number of Twitter users for a given time frame and device
We separately estimate mDAU for a given quarter on three platforms: desktop, mobile web and apps. We also compute the percentage of overlap of users accessing through multiple devices and apply a deduplication correction procedure. (see subsection 2.D)
Assume we are now given a certain time period (such as a given quarter) and platform. From our set of sites/apps for which we have GA data, we randomly draw a training subset of size M sites/apps and leave out the rest as validation. To the validation set we also add the US mDAU data points collected from the publicly available data of some large digital entities (see subsection 2.A). Obviously, the Twitter publicly available data was not used for validation, since this is our target for inference.
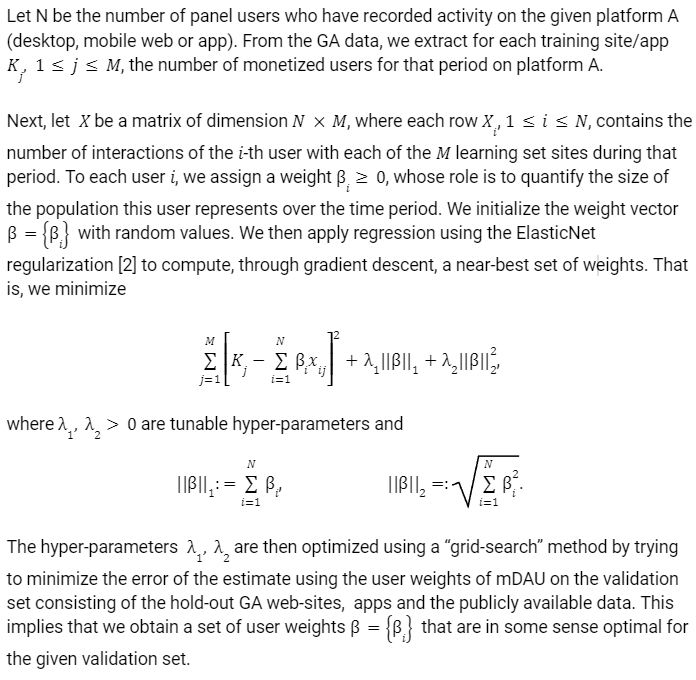
Once a set of weights is computed, the model can be used for inference of the actual total number of users for a given website or app, by summing over the panel users, multiplying their number of interactions with the website/app by their weight.
In order to create a more robust model, we perform 20 separate runs of the aforementioned process, each run with a different initialization of the user weights. We then prune out the 10 runs whose performance on the validation set is the lowest. The 10 remaining models constitute an ensemble, where during inference an average of the predicted number of users for the given website/app is taken over 10 models. In Figure 5 below we see some evidence for the statistical stability of the method, where the distributions of the user beta weights are shown for a sample ensemble consisting of 10 models. Although there is some variance in the distribution of user weights between different folds, the overall shape of the distribution remains consistent across all iterations.
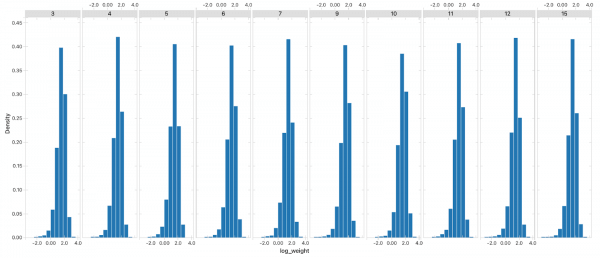
Figure 5: Distribution of the log of the beta weights for 10 models
For each different platform: desktop, mobile web and mobile app and for each of the 4 quarters: 21Q3-22Q2, we compute a separate ensemble model. In Figure 6 below we show the confidence intervals generated from the 10 models of each of the 3 ensembles, for each of the quarters 21Q3-22Q2, for the Twitter estimates. Again, we see evidence for statistical stability, since the models of each ensemble predict a similar number of users with a relatively small variance.
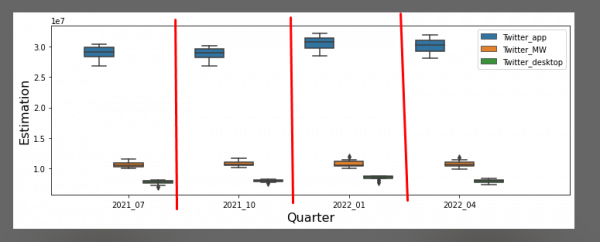
Figure 6: Confidence intervals generated from 10 models.
D. Computing platform overlaps
In subsection 2.D we described our algorithm for estimating mDAU on each separate platform. For our estimation of the total Twitter mDAU we need to account for the overlap between the different devices, since a single monetizable user may interact with Twitter on a particular day using more than one platform.
Overlap in usage between mobile web and app is readily available for us as part of our mobile device panel. To compute the overlap between desktop and the mobile platforms, we generated a unique usage signature for each desktop and mobile user: the number of sessions for each unique encrypted IP address (due to privacy & legal reasons, all IP addresses in our system are encrypted and not human readable but are still uniquely identifiable for the purpose of this analysis). We then measured the similarities between signatures for desktop and mobile users using the cosine similarity measure. We acknowledged a matched pair of desktop/mobile panel users being the same user whenever our similarity measure was above the threshold of 0.4. We further verified our threshold by sampling matched pairs and comparing their respective browsing history. Figure 7 below depicts our estimates for the distribution and percentages of overlaps of platform usage by Twitter US users during the time frame 21Q3-22Q2
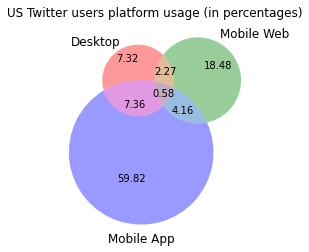
Figure 7: Estimate of distribution of usage by platform for US twitter users 21Q3-22Q2
E. Classifying Twitter authenticated and unauthenticated users
To provide estimates corresponding to Twitter’s definition of mDAU we need to classify which users on a particular day interacted with Twitter through their Twitter account, as opposed to unauthenticated users who may not have an account or users who consumed Twitter content without authenticating into their account. This analysis is superfluous for mobile app users that obviously first logged in into their Twitter account.
In order to identify authenticated twitter desktop or mobile web users, we examine their browsing history and search for specific pages that are only available to users that are logged in through their account. Pages such as HomePage, Profile page, tweet/reply actions, notifications messages and more. As the respective time period of 4 quarters is quite extensive, we believe our false negative error (i.e. authenticated users which did not visit any of these pages) to be rather small.
F. Classification of Twitter users’ activity
Our datasets allow us to identify content generation composed of tweets or replies to tweets. However, for the desktop and mobile web platform, we are unable to track a certain type of the replies. These are replies to tweets that are not registered in the URL i.e. replies that are generated after clicking on the tweet body. Thus, the amount of content generated on these platforms is possibly underestimated. Additionally, we have no direct way to uniquely identify a tweet being sent. In practice, we track activity on the tweet compose page using intervals of 10 minutes and if there is any activity during one of these time frames, we acknowledge them as the generation of a single tweet. if a user has generated more than one tweet within that time period, we are underestimating their activity.
G. Estimating the average number of active accounts per user
Recall that Twitter’s definition of mDAU is such that if a single person interacts with Twitter on a particular day through 2 Twitter accounts, then that user will be counted twice in Twitter’s mDAU. Our analysis so far provided us with an estimate for daily unique authenticated users. To correct our estimates to correspond to Twitter’s definition of mDAU, we compute a factor relating to the average number of Twitter accounts through which a unique user authenticates.
To obtain this factor we sent a questionnaire to our panel, asking the users to provide further information about their activities on Twitter. The survey included 1200 panel users which we verified as Twitter users using our data. In order to increase the survey’s credibility, we asked additional Twitter activity-related questions which we were able to verify with the respective user’s browsing or app usage data. We found the fidelity of answers from survey participants to be very high.
We found that on average, a Twitter user from our panel uses on a daily basis 1.13 Twitter accounts.
Finally, to obtain the US mDAU estimates in Table 1, we applied the platform overlap considerations of 2.D to the platform-specific estimates of 2.C and then the factor 1.13 associated with the average number of accounts for a US user. The confidence intervals for our estimates are computed accordingly: we use the platform-specific confidence intervals of Figure 6, apply a weighted average based on the platform overlaps and multiply by the factor 1.13.
To learn more about the data behind this article and what Similarweb has to offer, visit https://www.similarweb.com/.


Sign up to receive our stories in your inbox.
Data is changing the speed of business. Investors, Corporations, and Governments are buying new, differentiated data to gain visibility make better decisions. Don't fall behind. Let us help.


Sign up to receive our stories in your inbox.
Data is changing the speed of business. Investors, Corporations, and Governments are buying new, differentiated data to gain visibility make better decisions. Don't fall behind. Let us help.