Introduction
Welcome to the October 2022 Apartment List National Rent Report. Our national index fell by 0.2 percent over the course of September, marking the first time this year that the national median rent has declined month-over-month. The timing of this slight dip in rents is consistent with a seasonal trend that was typical in pre-pandemic years. Assuming that trend continues, it is likely that rents will continue falling in the coming months as we enter the winter slow season for the rental market.
Despite the monthly decline, rent growth over the course of this year continues to outpace the pre-pandemic trend, even as it has slowed significantly from last year’s peaks. So far in 2022 rents are up by a total of 6.8 percent, compared to 17.1 percent at this point in 2021. Year-over-year growth is continuing to decelerate, and now stands at 7.5 percent, down from a peak of nearly 18 percent at the beginning of the year.
This cooldown in rent growth is being mirrored by continued easing on the supply side of the market. Our vacancy index now stands at 5.2 percent, after nearly a year of gradual increases from a low of 4.1 percent last fall. That said, today’s vacancy rate remains well below the pre-pandemic norm, and spiking mortgage rates that continue sidelining first-time homebuyers could contribute additional tightness to the rental market.
The recent slowdown has been geographically widespread. Rents decreased this month in 69 of the nation’s 100 largest cities in September, and 8 additional cities experienced flat month-over-month rent growth. And in 93 of the top 100 cities, rent growth since January of this year has been slower than it was over the same months of 2021. That said, a number of markets are still seeing rents trend upward quickly, including the New York City, San Diego, Miami, and Orlando metros, all of which have seen rents rise by 12 percent or more in the past year.
Rents nationally fall by 0.2% month-over-month; rents still up 7.6% year-over-year
The national median rent increased by a record-setting 17.6 percent over the course of 2021. This rapid growth in rent prices is a key contributor to overall inflation, which is currently rising at its fastest pace in 40 years.1 With inflation top-of-mind for policymakers and everyday Americans alike, our rent index is particularly relevant, since movements in market rents lead movements in average rents paid. As a result, our index can signal what is likely ahead for the housing component of the official inflation estimates produced by the Bureau of Labor Statistics. Thankfully for the country’s renters, our national rent index has shown month-over-month growth decelerating quickly in recent months. In fact, this month, our index actually registered a slight monthly decline for the first time this year.
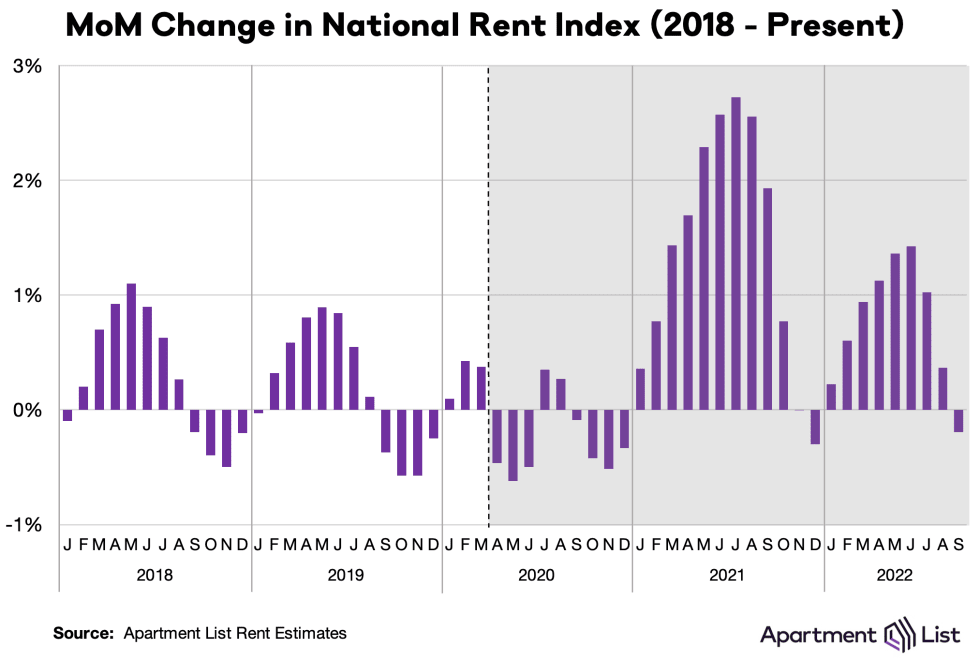
We estimate that the national median rent fell by 0.2 percent month-over-month in September, the first time that rents have declined since December 2021. A modest decline in rents at this time of year is consistent with the normal seasonal trend that we typically see in our rent index. But given how atypical the market has been for the past two and a half years, this month’s return to pre-pandemic seasonality represents a notable shift. Last September, rents spiked by 1.9 percent month-over-month, as the market continued on an unprecedented stretch of record-setting rent growth which disrupted seasonal trends. In contrast, from 2017 to 2019, rents fell by an average of 0.3 percent in September, right in line with this month’s decline. Assuming that this year’s trajectory continues to follow normal seasonal trends, we can expect to see additional modest declines in the months ahead, as rental market activity slows during the winter months.
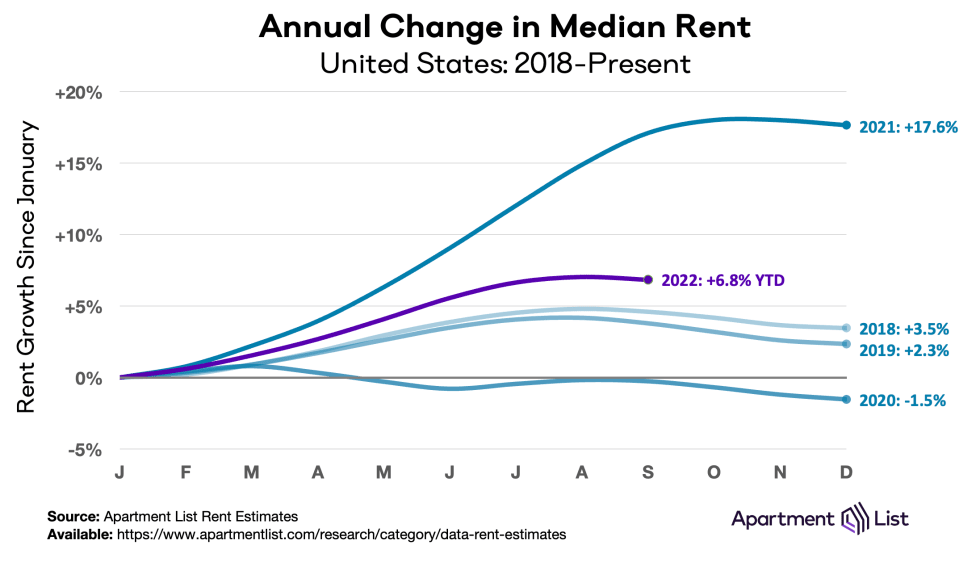
It should still be noted that even as rent growth in 2022 has cooled substantially from last summer’s peaks, rents are continuing to rise faster than they did in pre-pandemic years. In the first nine months of this year our national rent index has increased by a total of 6.8 percent, which is well less than half the 17.1 percent increase that took place during the same months of last year. That said, this year’s pace remains notably faster than the years prior to 2021. For comparison, rent growth from January to September totalled 4.6 percent in 2018, 3.8 percent in 2019, and -0.3 percent in 2020. Even if rents continue their seasonal dip for the remainder of the year, 2022 will still likely end up being the second fastest year of rent growth in our data, which goes back to 2017.
As rent growth slows, vacancies ease
As we’ve explored in detail, much of the 2021 rent boom was attributable to a tight market in which more households were competing for fewer vacant units. Our vacancy index spiked above 7 percent in the early months of the pandemic in 2020, as many Americans consolidated households and moved in with family amid the uncertainty and economic disruption of the pandemic’s onset. After that, however, rapid household formation drove a sharp tightening of the vacancy rate, which eventually fell to a low of 4.1 percent last fall.
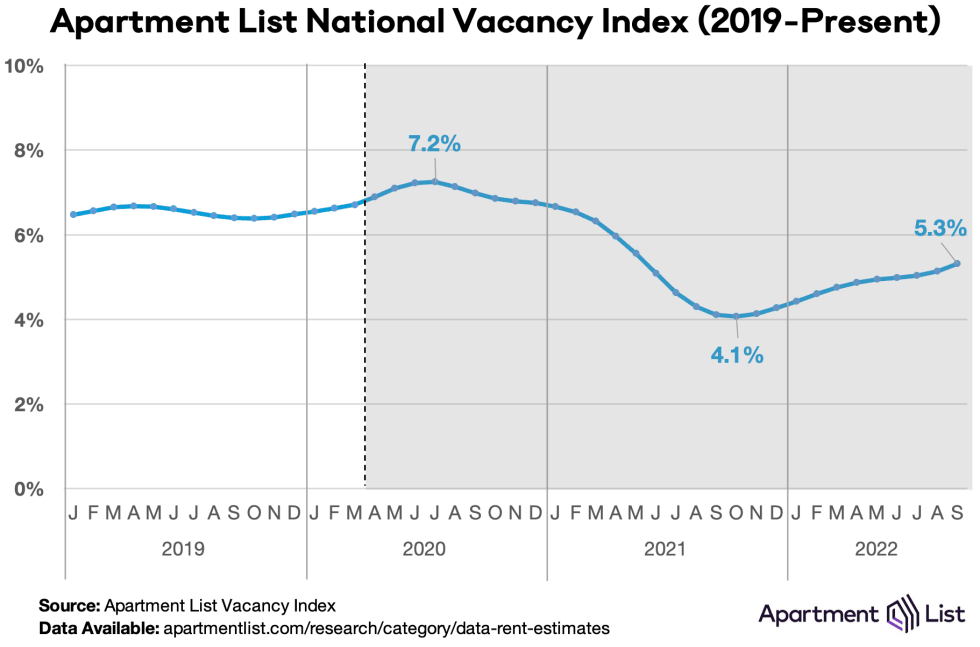
But after bottoming out at 4.1 percent in October 2021, our national vacancy index has been on a trend of gradual easing. This month it rose to 5.3 percent and has shown nearly one full year of continued, albeit slow, improvements. It’s worth noting, though, that rental vacancies are intertwined with housing availability in the for-sale market, and it’s possible that spiking mortgage rates are dampening the rebound in the rental vacancy rate. High interest rates can sideline potential first-time homebuyers and keep them in the rental market longer. Two years of sustained rent inflation may also be incentivizing renters to stay put and renew existing leases rather than looking for new ones.
Vacancy trends are highly localized, and they played a major role in determining how quickly rent inflation affected cities throughout the pandemic. To explore the topic in greater detail, monthly vacancy data are now available for download for hundreds of cities, metros, and states, and can be easily linked to our existing rent estimates using Federal Information Processing System (FIPS) codes.
Rents fell month-over-month in 69 of 100 largest cities
The chart below visualizes monthly rent changes in each of the nation’s 100 largest cities from January 2019 to present. The color in each cell represents the extent to which prices went up (red) or down (blue) in a given city in a given month. In 2020, we can see that rents fell sharply in many of the nation’s largest and most expensive cities, while smaller and more affordable ones picked up steam, leading to some convergence in prices. Meanwhile, the dark red band in 2021 depicts last year’s rent heatwave, which peaked in July and August 2021 when all 100 cities in this chart saw prices go up. The rightmost columns show that virtually across the board, rent growth this year has remained positive but has cooled significantly from last year’s pace.
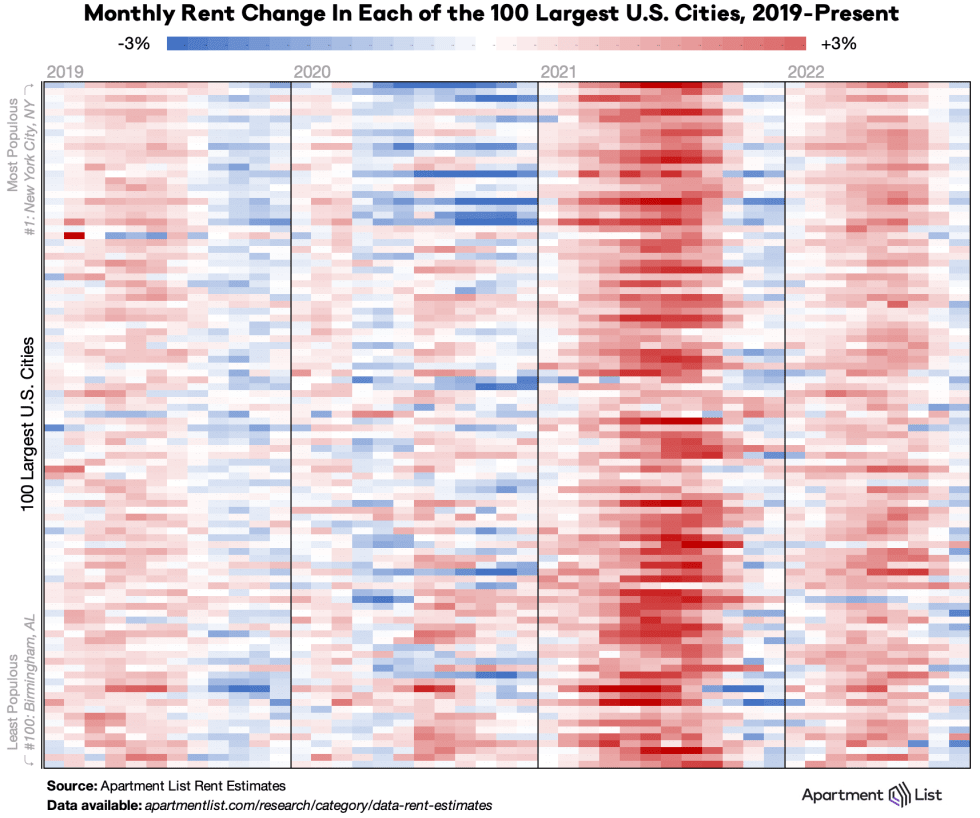
This month, we can see that the dip in our national index was driven by a geographically broad-based cooldown. Rents decreased this month in 69 of the nation’s 100 largest cities, while an additional 8 cities saw rents hold steady. And nearly across the board, local rent growth has cooled down since last year – just seven of the top 100 cities have seen year-to-date rent growth in 2022 exceeding the 2021 pace.
The urban core of the New York City region has been experiencing surging rental demand this year. Among large cities, Jersey City currently has the nation’s fastest city-level rent growth, with prices up by 21.9 percent over the past twelve months, more than tripling the national average. Meanwhile, NYC-proper ranks number twelve with a year-over-year rent increase of 12.1 percent. In addition to Jersey City, there are five other large cities spread throughout the country where year-over-year rent growth is currently exceeding 15%: Lexington, KY (17.2%); Chula Vista, CA (+17.2 percent); Anchorage, AK (+16.5 percent); Madison, WI (15.8%); and Miami, FL (+15.6 percent).
Pricey coastal metros seeing prices rise again
Major markets throughout the Sun Belt have experienced virtually-uninterrupted rent growth since the start of the pandemic, but over the past six months, the fastest growth has been occurring in two types of cities: pricey coastal markets as well as a handful of smaller and more affordable metros in the Great Lakes region. The following table shows the ten metropolitan areas that have experienced the fastest rent growth over the past six months, over the past year, and since the pandemic started in March 2020:
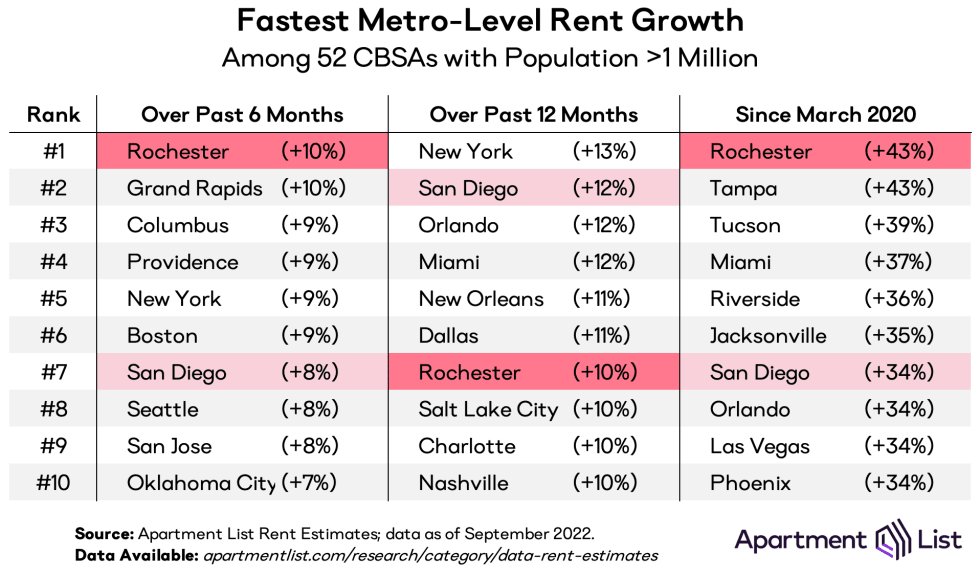
The six-month column shows that some of the nation’s most expensive coastal markets – which had seen sharp declines at the start of the pandemic – are now heating up again. The New York, Boston, San Diego, Seattle, and San Jose metros all rank among the top ten here, and are continuing strong rebounds. However, the fast recent rent growth has been occurring in a handful of mid-size metros in the Great Lakes region – Rochester, NY; Grand Rapids, MI, and Columbus, OH take the top three spots for six-month rent growth. Rochester and Providence are the only markets that appear in all three columns of the table. As hybrid remote work continues to take hold, these more-affordable mid-sized markets may emerge as attractive alternatives for those who only need to commute occasionally.
The rightmost column shows that most of the markets that have experienced the fastest growth over the course of the pandemic as a whole are primarily located in the Sun Belt, with California, Arizona, Nevada, and Florida accounting for nine of the top ten. That said, the Rochester NY metro ranks number one for pandemic-era rent growth, with rents there up by a staggering 43 percent since March 2020. Rochester has recently taken the top spot from Tampa, where growth has cooled down in recent months. Once the country’s epicenter for rent inflation, prices in Tampa are up just 5.2 percent since January, slightly trailing the national average.
Rents in the San Francisco metro dip back below March 2020 level
The San Francisco metro experienced the sharpest rent declines in the first year of the pandemic, and has been the slowest market to recover in the time since then. It now looks as if this sluggishness could be set to continue with a seasonal slowdown. Metro-wide, Bay Area rents fell by 0.7 percent in September, more than triple the national decline. This dip has brought the metro’s median rent back slightly below its March 2020 level, after having just surpassed that level last month. And at the city-level, some markets in the San Francisco Bay Area are recovering even more slowly, particularly in the more densely populated core cities. In Oakland, rents are still down 11 percent compared to March 2020 – the biggest discount among the 100 largest cities – while in San Francisco proper, rents are still down 9 percent.
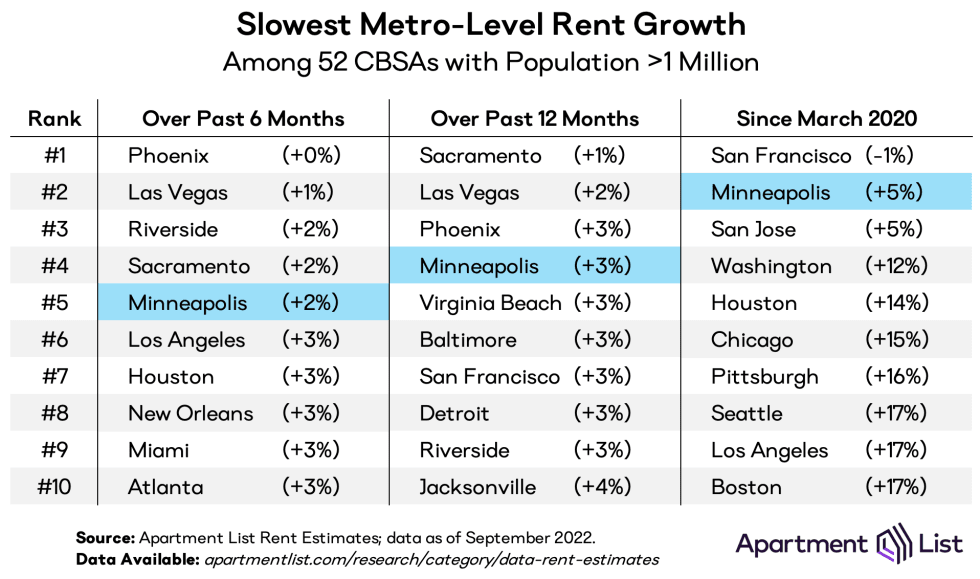
After San Francisco the right-most column of the table is largely populated by other pricey coastal metros, including San Jose; Washington, D.C.; Seattle; Los Angeles; and Boston. Even as many of these markets have been heating up recently, they have still had among the most modest rent growth over the course of the pandemic as a whole. That said, just three metros have experienced rent growth of less than 10 percent over the past two and a half years.
Notably, the table above also shows how some of the markets that had been booming fastest are now showing signs of cooling off. For example, the Phoenix metro has experienced no rent growth at all over the past six months, despite ranking in the top ten for fastest growth since March 2020. Similarly, the Las Vegas, and Riverside metros rank among the top ten for fastest pandemic-era rent growth, but are also rounding out the top three for slowest rent growth over the past six months. After booming consistently for two years, these markets are finally beginning to plateau. Minneapolis is the only metro to appear in all three columns of the table above, with consistently sluggish growth throughout the pandemic.
Conclusion
With a 0.2 percent decline in September, rent growth is following its typical seasonal trajectory, even as growth continues to pace ahead of pre-pandemic trends. In the coming fall and winter months, we expect rental activity will continue to slow and we are likely to see continued modest price decreases to close out the year. That said, we’re still on pace to end 2022 with full year rent growth exceeding any year from 2017 to 2020. And while the rental market is showing early signs of easing, the national vacancy index of 5.2 percent remains well below the pre-pandemic norm, indicating that there is still steady pressure on the rental market.
To learn more about the data behind this article and what Apartment List has to offer, visit https://www.apartmentlist.com/.


Sign up to receive our stories in your inbox.
Data is changing the speed of business. Investors, Corporations, and Governments are buying new, differentiated data to gain visibility make better decisions. Don't fall behind. Let us help.


Sign up to receive our stories in your inbox.
Data is changing the speed of business. Investors, Corporations, and Governments are buying new, differentiated data to gain visibility make better decisions. Don't fall behind. Let us help.