Source: https://www.corelogic.com/intelligence/average-total-down-payment-reached-an-all-time-high-in-2022/
Average Total Down Payment Reached an All-Time High in 2022
Year-over-year rise in average down payment size was highest for middle-tier homes
Quick Takes:
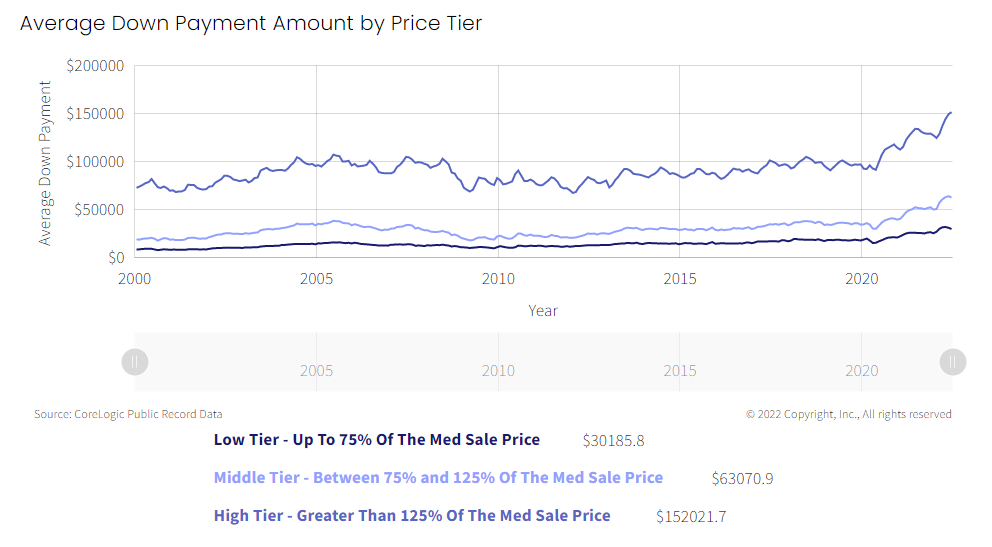
The average sums that buyers are parting with for a down payment are at an all-time high for all homes purchased in the United States. After falling during the housing crisis of the Great Recession (2008-2009), the average down payment amount has steadily increased. However, since the onset of the pandemic in early 2020, the average down payment sum surged, reaching a record high in May 2022.
Home prices play a significant part in the size of down payments, and with increases in home prices over the last few years, average down payments have followed suit.
Figure 1 shows that the average down payment amount has increased for all sales price tiers, according to CoreLogic public records data. In June, the average down payment amount for low-tier homes (those priced at less than 75% of the median sales price) was about $30,186, up from $26,314 for the same month in 2021.
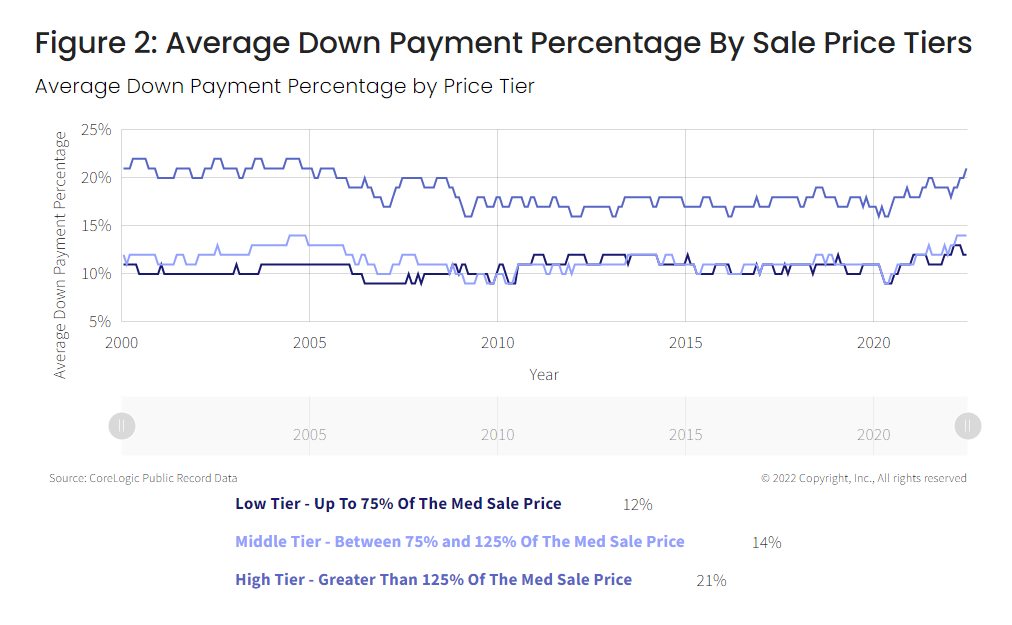
Similarly, Figure 2 shows the average down payment percentage by sales price tiers. This June, the average down payment percentage for low-tier homes was about 12% of the sales price.
The average down payment amount for middle-tier homes (those priced between 75% and 125% of the median sales price) was $63,071 in June, up from $52,862 for the same month in the previous year. The average down payment percentage for middle-tier homes was about 14% of the home sales price in June.
Similarly, the average down payment for high-tier homes (those priced at more than 125% of the median sales price) was $152,022 in June, up from $134,535 in the same period of 2021. The average down payment percentage for high-tier homes was about 21% in June. Mortgages for high-tier homes are mostly high-balance loans or jumbo loans, which generally require a larger down payment.
Year-over-year rises in average down payment amounts were highest for middle-tier homes (19%), followed by low-tier homes (15%). In contrast, the year-over-year increase was just 13% for high-tier homes.
Figure 1: Average Down Payment Amount by Sale Price Tiers

Figure 2: Average Down Payment Percentage By Sale Price Tiers

To learn more about the data behind this article and what CoreLogic has to offer, visit https://www.corelogic.com/.


Sign up to receive our stories in your inbox.
Data is changing the speed of business. Investors, Corporations, and Governments are buying new, differentiated data to gain visibility make better decisions. Don't fall behind. Let us help.


Sign up to receive our stories in your inbox.
Data is changing the speed of business. Investors, Corporations, and Governments are buying new, differentiated data to gain visibility make better decisions. Don't fall behind. Let us help.


