
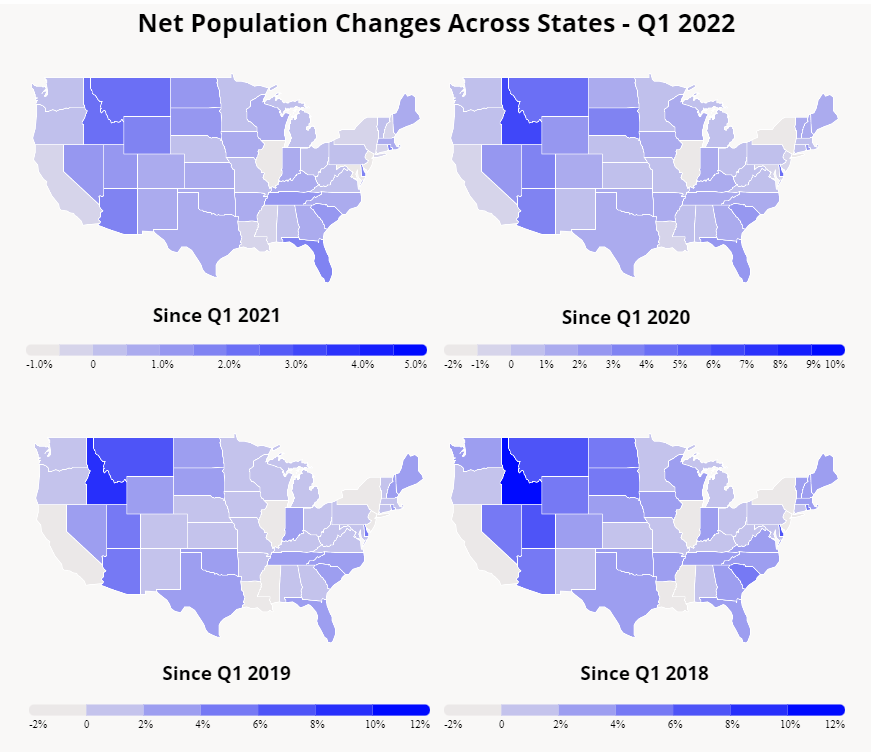
As noted in our Domestic Migration Trends white paper, COVID strengthened, rather than upended, existing migration patterns. Many cities and states that were already attracting new residents before the pandemic saw their inbound migration pick up pace, while some areas where the population was stagnant or declining before COVID saw these negative trends accelerate as well.
While some Americans did move in search of open spaces during the lockdowns or took advantage of the shift towards remote and hybrid work to leave urban areas, many more simply followed the same rationales for relocating that were already driving migration in 2019. So, what factors drove migration choices before COVID and continue to influence migration during the pandemic?
Stronger Post-COVID Correlation Between Migration and Affordability
To find out what drove migration decisions, we analyzed migration data from 2019 and 2022 in relation to certain local demographic and economic metrics. We conducted our analysis by comparing pre- and post-COVID migration trends in over 60 metropolitan areas to static city-level demographic and economic data from ULI and PWC’s Emerging Trends in Real Estate 2022 Report. This allowed us to identify demographic, economic, and zoning patterns that correlated with inbound or outbound migration.
We found that not only did migration trends intensify over the pandemic, certain correlations between migration trends and other local characteristics already in place pre-COVID deepened as well. The data shows that a high share of renter-occupied housing tended to correlate with increased negative migration, while a low share of renter-occupied housing tended to correlate with increased positive migration. Inbound migration also correlated with an older population, lower cost of doing business, and less multi-family housing and more single-family housing as a share of total new construction.
And when comparing migration between January 2018 through December 2019 to January 2020 through July 2022, the magnitude of these trends has only intensified.
Each set of charts below showcases the correlation between certain metrics in major metro areas and the net migration to that metro area pre- and post-COVID. The metrics (share of renter-occupied households, share of single-family housing out of total new construction, etc.) are held constant in both charts, while the migration trends change to reflect pre- and post-COVID migration patterns. This allowed us to isolate the change in correlation between certain key metrics and migration. Negative migration trends correspond to more outbound migration, while positive migration trends correspond to more inbound migration.
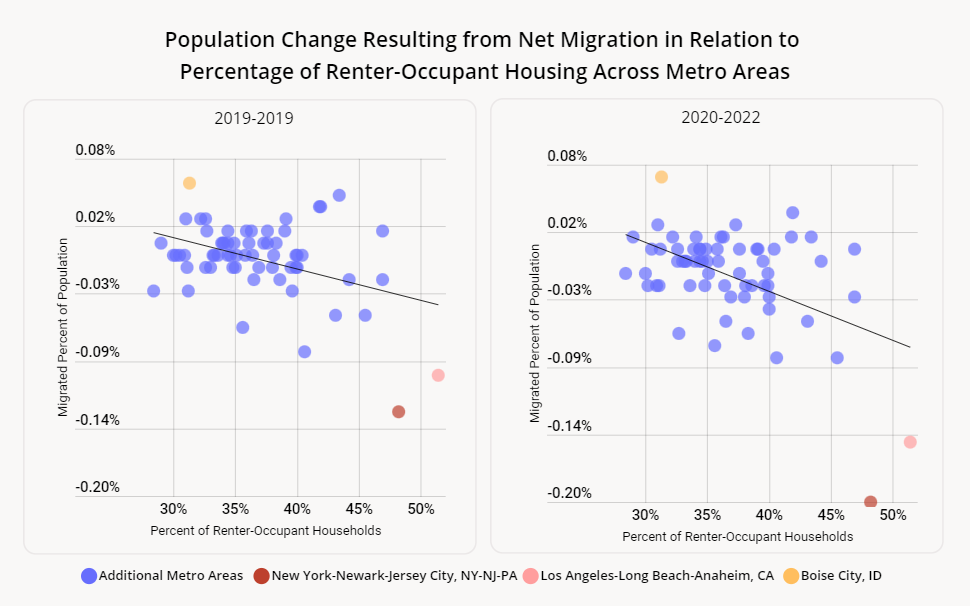
More Renters Correlated with Accelerated Negative Net Migration
This chart shows the correlation between the share of renter-occupied households in a given city with change in that city’s population due to migration in 2018-2019 and in 2020-2022. The data reveals that cities where a smaller share of the population owns its home see more outbound migration – and these cities saw an even larger exodus over the pandemic. The increase in outbound migration from these cities suggests that many of those who relocated over the pandemic were renters, who likely had an easier time giving up their lease than homeowners who needed to sell their home in order to move away.
Before COVID, urban centers with a higher share of renter-occupied households (as opposed to owner-occupied households) such as the greater New York City (48.2%) and Los Angeles (51.4%) metro areas were already experiencing higher than average outbound migration (-0.13% and -0.10%, respectively). Meanwhile, cities with low shares of renter-occupied households such as Boise, Idaho – where less than a third of housing is renter-occupied – enjoyed positive migration growth of 0.06% pre-COVID.
Post-COVID, the net migration out of New York and Los Angeles dropped to 0.20% and 0.15%, respectively, while the net migration into Boise increased to 0.7% – an acceleration of the trends already in place in 2019. Other cities that lie more towards the middle of the spectrum also saw their net migration increase or decrease in correlation with their share of renter-occupied households.
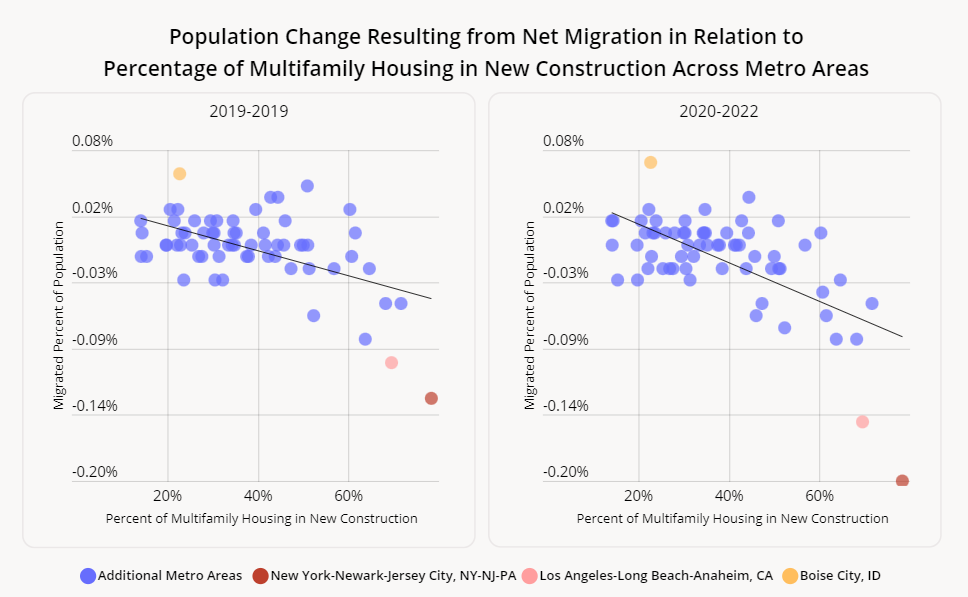
Multifamily Housing Correlated with Accelerated Negative Net Migration, Single Family Housing Correlated with Accelerated Positive Net Migration
The type of residential real estate built in a metro area also correlates with migration patterns in that metro area. When multifamily housing units form a larger share of the total new construction across a metro area, net migration tends to be negative – and, like with the other correlations identified here, this relationship has gotten stronger post-COVID.
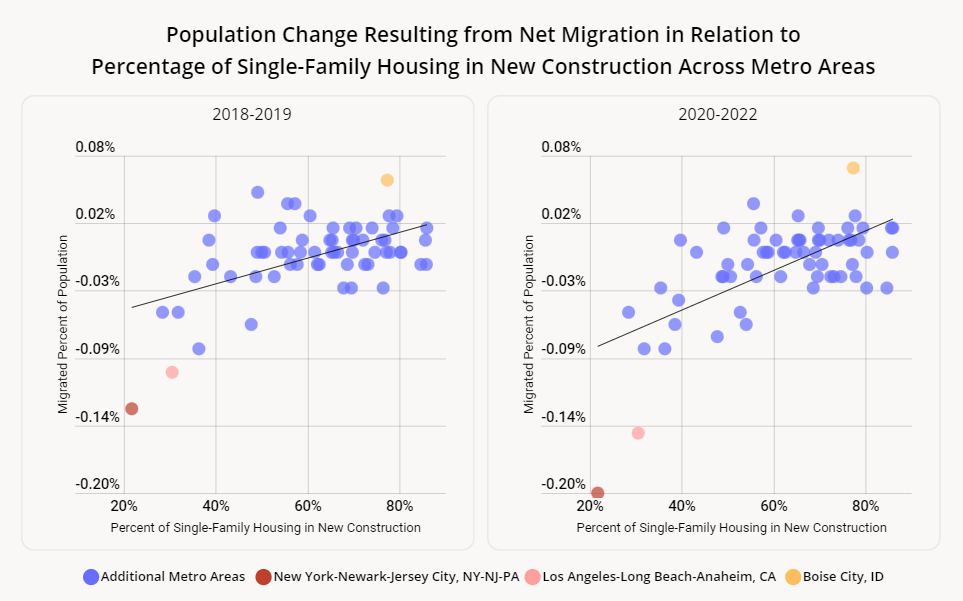
Conversely, when single-family homes make up a larger share of new construction in a metro area, net migration into the area tends to rise. Like with the other correlations identified here, the correlation between inbound migration and share of single-family new homes has also intensified recently.
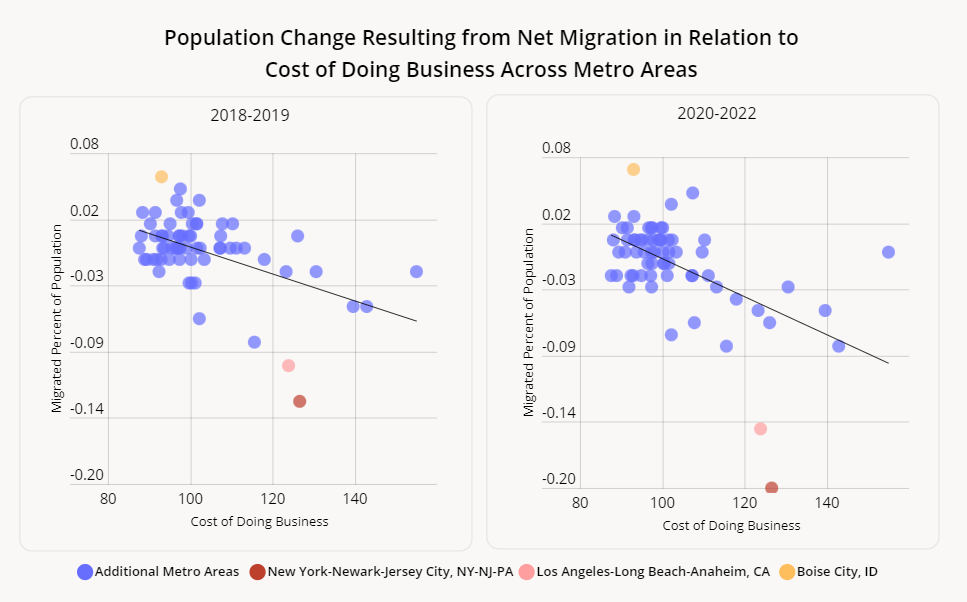
Higher Cost of Doing Business Correlated With Accelerated Negative Net Migration
The Cost of Doing Business Index measures indicators such as average annual wages and corporate income tax in various metro areas throughout the United States. The average cost of doing business nationwide is assigned a score of 100, and each metro area is assigned a number relative to this national average. A score over or under 100 represents a higher- or lower-than-average cost of doing business, respectively.
Comparing pre- and post-COVID migration data with the cost of doing business in major metro areas indicates that higher inbound migration is correlated with a lower cost of doing business, and vice versa. This relationship has also strengthened post-COVID.
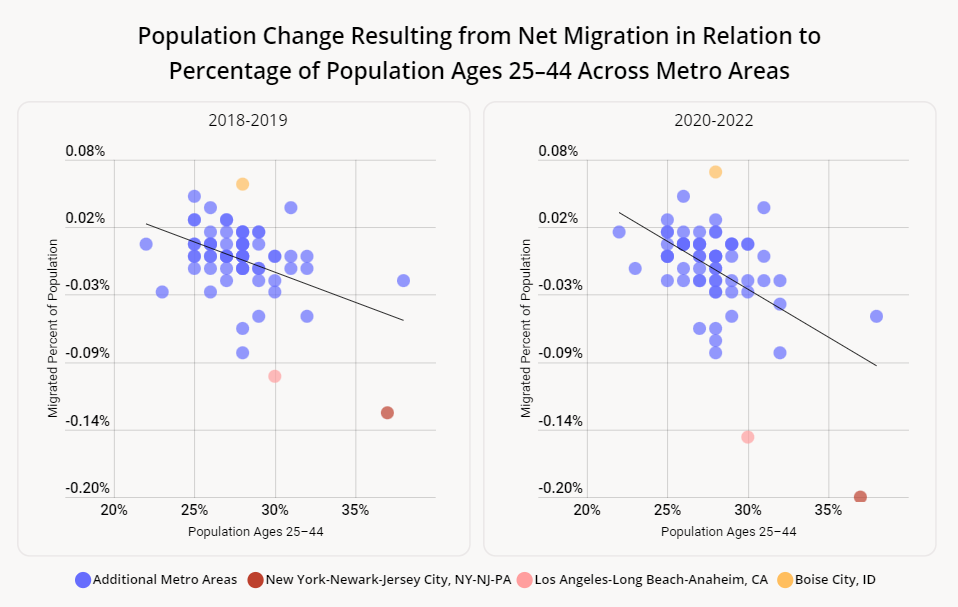
Younger Populations Correlated with Accelerated Negative Net Migration
Migration trends also seem to be correlated with a metro area’s population age. Specifically, metro areas with a higher share of young residents (aged 25-44) experienced more outbound migration, while cities with fewer young residents saw more net population growth as a result of migration. Like the correlation with renter-occupied housing, the correlation between young populations and net negative migration could already be observed pre-COVID – but became significantly more pronounced post-pandemic.
In the New York metro area, for example, 37% of the population is aged 25-44 – and the city also saw its negative migration trends accelerate over the pandemic. Meanwhile, the Boise, ID metro area – where only 28% of the population is between the ages of 25 and 44 – saw its positive migration accelerate.
Policy Makers and Business Stakeholders Can Impact Local Migration Patterns
The trends identified here may mean that some people, as they age, are moving out of “younger” cities and choosing to relocate in areas where they can more easily settle down, buy a house, and engage in more grown-up-oriented recreational activities. And while the interactions between zoning decisions, demographic indicators, economic characteristics, and local migration trends were already in place before the pandemic, COVID seems to have significantly strengthened many of these correlations.
This means that policy makers and business stakeholders may be able to impact migration trends in or out of their area. Local officials who want to attract inbound migration can zone more single-family homes, implement business-friendly policies, develop family and adult-friendly recreational venues, and encourage home ownership.
To learn more about the data behind this article and what Placer has to offer, visit https://www.placer.ai/.


Sign up to receive our stories in your inbox.
Data is changing the speed of business. Investors, Corporations, and Governments are buying new, differentiated data to gain visibility make better decisions. Don't fall behind. Let us help.


Sign up to receive our stories in your inbox.
Data is changing the speed of business. Investors, Corporations, and Governments are buying new, differentiated data to gain visibility make better decisions. Don't fall behind. Let us help.