In second quarter 2020 the full impact of the COVID pandemic on the ad marketplace was felt globally. According to Standard Media Index (SMI), second quarter ad spend dropped by an average of -37.1% across five major Anglo markets, the United States, Canada, United Kingdom, Australia and New Zealand, year-over-year. SMI reports ad spend declines had continued and even accelerated throughout second quarter after the pandemic first hit in mid-March. There are, fortunately, indications of a partial recovery in the ad marketplace within third quarter.
Digital Media Drives Spend
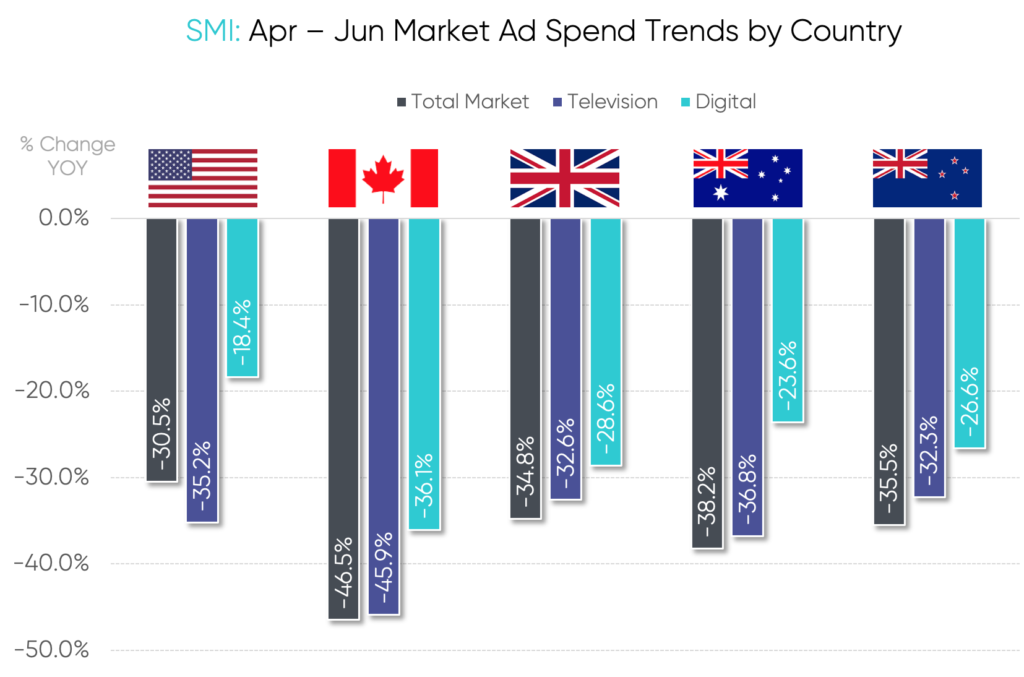
In second quarter, the ad spend losses were consistent across all five markets reporting double percentage declines in total market, digital and television. Looking at individual markets, ad spend in Canada reported the sharpest decline at -46.5%, followed by Australia at -38.2%, New Zealand at -35.5%, the U.K. at -34.8% and the U.S. had the lowest fall-off at -30.5%.

Digital: Another consistent trend seen across all markets was ad spend loss in digital media was lower than both total market and television. Collectively, there was a significant decline of digital media ad spend of -26.6%. Canada had the steepest drop-off at -36.1%, while the U.S. had a more moderate loss of -18.4%. The declines across the other Anglo markets were in the range of -23.6% (Australia) to -28.6% (U.K.).
Television: In total, ad spend for television dropped by -36.5%. Once again, Canada experienced the sharpest falloff at -45.9%. New Zealand had the lowest decline at -32.3%, followed closely by the U.K. at -32.6%. The U.S. was the only market in which the steep decline in TV ad revenue (-35.2%) was larger than the total market decline. Additionally, in a first for the U.S. ad market, during second quarter, advertisers allocated more ad dollars to digital media than traditional (television) media.
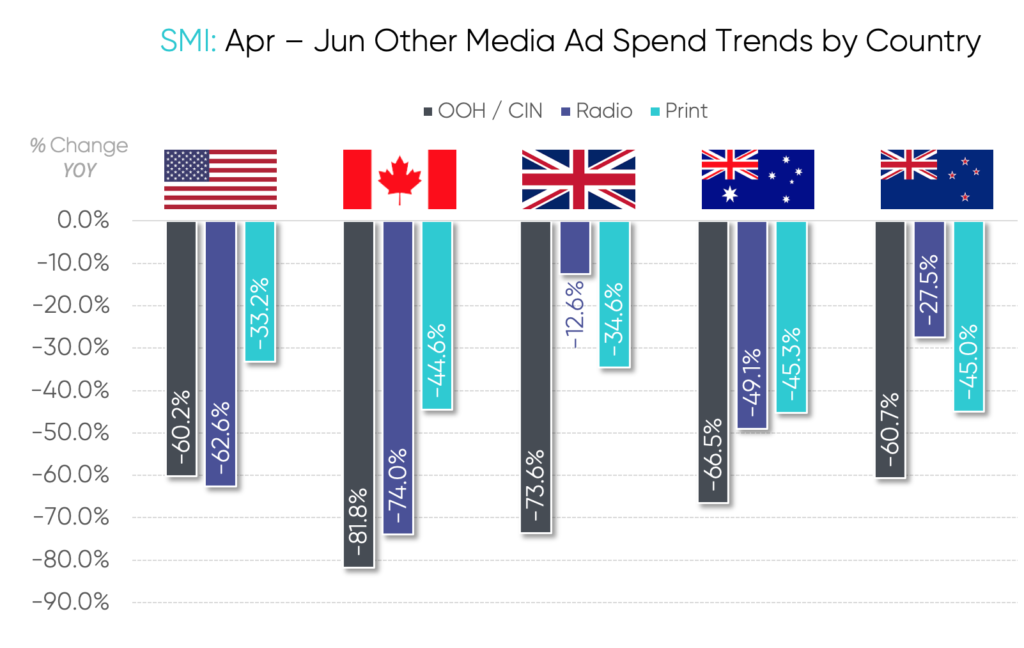
Other Media: When compared to other ad supported media the losses in digital and television were milder. The ad revenue losses for other media (outdoor, radio, press and magazines) saw the steepest decline, dropping by an aggregate -57.1% in second quarter.

Travel, Entertainment and Clothing & Apparel Product Categories Continue to Struggle
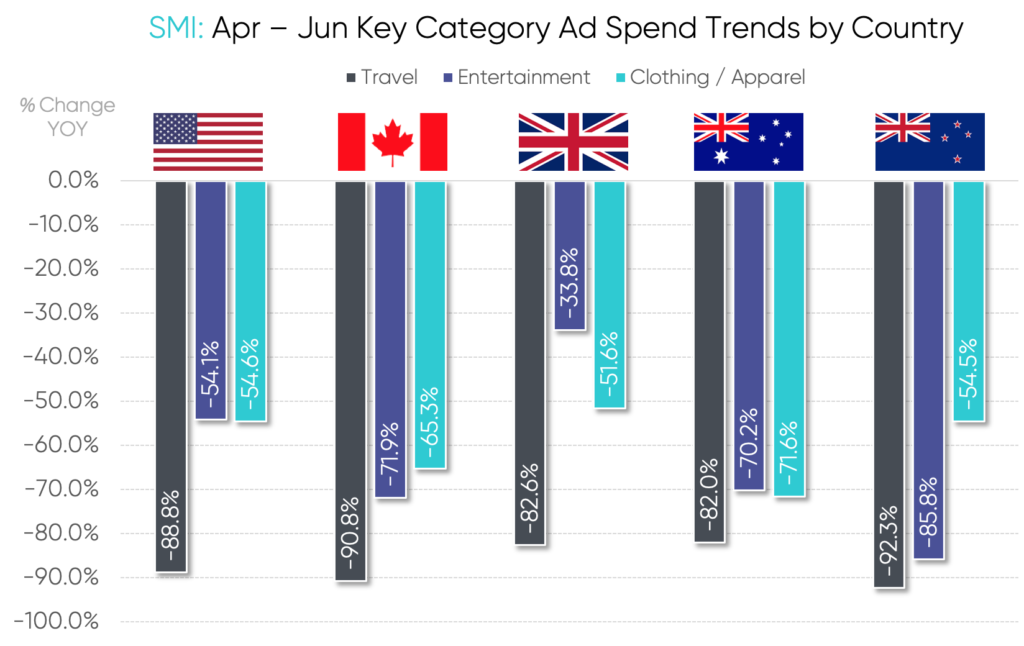
The pandemic caused quarantines, lockdowns and an economic slowdown which severely impacted ad spend across a number of product categories. According to SMI, in second quarter, no product category was hit harder than travel, which saw massive YOY decline of over -80% across all five markets. With many retailers, movie theaters and production studios temporarily closed, entertainment and clothing/apparel also had significant declines in all five markets.
Quarantines, lockdowns and an economic slowdown severely impacted ad spend across a number of product categories
Conversely, ad spend for a few product categories actually showed YOY growth in individual markets. These categories focused on health care, home related products and financial. For example, in the U.S. pharmaceutical ad spending had increased in second quarter. Household supplies and health care reported higher ad spend in Australia. In New Zealand the ad spend for both government and financial services grew notably. Technology also showed a strong showing in New Zealand and the U.K.

A Look at the Impact the Pandemic Had on Five Anglo Markets in Second Quarter
United States
The postponement of the two-month NBA postseason, concluding the top-rated NBA Finals in June, resulted in the delay of hundreds of millions of ad dollars for Disney’s ESPN/ABC and WarnerMedia’s TNT. The start of the Major League Baseball season was delayed for months beginning in late July also cancelling the All-Star game on Fox. The pandemic closed down TV production studios, impacting program development, delayed the annual TV upfront ad marketplace (which generates over $20 billion ad commitments annually) and subsequent start of the 2020-21 TV season. With the pandemic, economic downturn, politics and protests all happening in the quarter, the ratings and ad spend for news programming were strong in second quarter.
Canada
With the National Hockey League suspending all action, there were no games, including the Stanley Cup playoffs and Finals in second quarter impacting revenue for CBC and SportsNet. With the popular Hockey Night in Canada preempted, the CBC televised Movie Night in Canada as a replacement. “Hockey Night” has historically been a prominent TV ad revenue generator. The absence of the NBA postseason in second quarter also impacted ad revenue. In 2019 the Toronto Raptors won their first NBA title delivering record high audiences (for basketball) on SportsNet and TSN. In mid-March production studios were closed across Canada, which also effected U.S. programming many of which are filmed there. With the ad market taking significant losses, The Canadian Association of Broadcasters issued a report that in the wake financial pressures from the pandemic, 40 local TV outlets and 200 radio stations could be forced to close in the next three years.
United Kingdom
The English Premier League, the world’s most watched sports league, suspended play from mid-March until mid-June, wiping out most of second quarter ad spend with Sky Sports and BT Sport. Similar to other markets, filming schedules were forced to temporarily close in mid-March delaying release dates for many long-running and popular TV programs. The British government began an emergency film and TV coronavirus production insurance fund. One product category that had a significant drop in ad spending was gambling. In April, Members of Parliament called for a moratorium on all gambling ads, with people locked down at home and more prone to gamble. Betting and gaming advertisers complied.
Australia
TV production studios have been shut down since March. To provide relief, The Ministry of Communications announced in April a number of measures to help the commercial TV and radio stations as they provided updated information on the pandemic in the wake of a sharp decline in ad spend. Among these measures was a 100% rebate on the Commercial Broadcasting Tax for 12 months. In addition, with production studios closed, the government also suspended Australian programming obligations for the remainder of 2020. The loss of sports also impacted the ad marketplace, especially with the suspension of rugby and cricket. The one product category that reported a considerable decline in ad spend was political. In May 2019, Australia had a federal election.
New Zealand
Government was one product category in New Zealand that reported a YOY gain in ad spend. In April, the government announced they would invest in ad time to assist media companies as they cope with a loss of income from the pandemic. New Zealand was one country that was able to contain the coronavirus early. As a result, in June, the country staged its first rugby match in three months in front of spectators helping to bolster ad spend.
Video Streaming Sees Uptick with Lockdown
One of the beneficiaries of the lockdown and many television networks relying on reruns and reality programs has been ad-free streaming video providers. The subscriber counts and usage for Netflix, Amazon Prime and the recently launched Disney Plus have all surged globally during the pandemic. For example, in the U.S., time spent with streaming video in second quarter increased YOY by +74%.
Third Quarter Outlook
Although second quarter declines were substantial, early third quarter ad spend trends are improving with production studios opening up, more relaxed lockdown rules and premiere sporting events returning to television. SMI data finds early August TV ad spend in the U.S. has been stabilizing. In Australia and New Zealand television has been delivering the lowest year-on-year declines of any major media. Among the categories increasing their ad commitments in third quarter are CPG and financial services. Looking ahead, it is expected that television and digital will be the first two media categories to emerge from the advertising slowdown.
SMI will continue to track the global marketplace as ad spend returns to more seasonal levels in the months ahead.
To learn more about the data behind this article and what SMI has to offer, visit https://www.standardmediaindex.com/.


Sign up to receive our stories in your inbox.
Data is changing the speed of business. Investors, Corporations, and Governments are buying new, differentiated data to gain visibility make better decisions. Don't fall behind. Let us help.


Sign up to receive our stories in your inbox.
Data is changing the speed of business. Investors, Corporations, and Governments are buying new, differentiated data to gain visibility make better decisions. Don't fall behind. Let us help.


