
While seemingly defying the odds, home price growth has persisted throughout the pandemic and showed little sign of slowing down even though the nation is facing a potentially bigger contraction than the Great Recession. According to the latest CoreLogic HPI, home prices have grown about 70% from their post-Great Recession nadir in 2011. In some states, such as Nevada and Idaho, home prices have grown by as much as 130% since 2011. And while strong price growth can be supported with akin income and population growth in some markets, there are markets where continued price growth may have led to overvaluation.
The CoreLogic Market Conditions Indicator provides a benchmark to estimate if metro area home prices are growing faster than the long-term fundamental values. The Indicator starts with an assumption that home prices should generally increase in line with income growth of local households. If prices are growing faster than incomes, households are priced out of the market and price growth slows while incomes catch up. Thus, if the current Home Price Index is 10% or more above the long-term fundamental value, a market is considered overvalued[1]. On the other end, if the current Home Price Index is 10% or more below the long-term fundamental value, a market is deemed undervalued.
Most overvalued metros in Southeast and Rocky Mountains
In June 2020, 32% of the 392 U.S. metropolitan areas were considered overvalued. For reference, at the peak of the housing boom in 2006, 67% of metros were overvalued. The share came down to 8% in 2012 after the housing market collapse and has been increasing steadily since. Over the last two years, the share of metros considered overvalued has wavered between 30% and 33%.
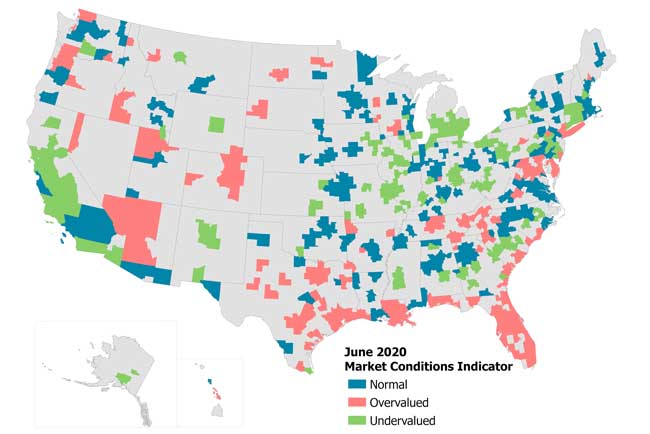
Figure 1 maps out the Market Conditions Indicator for the 392 metros and suggests that the majority of the overvalued areas are located near the coastlines or Rocky Mountains. This is generally consistent with trends shown in our March 2018 analysis of the Market Conditions Indicator which also showed about 32% of metropolitan areas being potentially overvalued by the MCI metric. Nevertheless, since March 2018, home prices have cumulatively grown 11% nationally with some variations across metropolitan areas.
Figure 1 : Market Conditions Indicator
To get a sense of more recent change in the Indicator across metro areas, we compared the MCI data to June 2019 when the share of metro areas considered overvalued was also 32%. Nevertheless, while the share has remained relatively steady over the last 2 years, some areas changed status from what it was a year or two ago. In total, compared to last June, MCI changed for 33 metro areas, 10 of which experienced a downgrade in the valuation Indicator, from overvalued to normal or from normal to undervalued. Generally, most of the 10 metros are smaller cities located in Midwest or in the Rocky Mountains, but also include a larger metro such as Indianapolis. Fourteen metros experienced an upgrade from undervalued to normal, five of which are located in California including Yuba City, Santa Rosa, Santa Maria, San Diego and Sacramento. In addition, nine metros moved from being considered normal to overvalued, largest of which are Urban Honolulu and Richmond, Virginia.
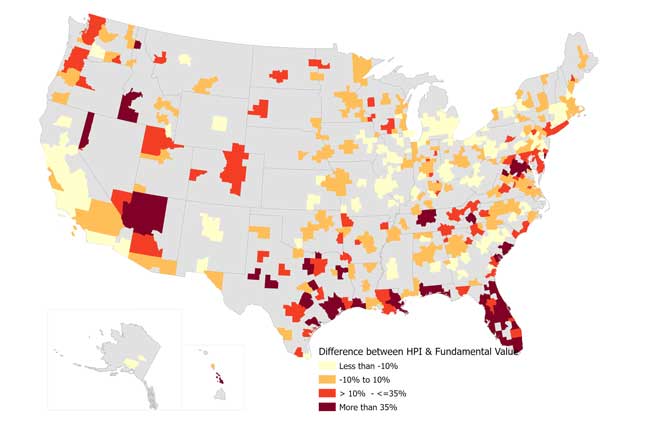
Wide range between current HPI and the long-term fundamental value
Even though some 124 metros are considered overvalued, the difference between the current HPI and the long-term fundamental value can range widely. Figure 2 maps out the percent difference between the current HPI and the fundamental value which ranges from 55% below to 84% above the value. Again, the differences below -10% suggest the market is undervalued; the range between -10% and 10% suggests a normal market; and differences greater than 10% suggest a market is considered overvalued. The map contains two instances of overvaluation, from 10% to 35%, and above 35%. As noted by the dark red, largest overvaluations are among cities in Texas, coastal Louisiana, and most of Florida, but also a few in the Rocky Mountains, and Washington, DC.
Record low mortgage rates have provided some affordability cushion for the current homebuyers especially in markets considered overvalued. However, once the mortgage rates pick up and affordability diminishes, overvalued markets are likely to see decline in home price growth.
Figure 2 :For overvalued markets, difference between current HPI and fundamental value ranges from 10% to 84%
To learn more about the data behind this article and what CoreLogic has to offer, visit https://www.corelogic.com/.


Sign up to receive our stories in your inbox.
Data is changing the speed of business. Investors, Corporations, and Governments are buying new, differentiated data to gain visibility make better decisions. Don't fall behind. Let us help.


Sign up to receive our stories in your inbox.
Data is changing the speed of business. Investors, Corporations, and Governments are buying new, differentiated data to gain visibility make better decisions. Don't fall behind. Let us help.