ATTOM Data Solutions’ just released Q3 2020 Special Report, spotlighting the U.S. housing markets more or less at risk of an economic impact related to the Coronavirus pandemic, shows that pockets of the Northeast and Mid-Atlantic regions were most vulnerable in Q3 2020, while the West and now Midwest fared less at risk.
According to the analysis, Connecticut, New York, New Jersey, Pennsylvania, Maryland and Delaware had 32 of the 50 counties most vulnerable to the economic impact of the pandemic in Q3 2020. The most vulnerable counties included five in the New York City metro area (Bergen, Essex, Passaic and Sussex counties in New Jersey, and Orange County, NY); four around Washington, D.C.; four around Philadelphia, PA (Burlington, Camden and Gloucester counties in New Jersey, and Bucks County, PA); four around Baltimore, MD (Anne Arundel, Baltimore, Carroll and Howard counties); and seven of Connecticut’s eight counties (Fairfield, Litchfield, Middlesex, New Haven, New London, Tolland and Windham counties).
ATTOM’s Q3 2020 COVID housing impact report noted that only four western counties among the top 50 were in northern California and Hawaii, while Illinois had the only six in the Midwest. The report also noted that another eight were loosely scattered across five southern states – Florida, Louisiana, North Carolina, Texas and Virginia.
For this special analysis, markets are considered more or less at risk based on the percentage of homes currently facing possible foreclosure, the portion of homes with mortgage balances that exceed the estimated property value, and the percentage of local wages required to pay for major home ownership expenses. This data was drawn from ATTOM’s most recent home affordability index, equity and foreclosure reports. Rankings were based on a combination of those three categories in 487 U.S. counties with sufficient data to analyze, and the counties were ranked from lowest to highest in each category, then an overall conclusion was developed based on a combination of the three ranks.
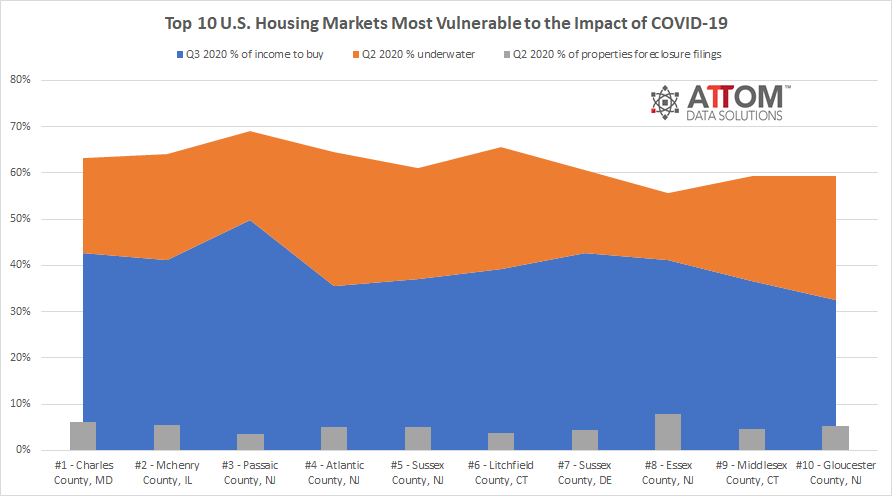
In this post, we uncover the complete list of the top 10 U.S. Housing Markets Most Vulnerable to the Impact of COVID-19, and the various contributing factors. Those counties include:
Charles County, MD
Mchenry County, IL
Passaic County, NJ
Atlantic County, NJ
Sussex County, NJ
Litchfield County, CT
Sussex County, DE
Essex County, NJ
Middlesex County, CT
Gloucester County, NJ
ATTOM’s Q3 2020 Special Report spotlighting the housing markets more or less vulnerable to the impact of COVID-19, also shows that 25 of the 50 least-vulnerable counties from among the counties included in the analysis were in Colorado, Indiana, Missouri, Texas and Wisconsin. The largest populated counties least at risk included Tarrant County (Fort Worth), TX; Travis County (Austin), TX; Marion County (Indianapolis), IN; Denver County, CO, and Arapahoe County, CO (outside Denver).
To learn more about the data behind this article and what Attom Data Solutions has to offer, visit https://www.attomdata.com/.


Sign up to receive our stories in your inbox.
Data is changing the speed of business. Investors, Corporations, and Governments are buying new, differentiated data to gain visibility make better decisions. Don't fall behind. Let us help.


Sign up to receive our stories in your inbox.
Data is changing the speed of business. Investors, Corporations, and Governments are buying new, differentiated data to gain visibility make better decisions. Don't fall behind. Let us help.