In addition to increased purchases of flour and furniture, the early spring lockdown in many states led to more consumption of video streaming services as consumers looked for alternative sources of entertainment under stay-at-home orders. This was true even for entrenched services. By August, the number of Netflix subscribers in our data was 5% higher than at the beginning of the year and Hulu subscriptions were 10% higher. Streaming newcomers saw a much larger boost. YouTube TV subscriber numbers were almost 50% higher in May and June than they had been in November, though they tapered off slightly in July and August. Disney+ was able to amplify its launch momentum, with subscriber numbers peaking in July up almost 70% from its launch less than a year earlier. Its release of the blockbuster musical Hamilton on July 3 may have had some impact on its success, as July subscriber numbers versus November launch were up an additional 13% from June after flattening trends in the three months prior.
Although quarantine provided a boost to the already popular U.S. pastime of watching TV at home, not all new subscribers were happy with their offerings. Focusing just on new subscribers who first paid for each service in April, by August only 60% were still subscribed to YouTube TV, 72% to Hulu, 76% to Disney+, and 80% to Netflix. Some of this is likely due to reopenings as out-of-home activities became more available. But much is likely also due to increasing competition for programming as streaming services proliferate, making fresh new content to keep viewers engaged harder to come by.
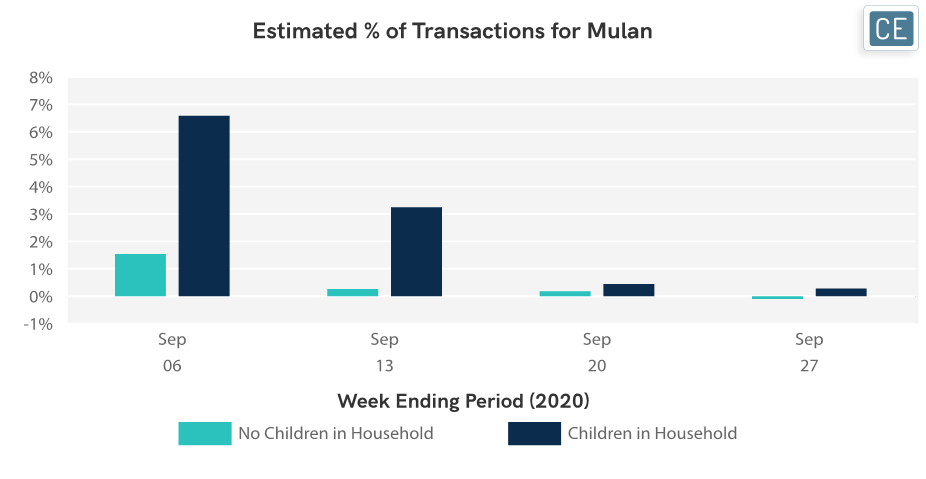
In September, Disney doubled down on its leverage to its streaming service by releasing Mulan, which was supposed to have been a big-screen blockbuster, on Disney+ on September 4 for an additional charge of $29.99. CE Vision provides the ability to not only look at data by transaction size in order to isolate these purchases from monthly subscriptions, but even allows cuts of this data by demographics such as households with children versus households without children. These cuts show that Mulan did have some success on Disney+, especially with families. The week of its release 7% of transactions from households with children were in the price range for Mulan, followed by 3% the week after. Households without children also did watch the movie but at a lower rate, with 2% of transactions from this group in the Mulan price range the week of its release.

With CE Vision, users can track which companies are seeing growth over time and how specific events such as the launch of popular content can affect growth trajectories. Users can also evaluate how long subscribers are continuing their subscription plans. Given this data, companies can compare how they are doing versus competitors and see how their own special events and competitor special events have affected growth and loyalty. Finally, users can take advantage of CE Vision’s unique ability to filter data by price point in order to track the success of specific product tiers, by demographic or geographic groups where relevant.
To learn more about the data behind this article and what Consumer Edge Research has to offer, visit www.consumer-edge.com.


Sign up to receive our stories in your inbox.
Data is changing the speed of business. Investors, Corporations, and Governments are buying new, differentiated data to gain visibility make better decisions. Don't fall behind. Let us help.


Sign up to receive our stories in your inbox.
Data is changing the speed of business. Investors, Corporations, and Governments are buying new, differentiated data to gain visibility make better decisions. Don't fall behind. Let us help.


