According to the data, reemergence marches on, slowly and subtly. We’re now in a phase where national changes to foot traffic are small to nonexistent for most categories.
We quantify visitation trends by comparing a 7-day average volume of foot traffic to the 7 days prior. This metric removes blips and lets us measure how much foot traffic is increasing or decreasing over the past week. This metric has remained very low for all of October:
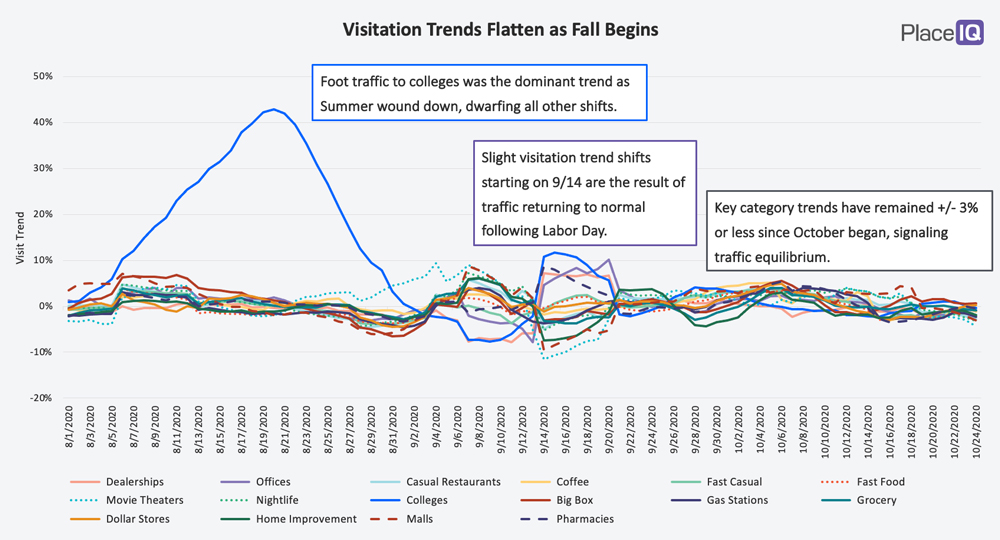
Following the return to college (some of them, anyway) and a slight spike for Labor Day, national foot traffic has remained remarkably steady. Thus, we have a moniker for our current phase: the Fall Flats.
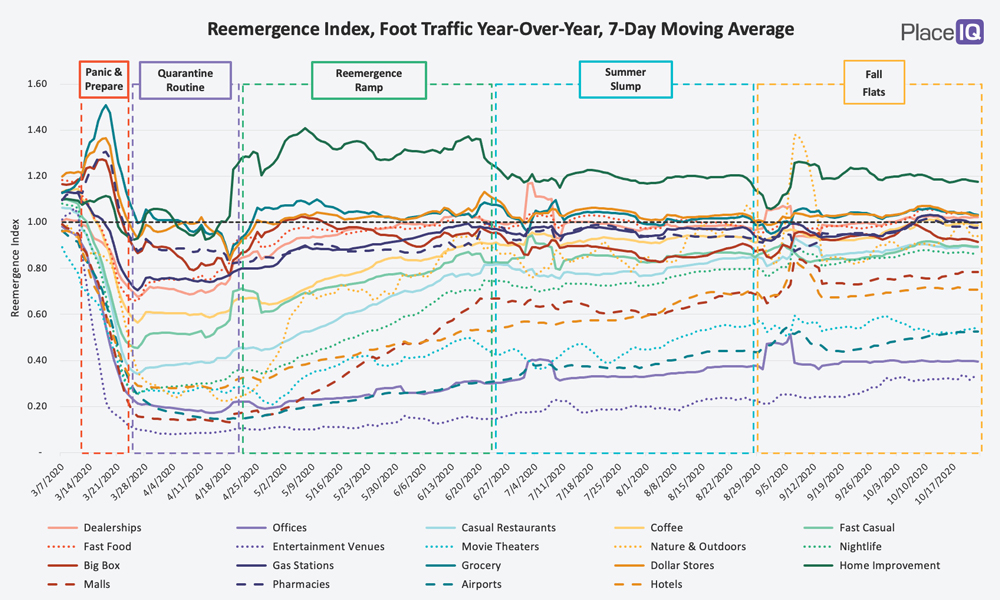
The gains and losses each category has accrued over the Summer seem to be locked in. Surprisingly, new rises in COVID case counts during October have not yet impacted these volumes. We will be watching closely to see if (a) new cases eventually make a dent in foot traffic (as they did during the Summer Slump) or (b) holiday shopping begins to drive retail traffic upwards. For now, we’re in the flats.
The question on business’s minds: how do we measure progress now? While national traffic trends seem to have found equilibrium, the story is different when we start to look at regional variations. Today we’ll be using regional foot traffic variation to illustrate which business categories are slowly returning to usual and which categories remain radically different compared to their pre-COVID past.
Reemergence Happens in Two Stages: Foot Traffic Growth Followed by a Decline in Regional Variation
We’ve continually noted that reemergence is regional. You might expect a pandemic to generate similar behavior everywhere (since we’re all dealing with the same challenge) but shelter-in-place measures combined with remote work and schooling have kept people organized into tight, local bubbles. As a result, local economies march more to their own tune than usual, shifting upward and downward as local conditions dictate — be they infectious, economic, or demographic.
To illustrate this variation, let’s take a look at foot traffic to shopping malls, using a year-over-year index. Here’s the national picture:
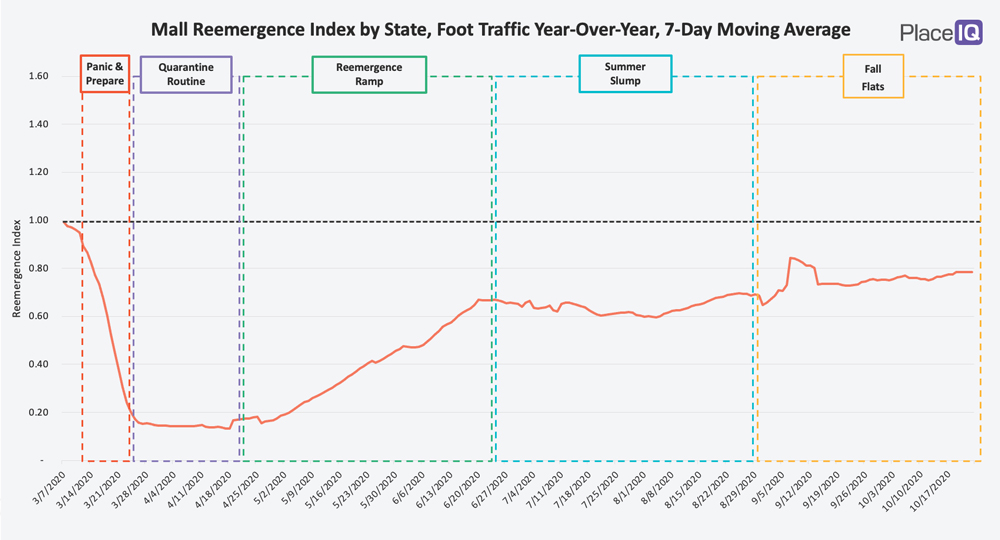
Here’s the picture when we break out each state:
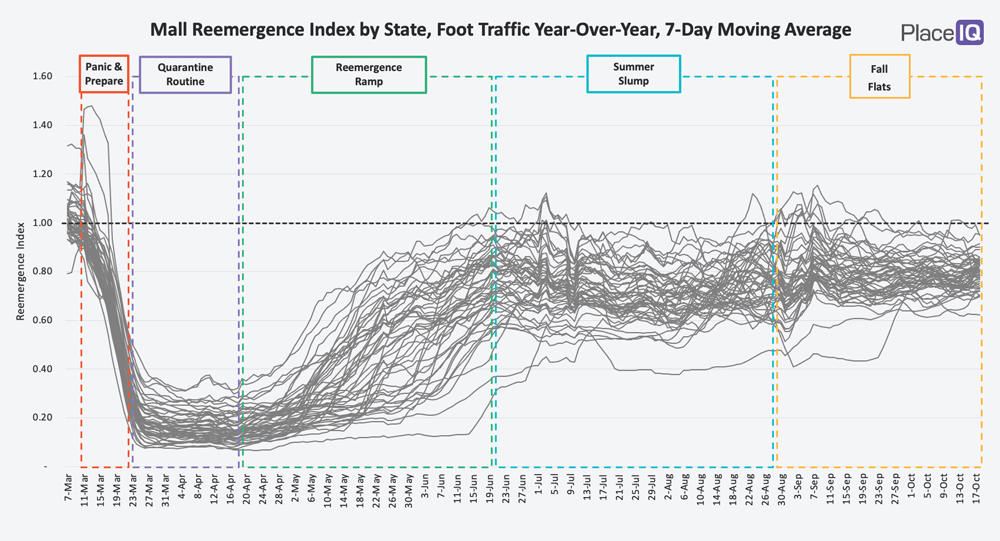
What’s important to note isn’t just that each state is taking its own varied path towards recovery, but that the difference between the lines — the gap between the highest and lowest lines — is changing over time. During the first two phases of post-COVID life, variation was low. Traffic to malls fell as one and all states avoided indoor shopping centers throughout the Quarantine Routine. As lockdowns eased, variation increased. Local regulations and demand varied from state to state, resulting in an incredibly varied recovery. Only now, as traffic has equalized in the Fall Flats many months later, do malls seem to be largely unified across the nation.
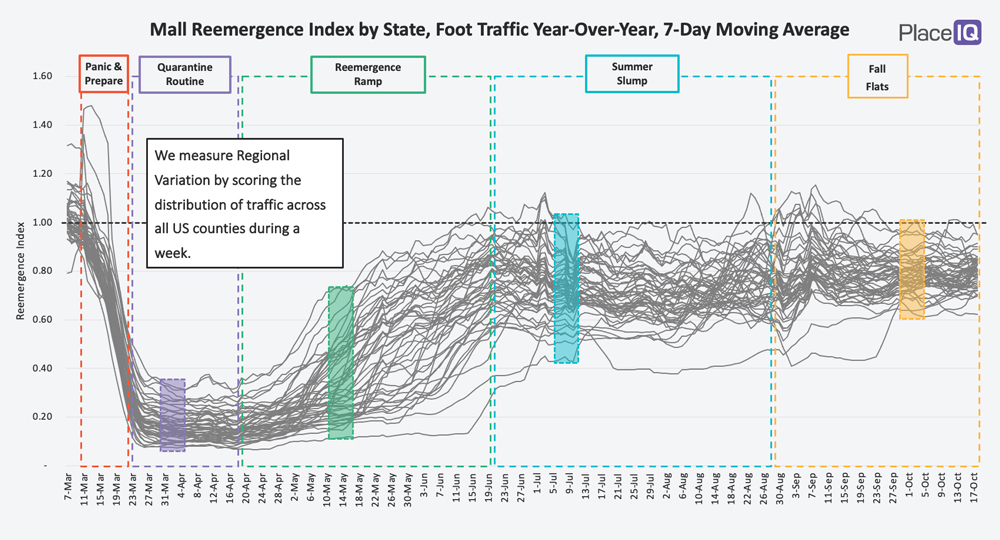
Thankfully, it’s easy for us to quantify this regional variation.
To easily compare regional variation to foot traffic indices, we’ve created a regional variation index. This figure compares the standard deviation for traffic across all US counties for a given time period to the pre-COVID standard deviation. Simply put, the index measures if regional variation for foot traffic is higher or lower than the usual amount of variation for a venue or business. For example: a score of 1.65 regional variation means traffic is 65% more varied than usual.
When we chart our regional variation index alongside our foot traffic index an interesting trend emerges:
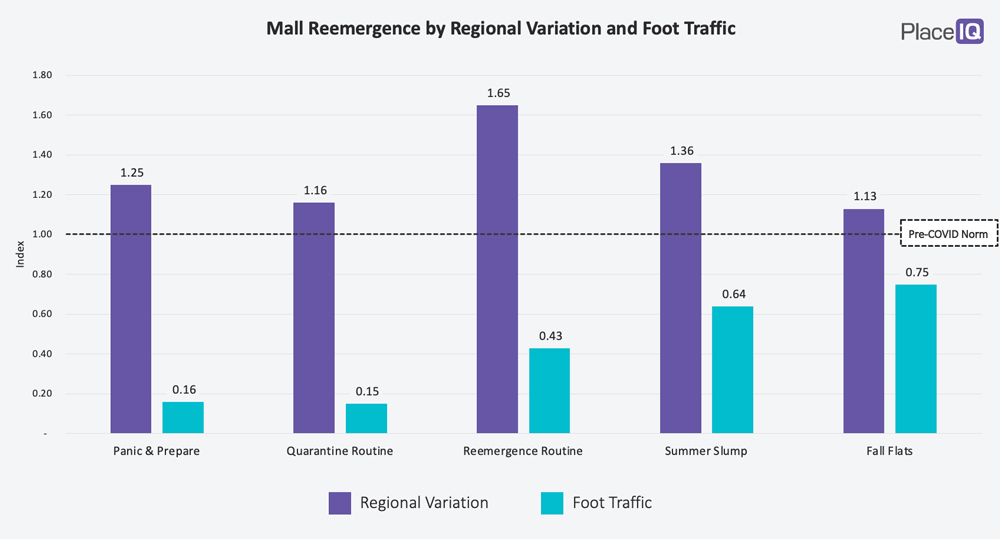
For Panic & Prepare and Quarantine Routine traffic is abysmally low. Regional variation isn’t far from normal (16% more variable during the Quarantine Routine), but that’s because traffic is low everywhere.
As reemergence takes place for shopping malls we see an interesting pattern. In the first phase of recovery, foot traffic increases but so does regional variation. This is because the initial traffic back to malls comes from isolated areas with low infection rates, high risk tolerances, and/or less cautious government regulations. Traffic starts coming back in a few counties, but stays quiet everywhere else.
As the phases progress, we can see that foot traffic recovers first, then becomes evenly distributed. Both metrics are approaching the pre-COVID Norm line through the Summer Slump and the Fall Flats.
In our analysis, this pattern — foot traffic increasing followed by regional variation decline — is common among most retail and dining businesses. The pattern is crystal clear for Gas Stations and Convenience Stores and among Fast Food restaurants:
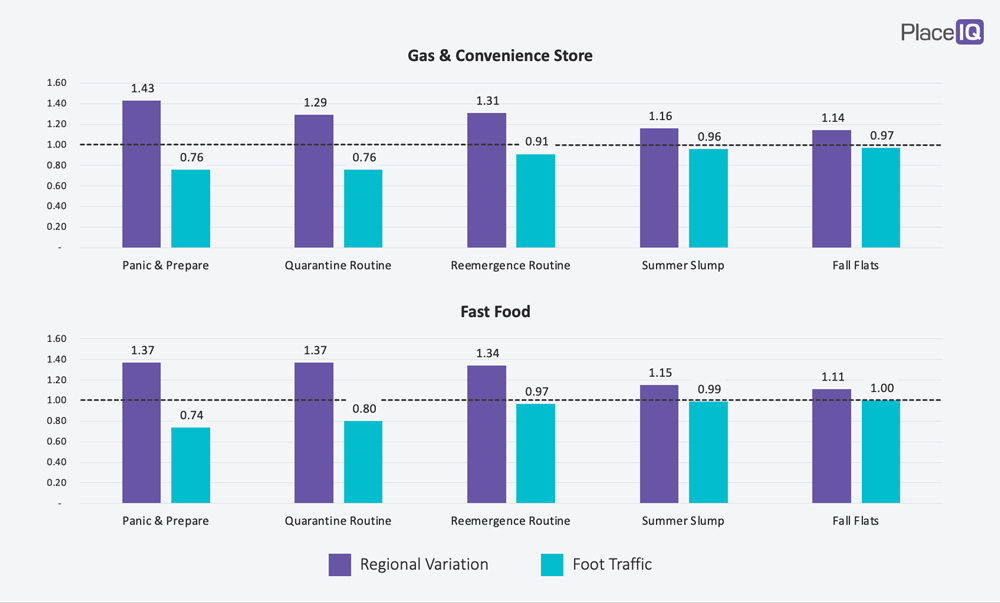
Both have nearly arrived at their pre-COVID norms by the Fall Flats. Visitation is up and regional variation is down — foot traffic across the nation is consistent.
The regional variation index reveals how some industries whose foot traffic has been steadily increasing are far from ‘normal’. The travel industry follows a completely different pattern than the ‘essential’ businesses above:
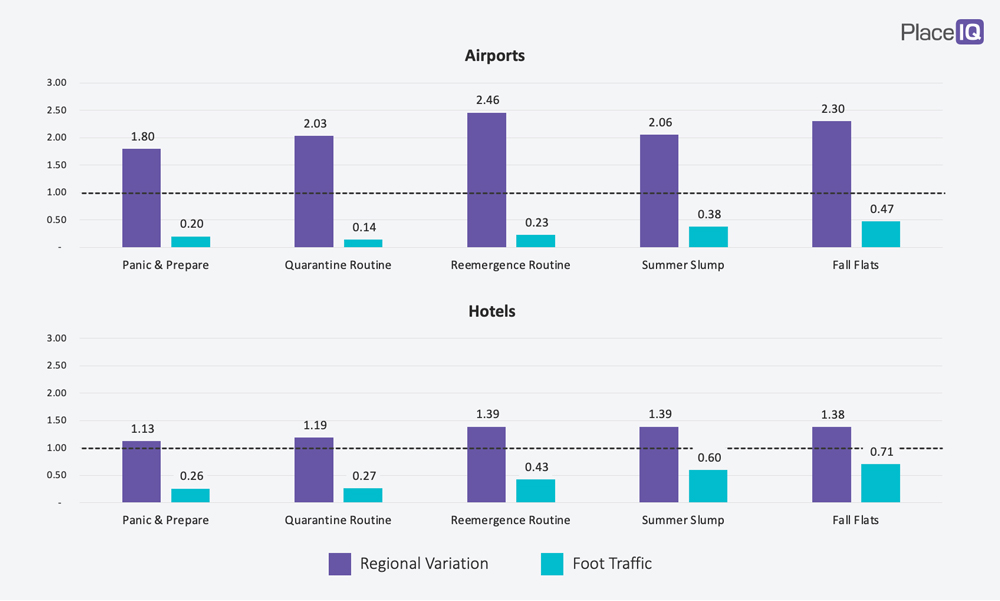
For airports and hotels, foot traffic is increasing while regional variation remains astoundingly high. While there are several contributing factors here, the macro theme is that tourism has rebounded while business travel remains dormant. Tourism is much more reliant on a few, large destinations, while business travel is more widely distributed among destinations across the country. With business still being conducted remotely, regional variation scores for hotels and airports are especially high.
Airports are especially lopsided, with regional variation more than twice it’s pre-COVID benchmark. Hotels benefit from the surge in road trip tourism in ways that airports do not.
To further illustrate how different the travel industry is these days, we can use a beeswarm plot to highlight how disparate the recovery is among different counties:

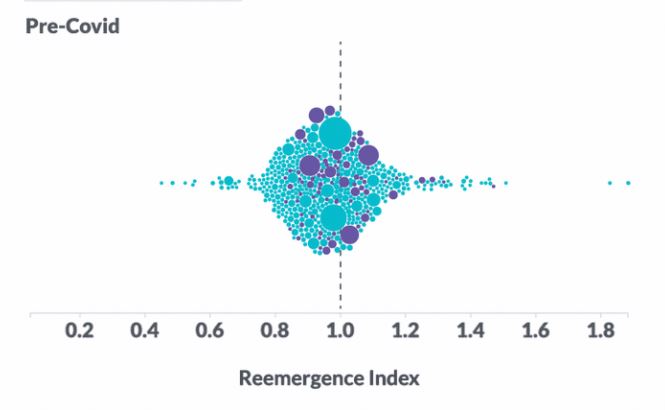
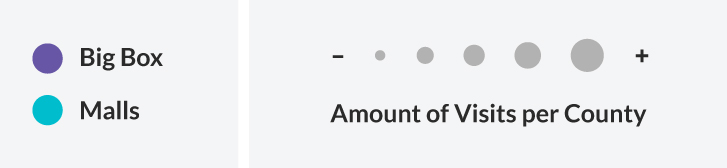
The beeswarm plot seems a bit complex when you first come at it, but it’s pretty simple once explained so let’s get our bearings first.
Each circle in the plot represents foot traffic to venues in a county; the blue ones are for hotels, the purple ones are for airports. The size of the dot represents the total foot traffic to the venues in a county.
The x-axis is our Reemergence Index, or year-over-year foot traffic compared to 2019. The further left a dot is on our chart, the less it’s traffic is compared to 2019. Further right, and traffic is up.
We’ve plotted out five time periods on our chart, with the first one demonstrating what traffic looked like prior to COVID. Before COVID, the dots were closely clustered together because traffic was close to year-over-year norms, across the nation. In the post-COVID phases, the plots are long, indicating that performance is strongly varied from county to county. Some regions are at or above 1.0 by the Fall Flats, while others range all the way down to 20% of 2019 norms. The counties are moving upward, but very slowly and one-by-one.
To illustrate how remarkable this is, compare this travel ‘reemergence’ to our initial example, shopping malls:
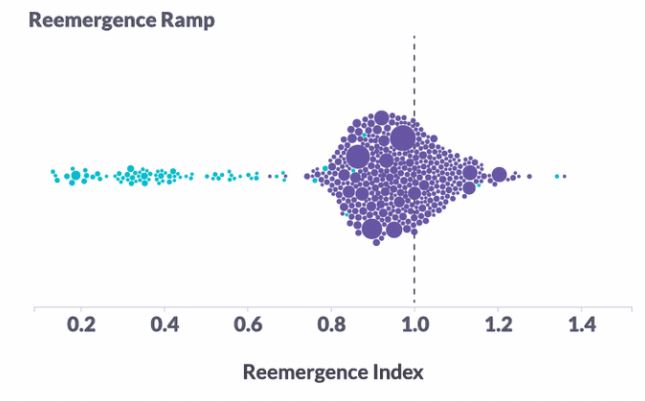
We’re plotting Big Box retailers here as well — a category whose traffic remained relatively consistent throughout the pandemic — for context. Malls, like hotels and airports, were clustered closely together pre-COVID, indicating a very low regional variation across the US. This regional variation increased dramatically during the Quarantine Routine and the Reemergence Ramp, as we can see by the counties not clustering at all.
However, as traffic began to return during the Summer Slump regional variation began to decline. The counties began to cluster together and rejoin the Big Box category in terms of traffic recovery. Today, in the Fall Flats, the mall foot traffic index is up and regional variation is down. It’s below the benchmark norm which Big Box has achieved, but it’s still dramatically more normal than hotels and airports, whose traffic is up — but tremendously lopsided.
With these figures, we hope you see how reemergence happens in two stages: first foot traffic returns, then regional variation declines. This nuance is tremendously important when attempting to gauge the health of an industry or a specific brand, and is essential when planning future investments in real estate, media, resource allocation and more.
To learn more about the data behind this article and what PlaceIQ has to offer, visit https://www.placeiq.com/.


Sign up to receive our stories in your inbox.
Data is changing the speed of business. Investors, Corporations, and Governments are buying new, differentiated data to gain visibility make better decisions. Don't fall behind. Let us help.


Sign up to receive our stories in your inbox.
Data is changing the speed of business. Investors, Corporations, and Governments are buying new, differentiated data to gain visibility make better decisions. Don't fall behind. Let us help.