Source: https://blog.linkup.com/data-seekers/2020/11/19/insights-from-our-new-economic-indicators-report/
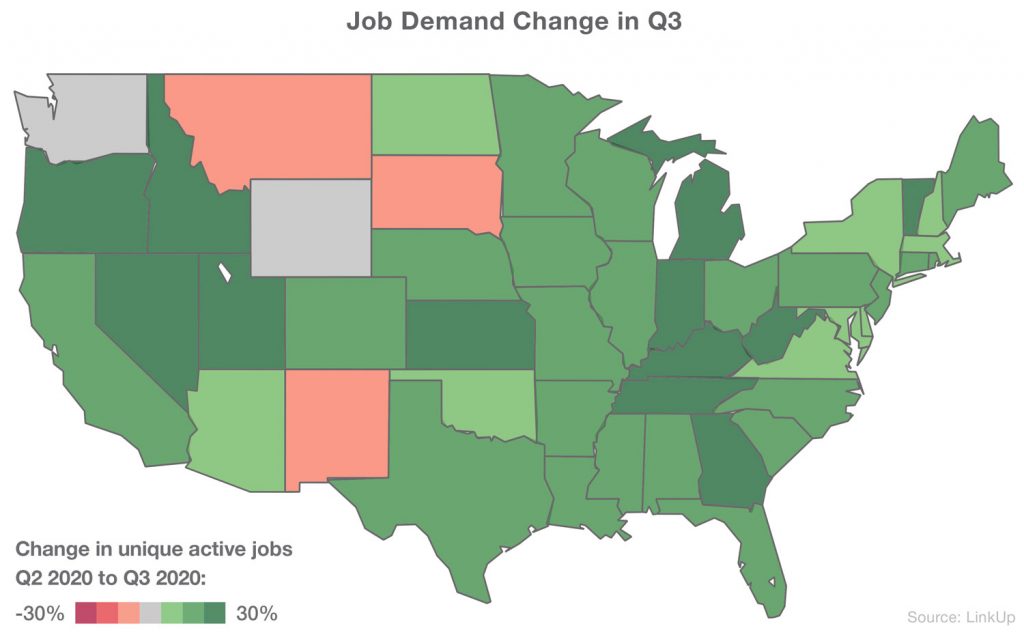
As coronavirus continues to spark volatility in the U.S. economy, LinkUp’s jobs dataset provides unique insights into COVID-19’s impact on the labor market. In the most recent edition of our quarterly Economic Indicators Report, we observe a labor market edging toward recovery from the devastating hits doled out by the pandemic. Though some progress is evident, there is certainly more progress to be made.
Total active job listings were up more than 15% in Q3 2020, after a drop of 25% in Q2. This increase was driven largely by a boom in created jobs, which could signal employers seeing strength in both business and the economy as a whole. Comparing that 15% job growth to the much smaller 5% growth witnessed in Q3 of 2019, we see just how significant the recovery was from July – September.

Active duration decreased dramatically in Q3, returning to pre-COVID levels. Employers are filling jobs at the rate seen pre-pandemic, another signal that in Q3 of 2020 business saw strength in the economy.
Job demand volatility (or the speed at which hiring increased or decreased over the quarter) was mostly steady from Q4 2018 through Q1 2020, but saw a huge increase in Q2 due to COVID-driven shut downs. The increase in created jobs that drove up active listings also helped to flatten demand volatility in Q3; the figure appears to have leveled out now that many employers have gained the confidence to hire again.
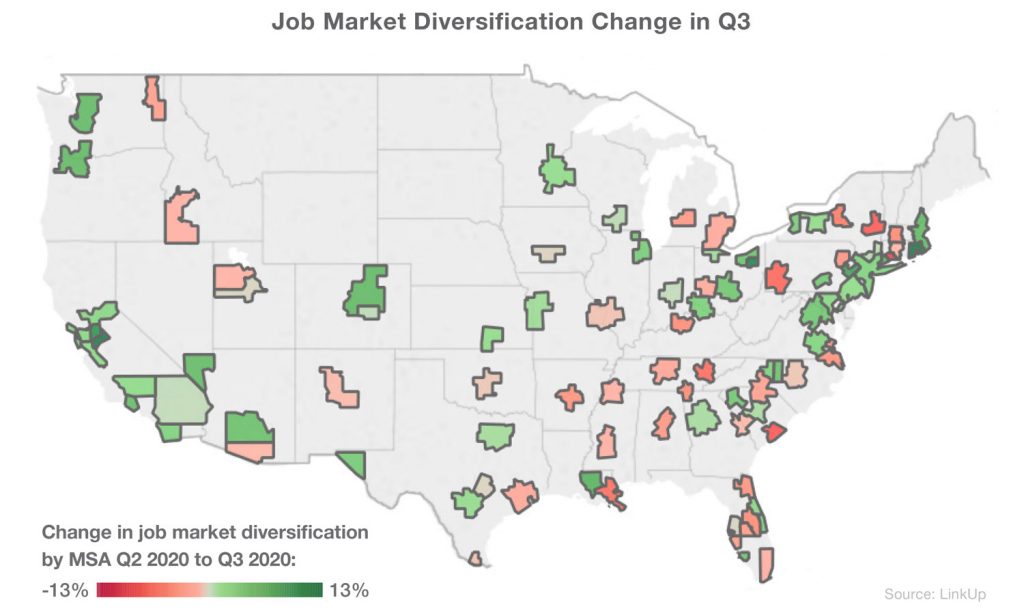
When we examine job market diversification scores (JMDR scores measure the diversity of listings across metropolitan statistical area, sector, company, and occupation), the most substantial increases occurred in Providence, RI, Modesto California, and Akron Ohio – a substantial comeback from having some of the biggest negative change in Q2. New Haven, CT, Charleston SC, and Albany, NY had the highest negative change in JMDR in Q3.

Drilling down to occupations, we saw the greatest number of active job listings in Q3 in Sales and Related; Healthcare Practitioners and Technical; and Food Preparation and Serving Related. This mirrored what was observed in Q2, with only slight changes in order, but was also similar to Q3 2019 when the occupations with the largest unique active jobs included Food Preparation and Serving; Management Occupations; and Healthcare Support Occupations. The occupations that saw the biggest percent increase in listings in Q3 were Arts, Design, Entertainment, Sports, and Media; Office and Administrative Support; and Production.
To learn more about the data behind this article and what LinkUp has to offer, visit https://www.linkup.com/data/.


Sign up to receive our stories in your inbox.
Data is changing the speed of business. Investors, Corporations, and Governments are buying new, differentiated data to gain visibility make better decisions. Don't fall behind. Let us help.


Sign up to receive our stories in your inbox.
Data is changing the speed of business. Investors, Corporations, and Governments are buying new, differentiated data to gain visibility make better decisions. Don't fall behind. Let us help.


