As consumers navigate through a pandemic-defined holiday season, we took the opportunity to dig into the start of this season’s behavior utilizing our spend, foot traffic, and retail pricing data, as well as our newly launched income data. Our analysis is an overview of sales data to date* this season. We will be evaluating the full holiday performance after the New Year.
In addition to the discussed shift to online, this year also included an earlier start with throttled hours of in-store openings in order to minimize traffic, but it is also lapping a shortened 2019 holiday season (i.e. there were six fewer days between Thanksgiving and Christmas last year relative to years prior), which, according to our research, produced an early ~7 point acceleration last year due to compressed spending behavior, a dynamic that eventually normalized down as the season progressed. As such, it’s possible this season’s YoY performance will improve, despite the pandemic, as the season progresses.

Key Takeaways
A Rebound Still Paused
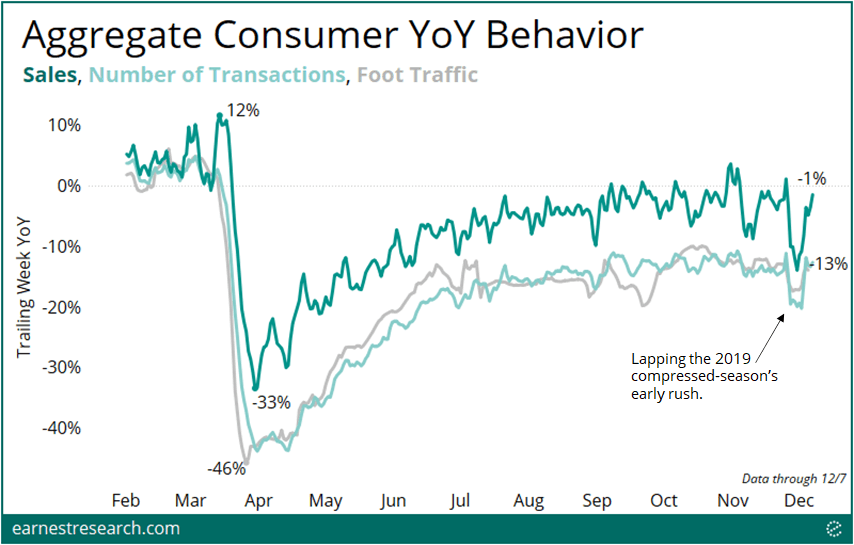
To situate the start of the holiday in its proper pandemic context, we refreshed our macro consumer behavior data across thousands of retailers across the country and analyzed performance to date. Total aggregate consumer spending declined ~1% YoY in the week ending Dec 7th. This was roughly the same level of decline seen since September, importantly, still a pause from the summer rebound, and still shy of the pre-pandemic mid single digit growth. Foot traffic and the number of transactions remain depressed at ~13% declines, also roughly equivalent levels since July.
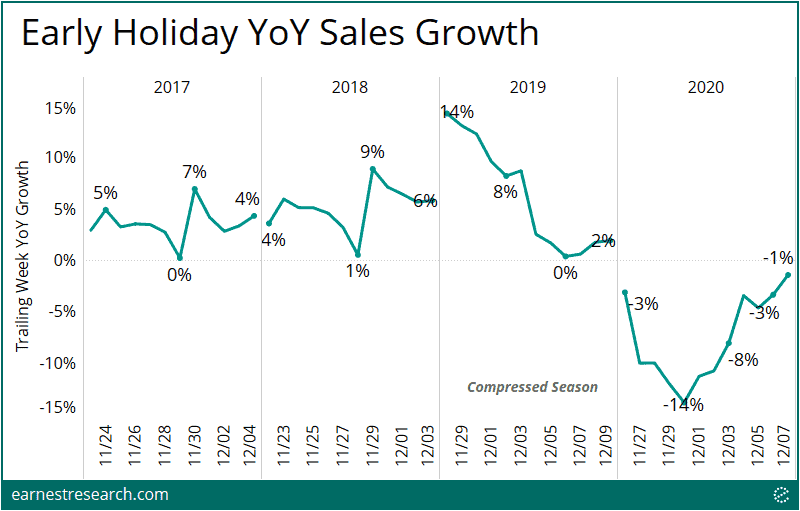
Due to 2019’s compressed-season early strength, the onset of the season saw a material YoY dip which shortly thereafter snapped back. As depicted below, year-over-year spending eased last year following the initial compressed rush, which resulted in a very brief 14% YoY decline this year in the week ending 11/30, but which then rose to a 1% decline just a week later. As a benchmark, the 2017 and 2018 start to the season saw ~7 to 9% YoY growth in the first week of the season, a stark reminder of the pandemic-driven softness this year.
So Go the Holidays
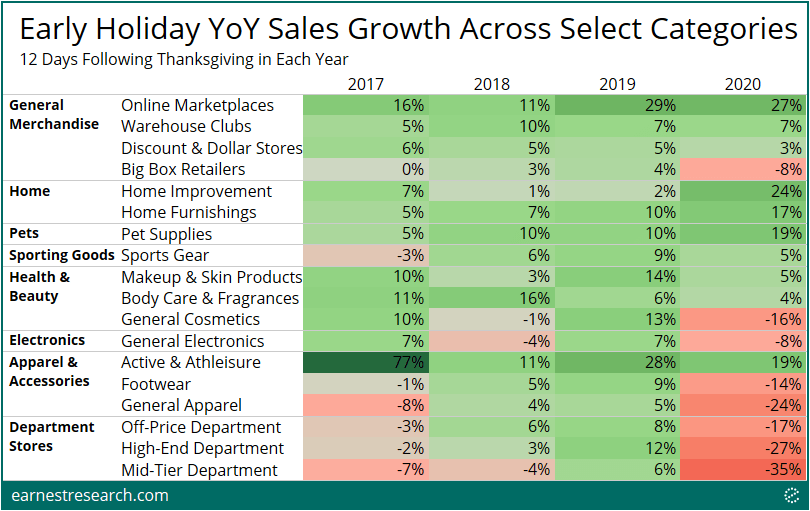
Looking at particular sectors, the trend of COVID-related consumer behavior over the past several months continued through the start of the holiday season.
Leading the beneficiaries were Online Marketplaces (Amazon, Etsy, etc.), up 27%, although flat sequentially, as the 2019 period was up a strong 29% (likely also compressed-season related). Time at home continued to drive Home Improvement up 24%, a sharp 22 point acceleration from 2019’s growth. Apparel’s Active & Athleisure continued to propel up 19%, albeit 9 points lower than last year, but still the only shining light in Apparel. Pets were the next strongest beneficiary, up 19% in Pet Supplies, an impressive almost 2x last year’s growth.
At the struggling end, High-End and Mid-Tier Department Stores were each down ~30% during this all important period, a painful ~40 point slowdown in growth, while Off-Price declined 17%, a 25 point slowdown. General Apparel and Footwear declined 24% and 14%, respectively, both a sharp ~25 to 30 point slowdown in growth from last year.
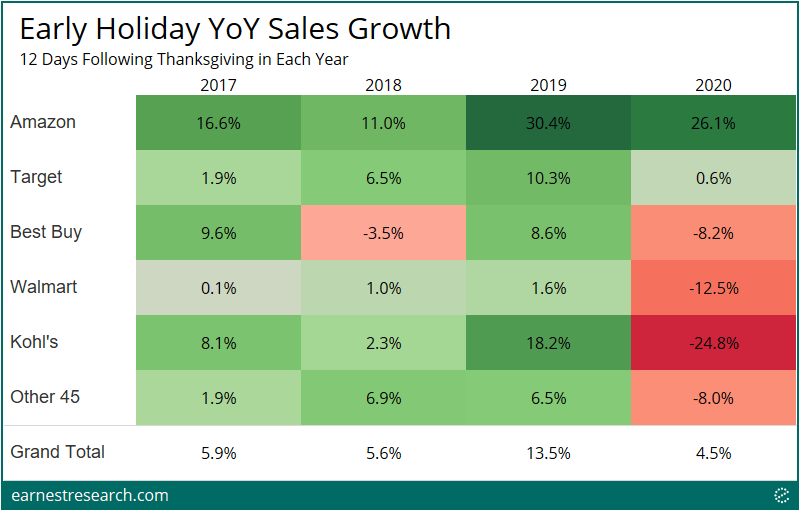
Amazon and Target Impressed; Kohl’s Struggled
Zooming in on performance*** across the largest traditionally holiday-oriented retailers, it comes as no surprise that Amazon led the way, with the only significant growth over this early holiday period (see our Prime Day/Year? analysis). Target topped the legacy brick and mortar retailers, and was the only one that managed a positive year-over-year growth thus far into the holidays. Best Buy saw a (relatively good, considering) 8% decline, Walmart saw ~13%, Kohl’s saw a rough ~25%, and the collection of 45 other retailers** declined ~8%.
All in, the shift to online was obviously the sought after lifeline. Target’s online spend grew an impressive 56% YoY, alongside a 6% in-store spend and a 28% in-store traffic decline. Walmart and Best Buy’s spend online grew over 30%, alongside foot traffic declines of roughly the same magnitude. Kohl’s, on the other hand, struggled to see its online growth perform, offering little to mitigate its ~38% in-store decline.
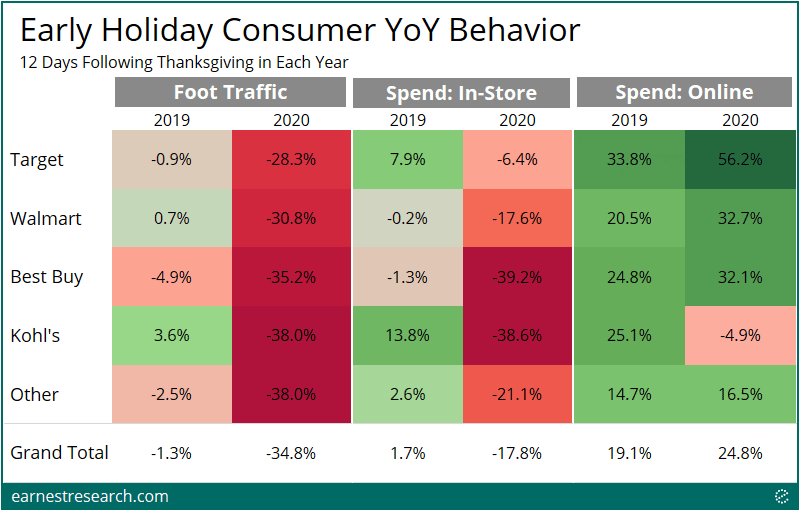
*Foot traffic’s ‘other’ includes 28 of the ‘Other 45’ retailers in this analysis based on our current coverage. Please reference our coverage list in the notes section to see which are included.
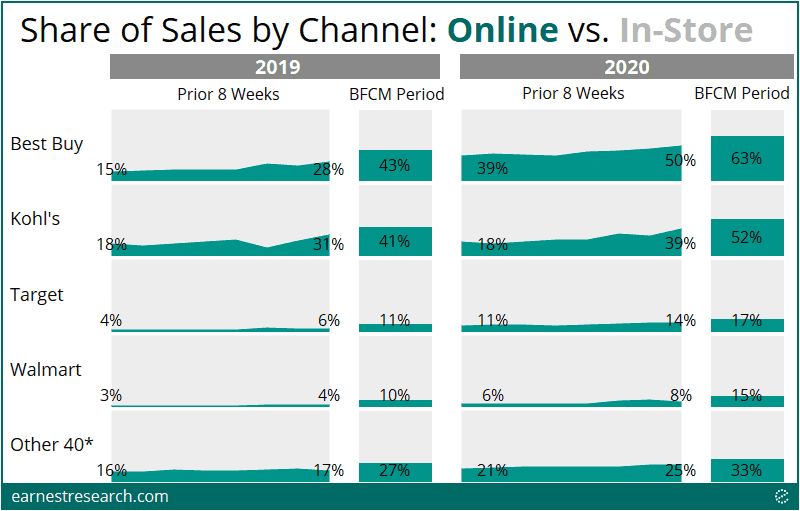
Has Online Reached a Ceiling?
Online spending has been the pandemic’s answer since April. The question though is if this shift has already reached a ceiling, or would this shift push even further into the holiday season?
Answer: no ceiling just yet. Of the legacy brick and mortar stores, Best Buy managed to generate roughly two thirds of its sales online this early holiday season, ~20 points up from last year, but more importantly, 13 points more than just a week before Thanksgiving. Interestingly, despite its struggles, Kohl’s acquired roughly half of its sales online this early period, a 9 point increase from last year, and also 10+ points more than the weeks prior to Thanksgiving. Conversely, Target and Walmart pushed its online share only slightly up into the holiday season, now at ~15 to 17%, notable given Target’s strength this period (and year).
*Other 45 excludes online-only platforms Audible, Chewy, Etsy, Stitch Fix, and QVC.
A Non-Promotional Best Buy
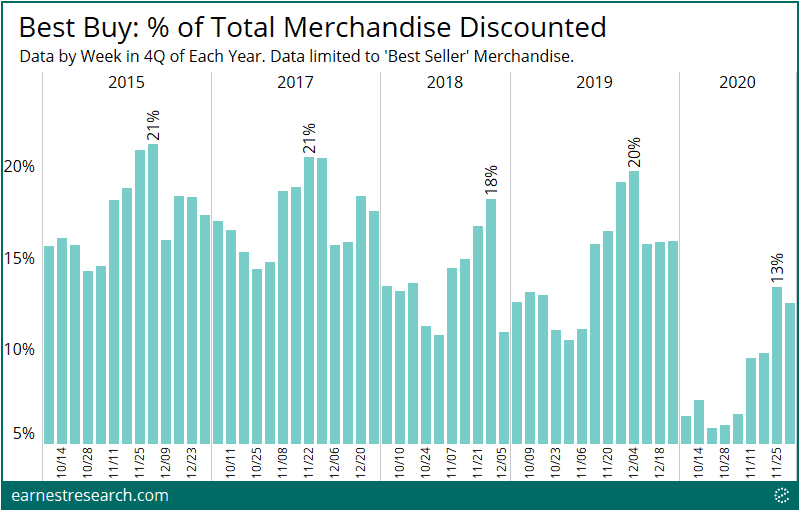
Best Buy’s performance stood out, so we wanted to dig deeper. Specifically, we asked, how promotional was Best Buy this holiday season given such a successful online penetration? It turns out not so much.
Since the start of the pandemic, the electronics retailer had decreased promotional activity to record lows in the past five years. Total % Merchandise Value Discounted – measuring the overall level of discounting across Best Buy’s merchandise (including both full-price items and on-sale items) – peaked at 13% across all best selling products this holiday season, significantly lower than the 18-21% peak promotional activity typically observed over the same period in the previous four years.
Higher-Earners Driving Performance
Lastly, to round out this analysis, we looked at our newly launched income data, specifically, looking at whether the breakdown of shoppers by income-bracket materially changed this season.
In general, high-income earners of $150K+ per annum continued to drive increasingly more sales across these retailers, although, the majority of sales continues to be generated by <$100K earners, and more specifically, by the $40-100K bracket. It’s intriguing to us that the relatively better performers so far this season: Amazon, Target, and Best Buy, are also the retailers more weighted towards higher-earners (relative to Walmart and Kohl’s). This is especially notable during a pandemic where income levels for many consumers has likely changed dramatically: are more high-earners an indicator of performance?
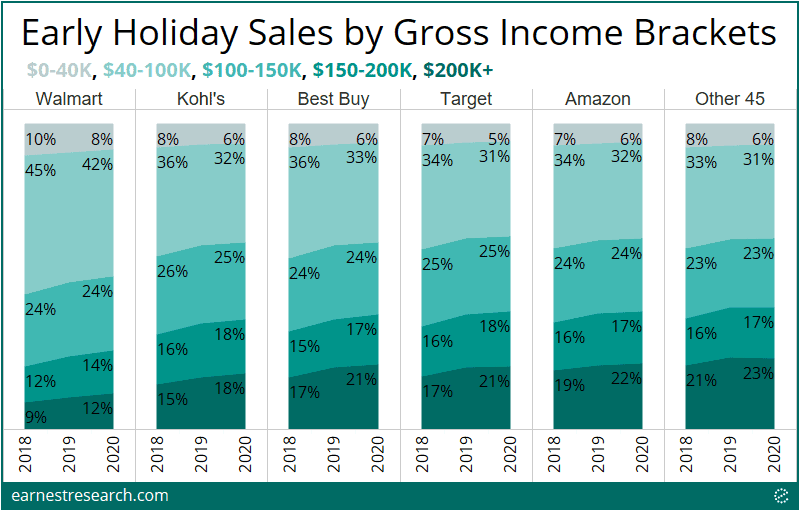
*excludes ~12 to 18% of sales from income brackets that are unavailable.
Earnest Insights 2020 Out

Notes
Analysis excludes spend made on store-branded cards that will likely not be paid down until after the holiday period. Many retailers in this analysis are sensitive to this exclusion.
*We define the “Early Holiday Period” from Thanksgiving Day to the Monday 12 days later. This ensures that all Black Friday / Cyber Monday transactions with processing delays are included in the analysis. (For reference, in 2017, the majority of Amazon’s Black Friday / Cyber Monday transactions were processed ~10 days after the important weekend). Additionally, a 12 day period also has the effect of mitigating some (but not all) of the 2019 compressed-season spending dynamic.
**The other 45 retailers include: Academy Sports & Outdoors, American Eagle, Ann Taylor, Anthropologie, Audible, Banana Republic, Barnes & Noble, Bath & Body Works, Big Lots, Bloomingdale’s, Burlington Stores, Chewy, Dick’s Sporting Goods, Dillard’s, DSW, Etsy, Gap, GNC, H&M, Hobby Lobby, J.C. Penney, J.Crew, L.L. Bean, Loft, Lululemon, Macy’s, Marshalls, Men’s Wearhouse, Michaels Stores, Neiman Marcus, Nike, Nordstrom Full Price, Nordstrom Off Price, Old Navy, Petco, PetSmart, QVC, REI Coop, Ross Stores, Sears, Sephora, Stitch Fix, T.J. Maxx, ULTA Beauty, Victoria’s Secret. Our spend coverage list can be accessed here and our foot traffic coverage list here.
***Based on the most recent backtest results, Amazon growth is likely overstated in the data, Walmart and Target are likely understated, and Kohl’s was overstated last year. In general, all merchant performance trends should be interpreted in the context of our EarnestKPI backtest differentials. For a better understanding of our biases and differentials, schedule a demo.
To learn more about the data behind this article and what Earnest Research has to offer, visit https://www.earnestresearch.com/.


Sign up to receive our stories in your inbox.
Data is changing the speed of business. Investors, Corporations, and Governments are buying new, differentiated data to gain visibility make better decisions. Don't fall behind. Let us help.


Sign up to receive our stories in your inbox.
Data is changing the speed of business. Investors, Corporations, and Governments are buying new, differentiated data to gain visibility make better decisions. Don't fall behind. Let us help.