
Employment
In order to add some context to the multifamily performance metrics, first a quick look at the employment situation. According to data from the Bureau of Labor Statistics, the total civilian labor force participation rate entering 2020 was 63.3%. By the end of December, the total participation rate was 61.5%. This marked an improvement from the lowest recorded value of the year at the end of April when the participation rate was at 60.8%. However, more than four million fewer workers ended 2020 in the labor force compared to the beginning of the year.
From an unemployment perspective at the national level, the year opened with a 3.6% unemployment rate and peaked in April at 14.8% before ending the year at 6.7%. All told, roughly 10.75 million people were classified by the BLS as unemployed to close 2020. This represented an increase of about 4.9 million people during the year.
Multifamily National Annual Performance
Around 305,000 new units were delivered across the country throughout the year, up nearly 10,000 units compared to in 2019. While new supply increased slightly last year, apartment demand declined by 14% compared to the previous year. As unwelcome a development as that was, as recently as the end of August, national apartment demand was down 42% compared to the same eight-month portion of 2019.
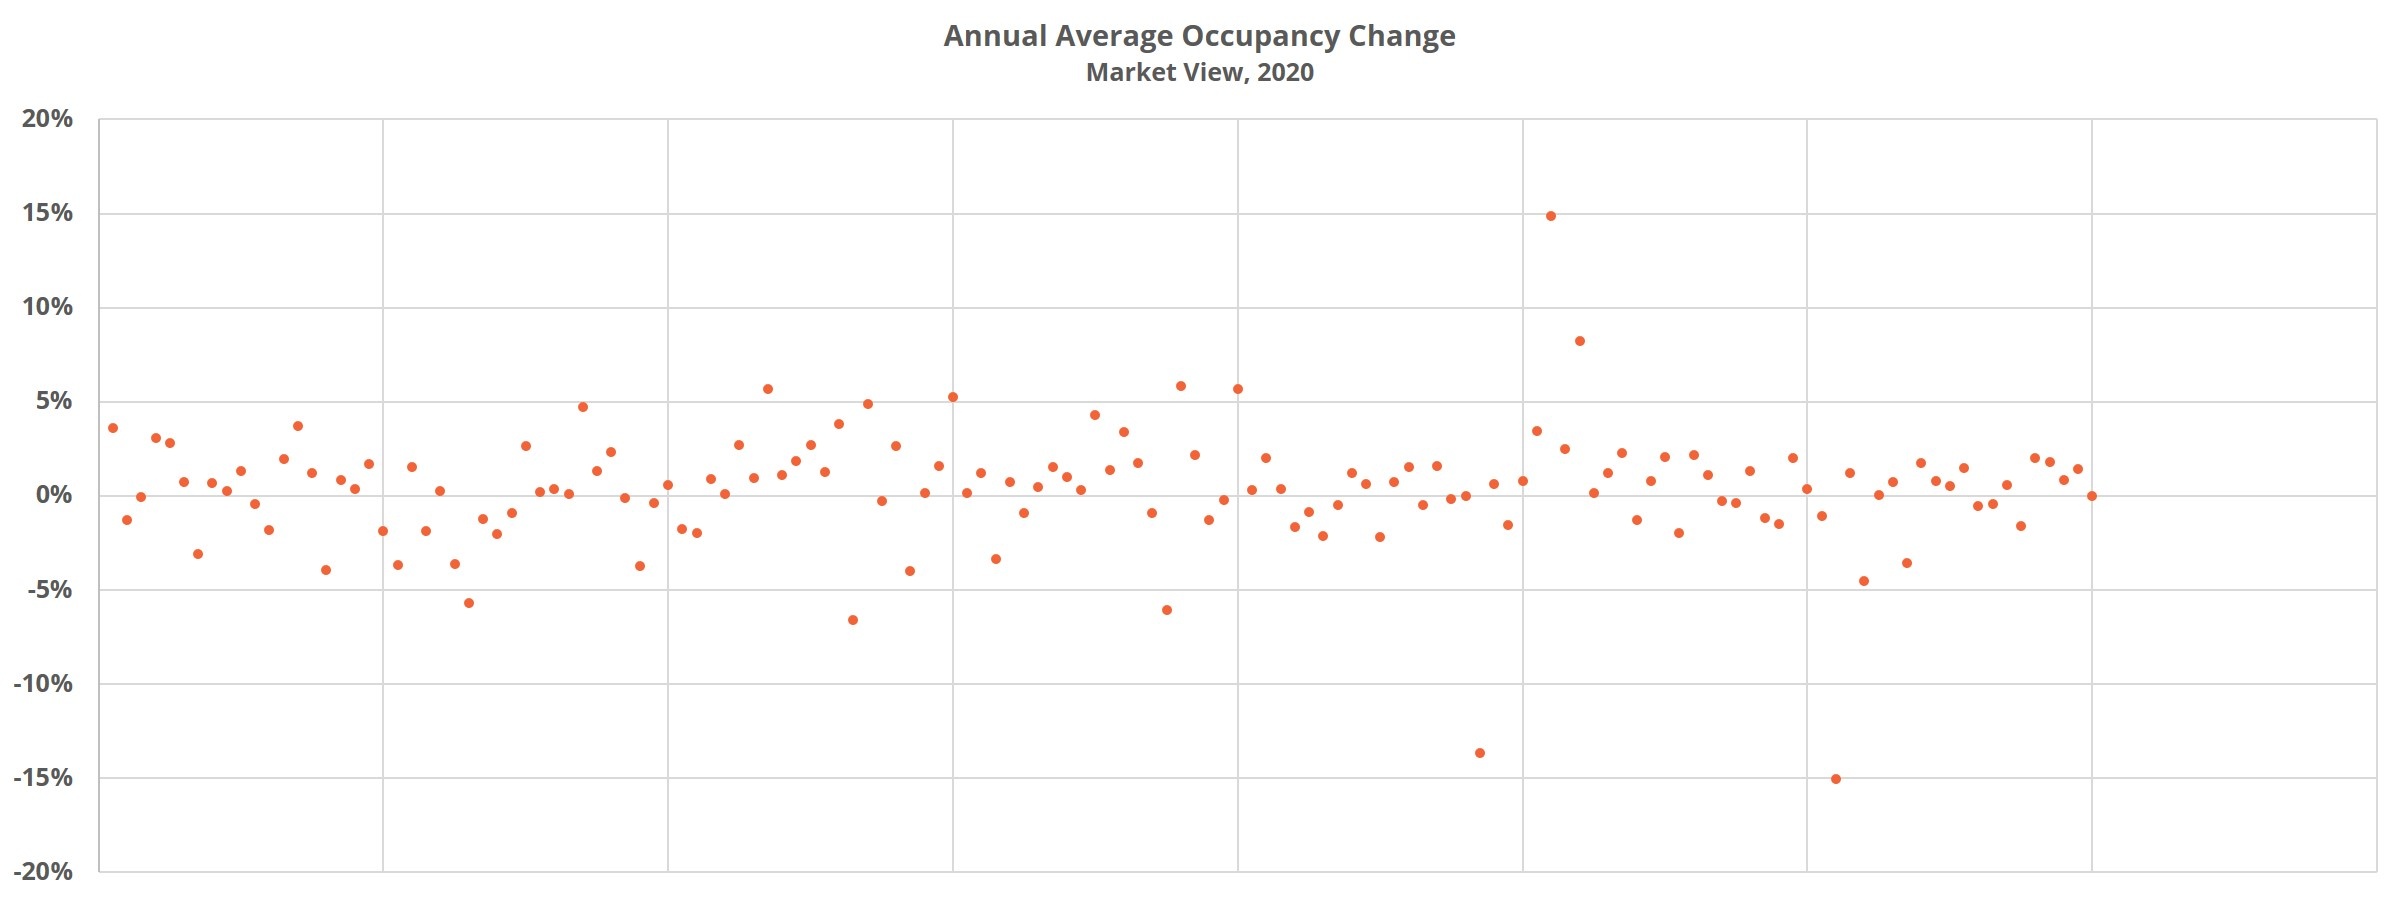
Net absorption for 2020 totaled approximately 271,000 units after 315,000 net previously unoccupied units were leased during 2019. The resulting impact on average occupancy was a 0.4% loss down to 91.8%. It should be noted that unlike in more typical environments, it cannot be assumed that full rent was collected for nearly all of those units during the full course of the year.
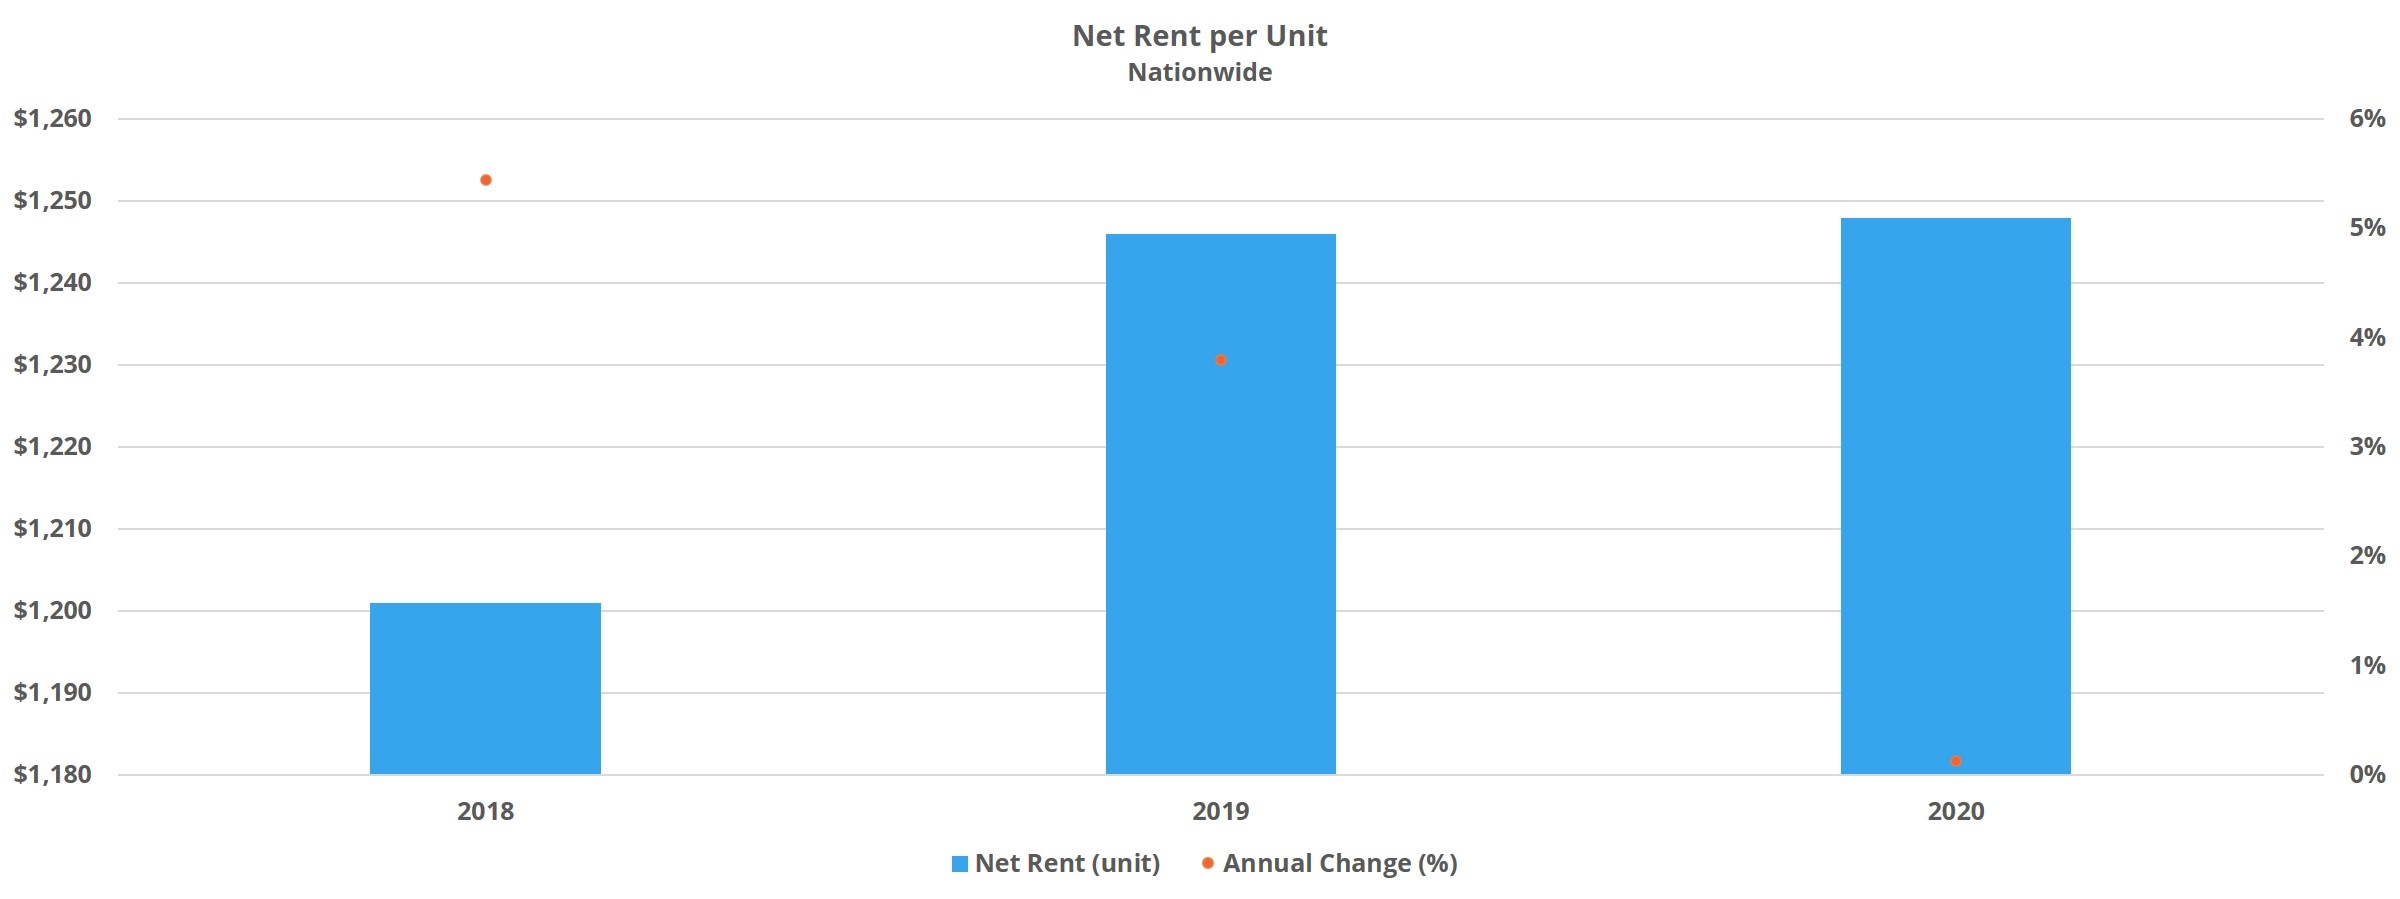
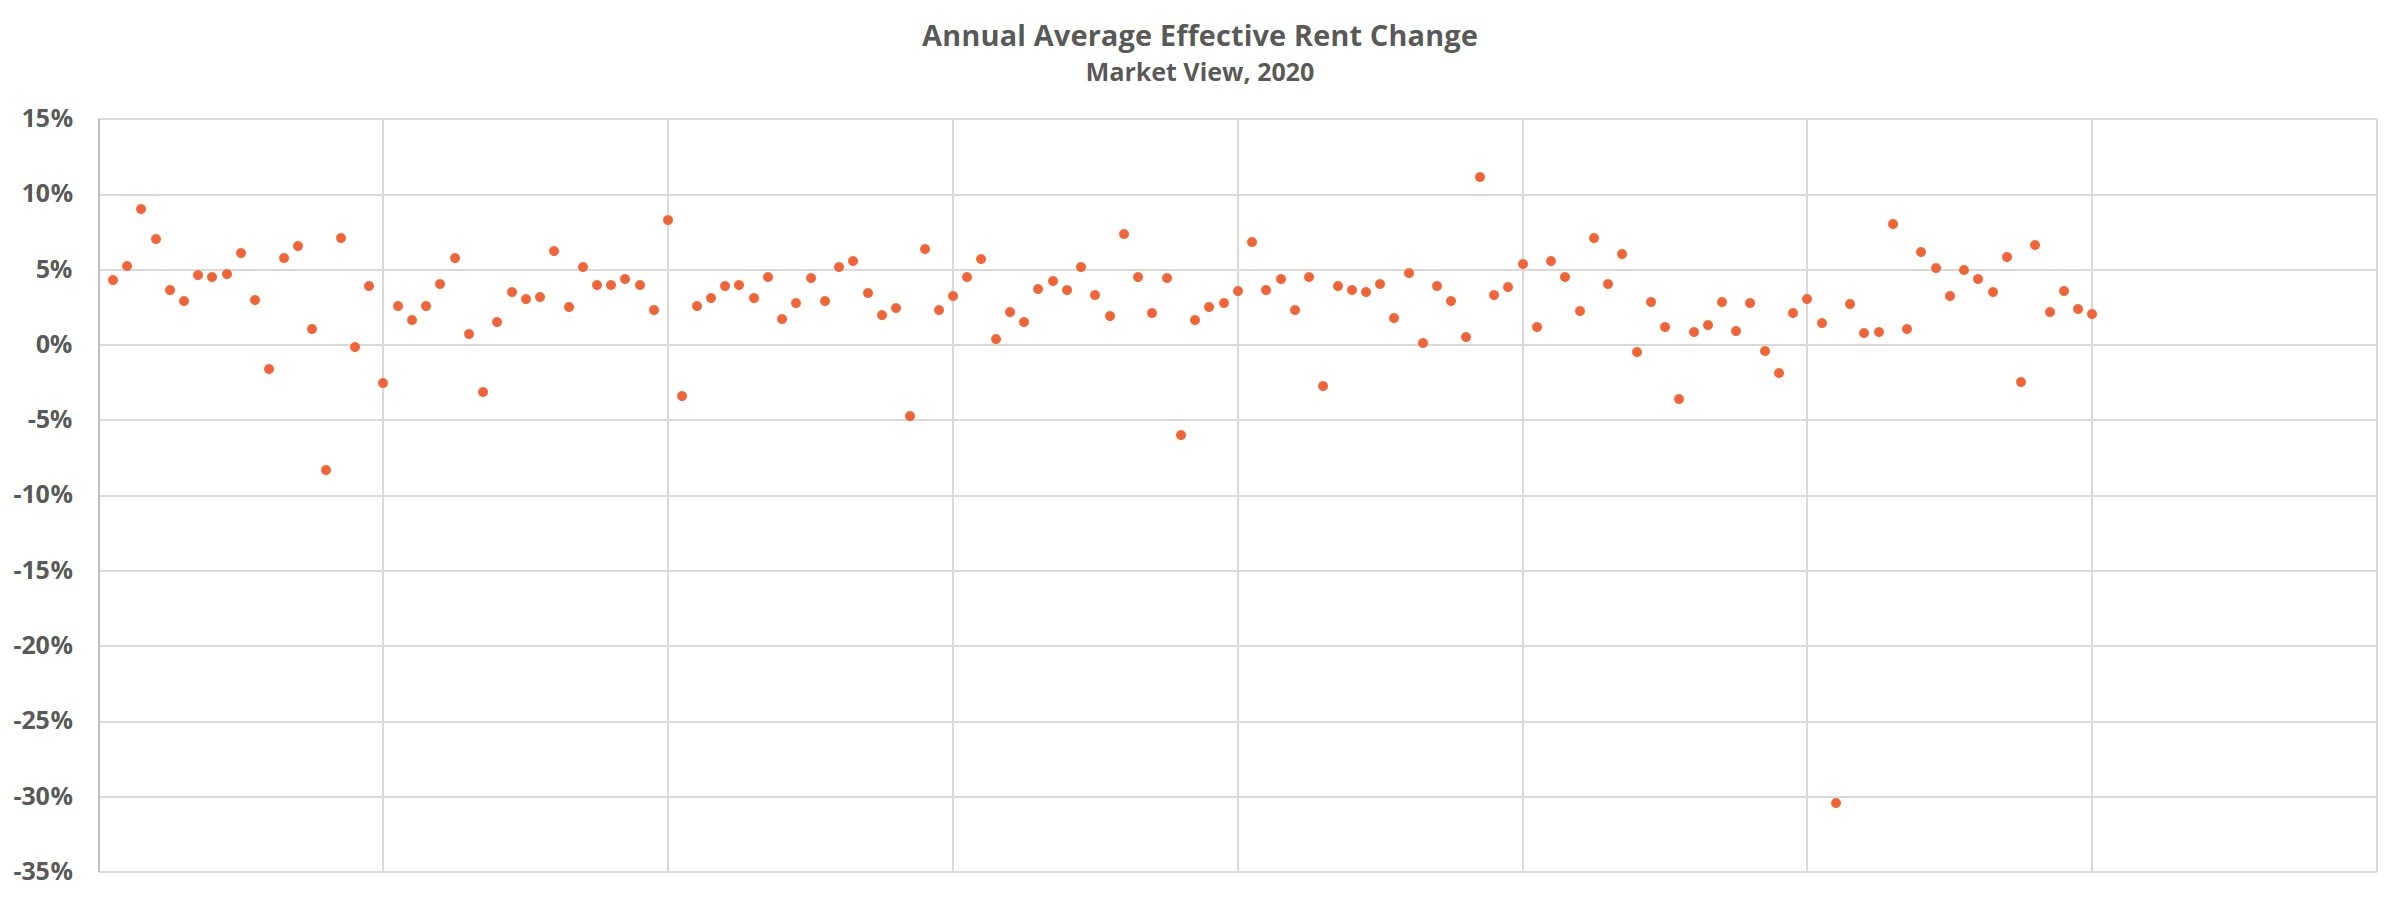
Average effective rent change managed to avoid negative territory, if only slightly, but this too was far from the level industry participants have grown accustomed to in recent years. A 0.5% annual increase left the average monthly unit rent at $1,360 to close the year. This small increase came after a 3.8% gain in 2019.
Of course, one factor that held back rent growth was an increased reliance on rent concessions. 20% of conventional properties nationwide finished 2020 offering a new lease discount, up 28% from the start of the year. In addition to increased availability, the average discount value also increased over the last year. The average discount value was equal to about three weeks off a 12-month lease to open the year and stood at four weeks off an annual lease at the close of the year.
Large Market Performance
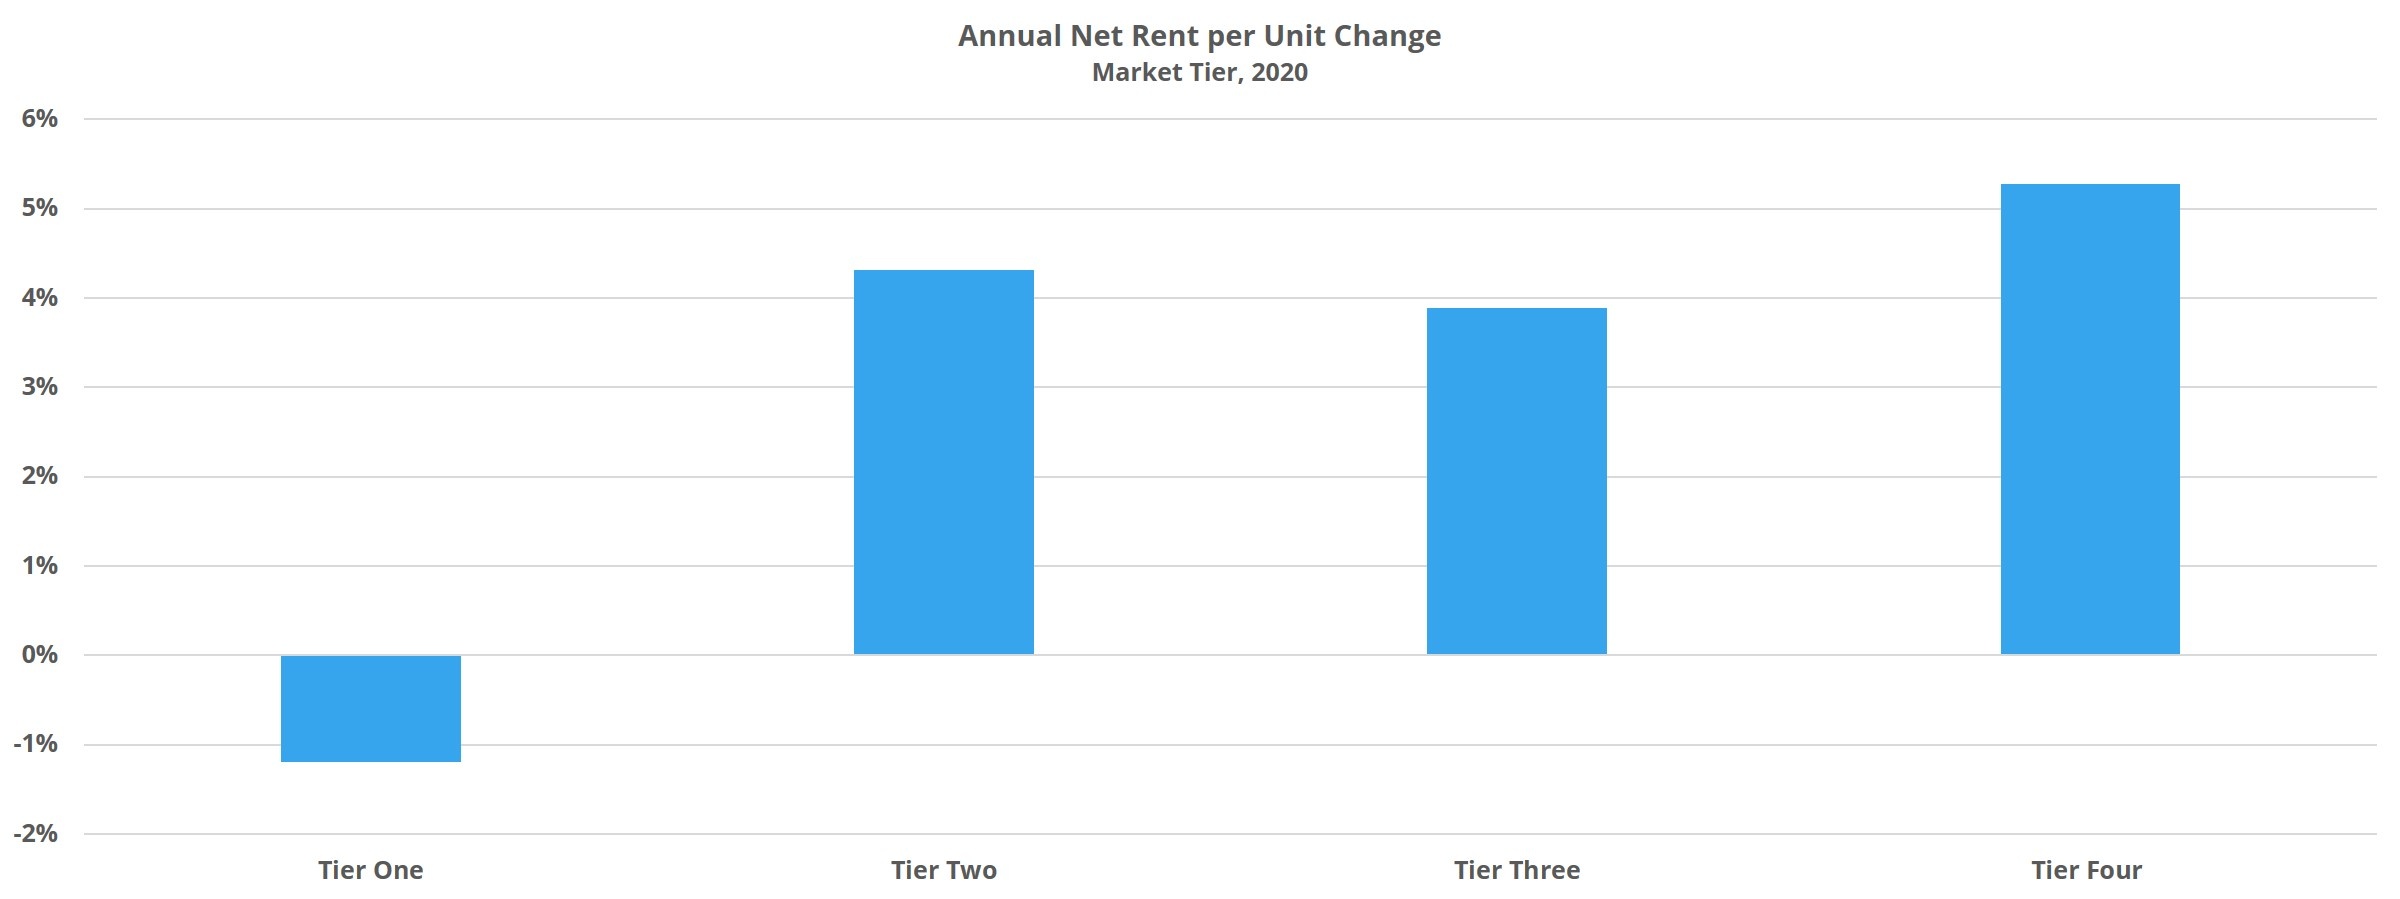
One theme that emerged from last year’s data was the difference between multifamily performance in the largest markets versus the rest of the country. ALN assigns each market to a tier, one through four, based on the size of the multifamily presence there. Tier One markets include the 33 largest markets in the country.
It was within this tier that 2020 results were most divergent from recent history, and not positively. This subset of markets were the only group of the four to lose ground in average occupancy, namely a 0.7% retraction to 91.5%. Similarly, average effective rent growth for these largest markets was -0.5% even as the remaining three tiers each gained at least 3%. Predictably, a major culprit there was increases in both the availability and average value of lease discounts that were larger than for the nation as a whole. Though, of the two, the 41% increase in concession availability during the year was the more significant change.
Drilling down further, it was a less than half of these 33 largest markets that drove these negative results for the tier as a whole. Areas such as New York City, Austin, Boston, Chicago, and San Francisco – Oakland were the hardest hit. Each lost 5% or more from an average net rent perspective, which accounts for both average occupancy and average effective rent change. In all, 13 of the 33 markets ended the year in negative territory for this metric.
Additional Observations
Despite the fact that 2020 was undoubtedly a down year for multifamily, it should not be assumed that poor results were logged across the board. As already mentioned, annual performance looks quite different for the market tiers outside the largest tier. Additionally, the most expensive properties were harder hit than some of the lower price classes. At the market and submarket levels, there was wide variance in performance.
Small Texas Markets
It was not only the largest markets that struggled in 2020. Among those areas falling into the bottom 10% of markets in net rent change were three small Texas markets. Leading the way, so to speak, was the astounding 41% net rent per unit decline in Midland – Odessa. This steep decline can largely be explained by the difficulties faced during the year by the energy sector, the major employment sector for the market.
Another contributing factor was the unfortunate timing of overdue new supply delivered both in 2019 and 2020. As recently as 2018 this area had the highest average effective rent in the state of Texas and average occupancy above 97%. After the introduction of new units over the last couple of years, and in the face of the downturn in the energy sector, Midland – Odessa suffered a net loss of almost 2,500 rented units in 2020. Average occupancy finished the year at 78% and annual average effective rent declined by 30%. This annual decrease in average rent brought the average unit from $1,371 per month to $954.
The other two small Texas markets to find themselves in the bottom 10% of markets in 2020 in net rent change were Laredo and San Angelo, losing 3.3% and 3.9% respectively. In each of these two markets, healthcare employers make up a significant portion of the employer base. Due to the limits for a good portion of the year on services that could be provided by healthcare providers in an attempt to manage the COVID-19 response, a reliance on the healthcare sector for employment was a detriment last year.
Specific Florida Markets
The Orlando and Miami markets also were among those areas hardest hit by the disruption of last year. While it is true that the Orlando economy has diversified beyond hospitality and tourism, these jobs still account for nearly one-quarter of employment there. Apartment demand remained strong, with net absorption surpassing 4,500 units during the year. The difficulty for the area was the delivery of about 7,500 new units.
Average occupancy declined by 1.2% to 90.3%, but the real pain point was on the rent side. Average effective rent declined by 3.1% after the availability of rent concessions more than doubled during the year. 30% of conventional properties finished 2020 offering a new lease discount, up from only 13% of properties at the start of the year.
In Miami, in addition to being a popular tourism destination, a top employer make-up including multiple healthcare organizations, public and higher education, and travel companies like American Airlines and Carnival Cruises hindered industry performance. As with Orlando, new supply took a toll on the final annual numbers. A net gain of 3,000 rented units was not enough to offset the impact of 8,000 new units delivered. As a result, average occupancy declined by about 6% to just above 85%.
Unlike Orlando, rent growth did remain in positive territory. A 0.7% annual increase brought the average unit to $1,770 per month. The availability of lease discounts did increase, but the more robust change was to the average discount value. After a 24% annual gain, the average discount at the end of the year was five weeks off a 12-month lease.
Takeaways
At the national level, apartment demand was down last year compared to 2019 but not to the extent seen at earlier points in the year. New supply was up from 2019, and this helped propel average occupancy down slightly. Rent growth did not move into negative territory but was significantly lower than in recent years.
The good news was that the top line numbers for the country as a whole were skewed, of course, by the largest markets in the country. It was within the subset of Tier One markets that both average occupancy and average effective rent declined. For the remainder of market tiers, both metrics were in positive territory – especially so on the rent growth front.
Looking ahead into 2021 and beyond, the success of the COVID-19 vaccine rollout and the extent to which more typical economic activity can resume will be the determining factor for industry performance. The new construction pipeline will continue delivering units apace, so the continuation of the recent improvement in apartment demand will be key.
To learn more about the data behind this article and what ALN Apartment Data has to offer, visit https://alndata.com.


Sign up to receive our stories in your inbox.
Data is changing the speed of business. Investors, Corporations, and Governments are buying new, differentiated data to gain visibility make better decisions. Don't fall behind. Let us help.


Sign up to receive our stories in your inbox.
Data is changing the speed of business. Investors, Corporations, and Governments are buying new, differentiated data to gain visibility make better decisions. Don't fall behind. Let us help.