×
The email you entered is not valid.
Real Estate

Top 10 Northeast U.S. Housing Markets More Vulnerable to the Impact of the Coronavirus Pandemic

Source: https://www.attomdata.com/news/market-trends/figuresfriday/top-10-northeast-u-s-housing-markets-more-vulnerable-to-the-impact-of-the-coronavirus-pandemic/

According to ATTOM Data Solutions’ newly released Q4 2020 Special Coronavirus Report spotlighting county-level housing markets around the U.S. that are more or less vulnerable to the impact of the virus pandemic, pockets of the Northeast and other parts of the East Coast remained most at risk in Q4 2020, while the West continued to be less vulnerable.

ATTOM’s most recent Coronavirus housing impact analysis reported that New Jersey, Illinois, California, Louisiana, New York, Florida and Maryland had 40 of the 50 counties most vulnerable to the economic impact of the pandemic in Q4 2020. Those markets included eight suburban counties in the New York City metro area, four around Philadelphia, PA, and two near Washington, D.C., while six were in the Chicago, IL, suburbs and two were in the St. Louis, MO area.

The analysis noted the fourth-quarter trends generally continued those found in Q3 2020, but with different concentrations around several major metro areas. The number of counties among the top 50 most at-risk was up from five to eight in the New York, NY, area and from three to six in the Chicago, IL, area, but down from four to two in the Washington, D.C., region and from four to one in the Baltimore, MD area.

ATTOM’s Q4 2020 special report also noted that five of the seven western counties in the top 50 were in northern California, while Illinois had eight of the nine midwestern counties among those most vulnerable. Outside of Florida and Maryland, the only southern state with more than two counties in the top 50 was Louisiana.

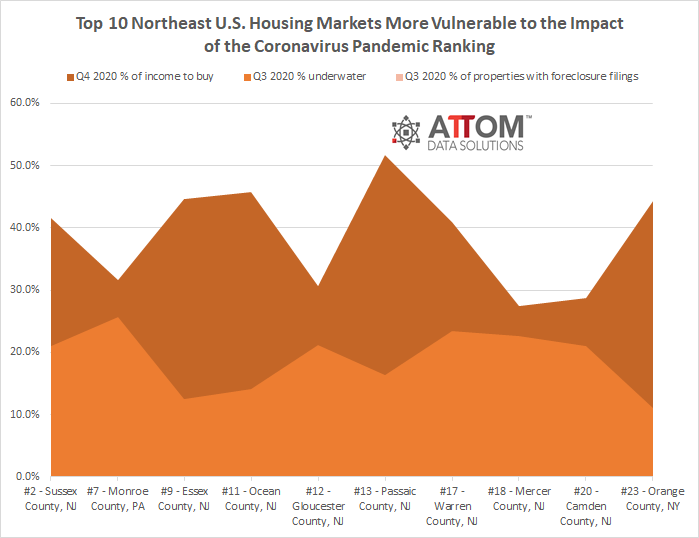
In this post, we take a closer look at those regions both more and less vulnerable to the impact of the Coronavirus pandemic in Q4 2020, to reveal where the top 10 counties in each category ranked and why. The top 10 markets in the Northeast that were more vulnerable to the impact of the Coronavirus pandemic in the fourth quarter included:

#2 – Sussex County, NJ

  • 6% of income needed to buy
  • 1% underwater
  • 04% of properties with foreclosure filings

#7 – Monroe County, PA

  • 5% of income needed to buy
  • 7% underwater
  • 06% of properties with foreclosure filings

#9 – Essex County, NJ

  • 7% of income needed to buy
  • 5% underwater
  • 05% of properties with foreclosure filings

#11 – Ocean County, NJ

  • 8% of income needed to buy
  • 1% underwater
  • 03% of properties with foreclosure filings

#12 – Gloucester County, NJ

  • 6% of income needed to buy
  • 1% underwater
  • 06% of properties with foreclosure filings

#13 – Passaic County, NJ

  • 7% of income needed to buy
  • 3% underwater
  • 02% of properties with foreclosure filings

#17 – Warren County, NJ

  • 9% of income needed to buy
  • 4% underwater
  • 02% of properties with foreclosure filings

#18 – Mercer County, NJ

  • 5% of income needed to buy
  • 6% underwater
  • 06% of properties with foreclosure filings

#20 – Camden County, NJ

  • 7% of income needed to buy
  • 1% underwater
  • 05% of properties with foreclosure filings

#23 – Orange County, NY

  • 4% of income needed to buy
  • 0% underwater
  • 04% of properties with foreclosure filings

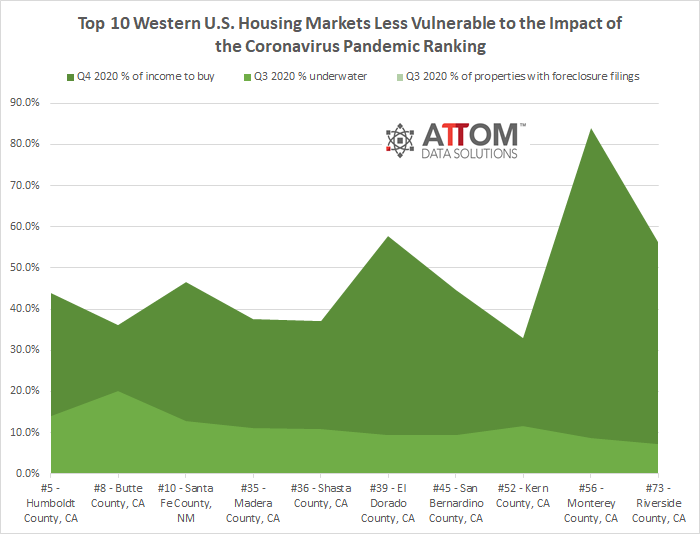
On the other end of the spectrum, the top 10 markets in the West that were less vulnerable to the impact of the Coronavirus pandemic in the fourth quarter included:

#5 – Humboldt County, CA

  • 8% of income needed to buy
  • 0% underwater
  • 06% of properties with foreclosure filings

#8 – Butte County, CA

  • 0% of income needed to buy
  • 1% underwater
  • 04% of properties with foreclosure filings

#10 – Santa Fe County, NM

  • 7% of income needed to buy
  • 8% underwater
  • 04% of properties with foreclosure filings

#35 – Madera County, CA

  • 5% of income needed to buy
  • 1% underwater
  • 04% of properties with foreclosure filings

#36 – Shasta County, CA

  • 0% of income needed to buy
  • 8% underwater
  • 05% of properties with foreclosure filings

#39 – El Dorado County, CA

  • 8% of income needed to buy
  • 4% underwater
  • 04% of properties with foreclosure filings

#45 – San Bernardino County, CA

  • 7% of income needed to buy
  • 4% underwater
  • 04% of properties with foreclosure filings

#52 – Kern County, CA

  • 9% of income needed to buy
  • 6% underwater
  • 05% of properties with foreclosure filings

#56 – Monterey County, CA

  • 9% of income needed to buy
  • 6% underwater
  • 03% of properties with foreclosure filings

#73 – Riverside County, CA

  • 3% of income needed to buy
  • 3% underwater
  • 04% of properties with foreclosure filings

To learn more about the data behind this article and what Attom Data Solutions has to offer, visit https://www.attomdata.com/.

GET WEEKLY ALERTS

Sign up to receive our stories in your inbox.

The email you entered is not valid.

LET US HELP

Data is changing the speed of business. Investors, Corporations, and Governments are buying new, differentiated data to gain visibility make better decisions. Don't fall behind. Let us help.

DATA PROVIDER SPOTLIGHT

Advan

Advan provides hedge funds and institutional investors with unmatched insights into both foot and vehicle traffic to enable better investment decisions. Using precise, manual geofencing, it has the most extensive and accurate location data, available in seconds through an intuitive, self-service dashboard. Its institutional-grade analytics allow fast and actionable insights into customer behavior and corporate activity.

Advan is headquartered in New York City. For more information please visit www.advan.us

GET WEEKLY ALERTS

Sign up to receive our stories in your inbox.

The email you entered is not valid.

LET US HELP

Data is changing the speed of business. Investors, Corporations, and Governments are buying new, differentiated data to gain visibility make better decisions. Don't fall behind. Let us help.

DATA PROVIDER SPOTLIGHT

Advan

Advan provides hedge funds and institutional investors with unmatched insights into both foot and vehicle traffic to enable better investment decisions. Using precise, manual geofencing, it has the most extensive and accurate location data, available in seconds through an intuitive, self-service dashboard. Its institutional-grade analytics allow fast and actionable insights into customer behavior and corporate activity.

Advan is headquartered in New York City. For more information please visit www.advan.us