In today’s Insight Flash, we take advantage of our newly launched UK channel data to do a deep dive on how online shopping behavior has changed in the Apparel, Accessories & Footwear world since the COVID-19 Pandemic. We break out online vs. offline spend growth for the overall industry and included subindustries, as well as the percentage of sales through each channel by subindustry.
For Apparel, Accessories & Footwear in the UK, online growth outpaced offline growth even in 2019. Online spend growth was positive for the first seven months of 2019 while offline growth was negative. And even though online trends turned negative in the next few months pre-pandemic, offline trends were more negative still. As for most industries, online spend growth in Apparel, Accessories & Footwear jumped in April 2020 to 5%, quickly accelerating to double digits through October before jumping 46% in November ahead of the holiday season. New waves of shutdowns have kept that growth elevated through February.
Online vs. Offline Industry Spend Growth

Within Apparel, Accessories & Footwear in the UK, the highest online spend growth came from Jewelry (Non-Luxury) over the last year, followed by Footwear/Athletic Apparel and Intimate Apparel/Accessories. Each of these saw spend double over the last year. Among subindustries that saw even online sales collapse due to the pandemic, the most dramatic was Formalwear, with online spend cut almost in half. Men’s Apparel/Accessories and Plus-Size Apparel/Accessories also saw online sales declines, albeit more modest ones.
Online vs. Offline Subindustry Spend Growth

Note: 364 days ending 3/20/2021 vs. 364 days ending 3/21/2020; tagged spend only
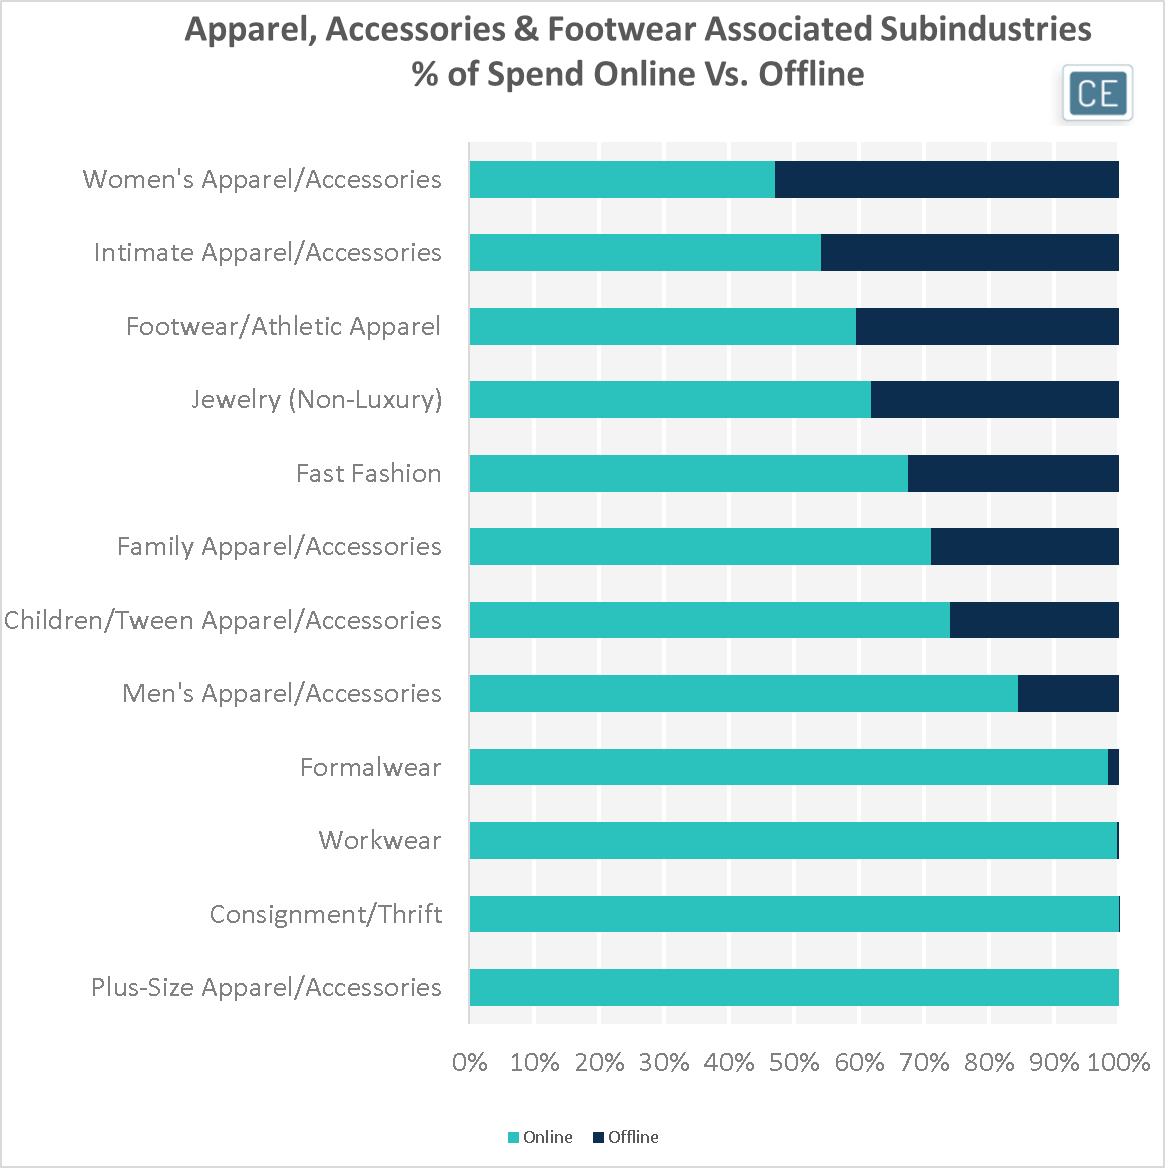
Among the Apparel, Accessories & Footwear brands tracked in our UK data, Women’s Apparel/Accessories was the most likely to draw shoppers out of their homes with 53% of sales offline. This was the only subindustry where offline sales were higher than online sales. Intimate Apparel/Accessories was the next highest in-store skew at 46%, followed by Footwear/Athletic Apparel at 41%. In the data we are capturing, all other UK subindustries had at least 60% of sales online.
Online vs. Offline Subindustry Share

Note: 364 days ending 3/20/2021; tagged spend only, 100% online sales may be due to selection of tagged brands
To learn more about the data behind this article and what Consumer Edge Research has to offer, visit www.consumer-edge.com.


Sign up to receive our stories in your inbox.
Data is changing the speed of business. Investors, Corporations, and Governments are buying new, differentiated data to gain visibility make better decisions. Don't fall behind. Let us help.


Sign up to receive our stories in your inbox.
Data is changing the speed of business. Investors, Corporations, and Governments are buying new, differentiated data to gain visibility make better decisions. Don't fall behind. Let us help.


