Welcome (back) to the PlaceIQ Social Distance Tracker.
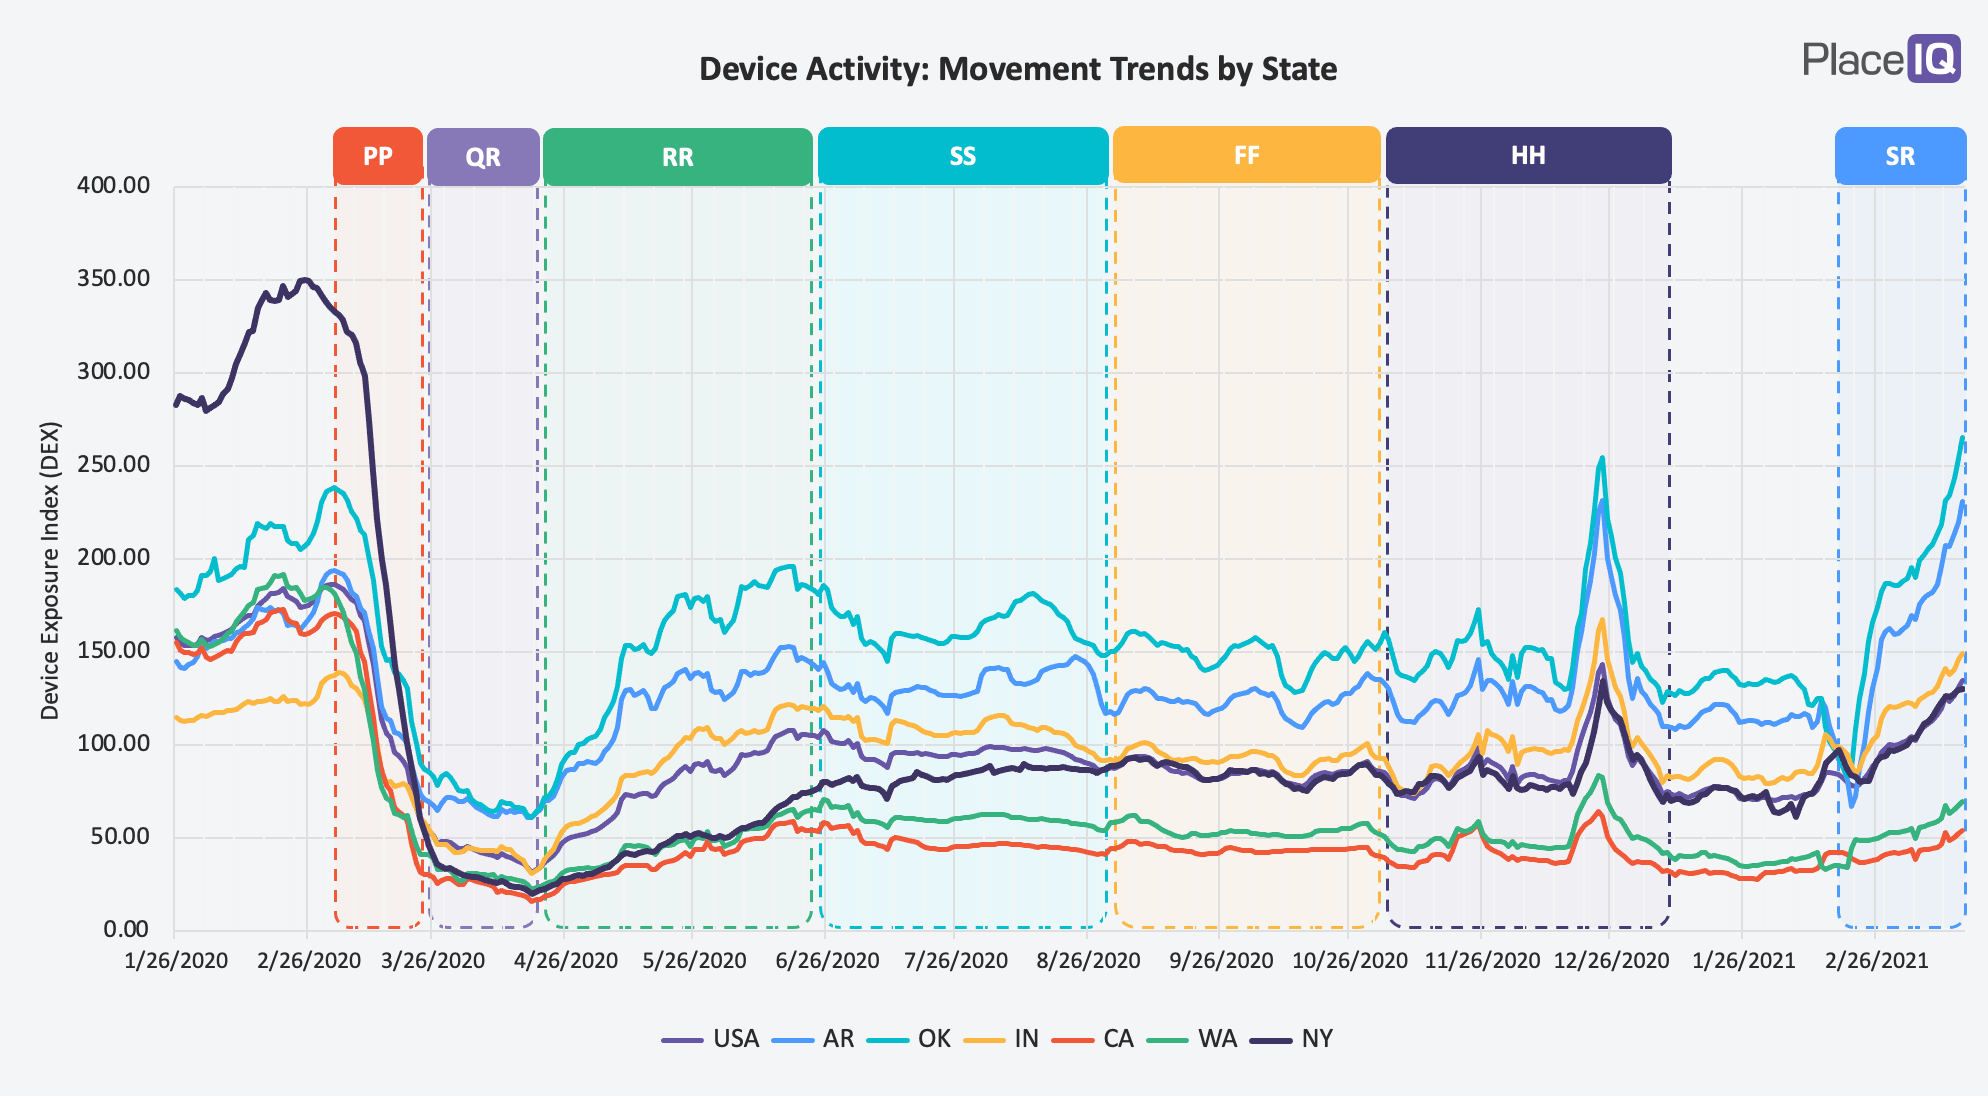
Today we’re going to look at our Second Reemergence. Foot traffic has dramatically increased over the last few weeks as quarantine fatigue, vaccinations, declining case counts, weather, and more encouraged us to leave our homes en masse. We’re not back to normal. Like our first reemergence last Spring, traffic is distributed differently and highly regional. But even still: we haven’t seen activity like this in quite some time.
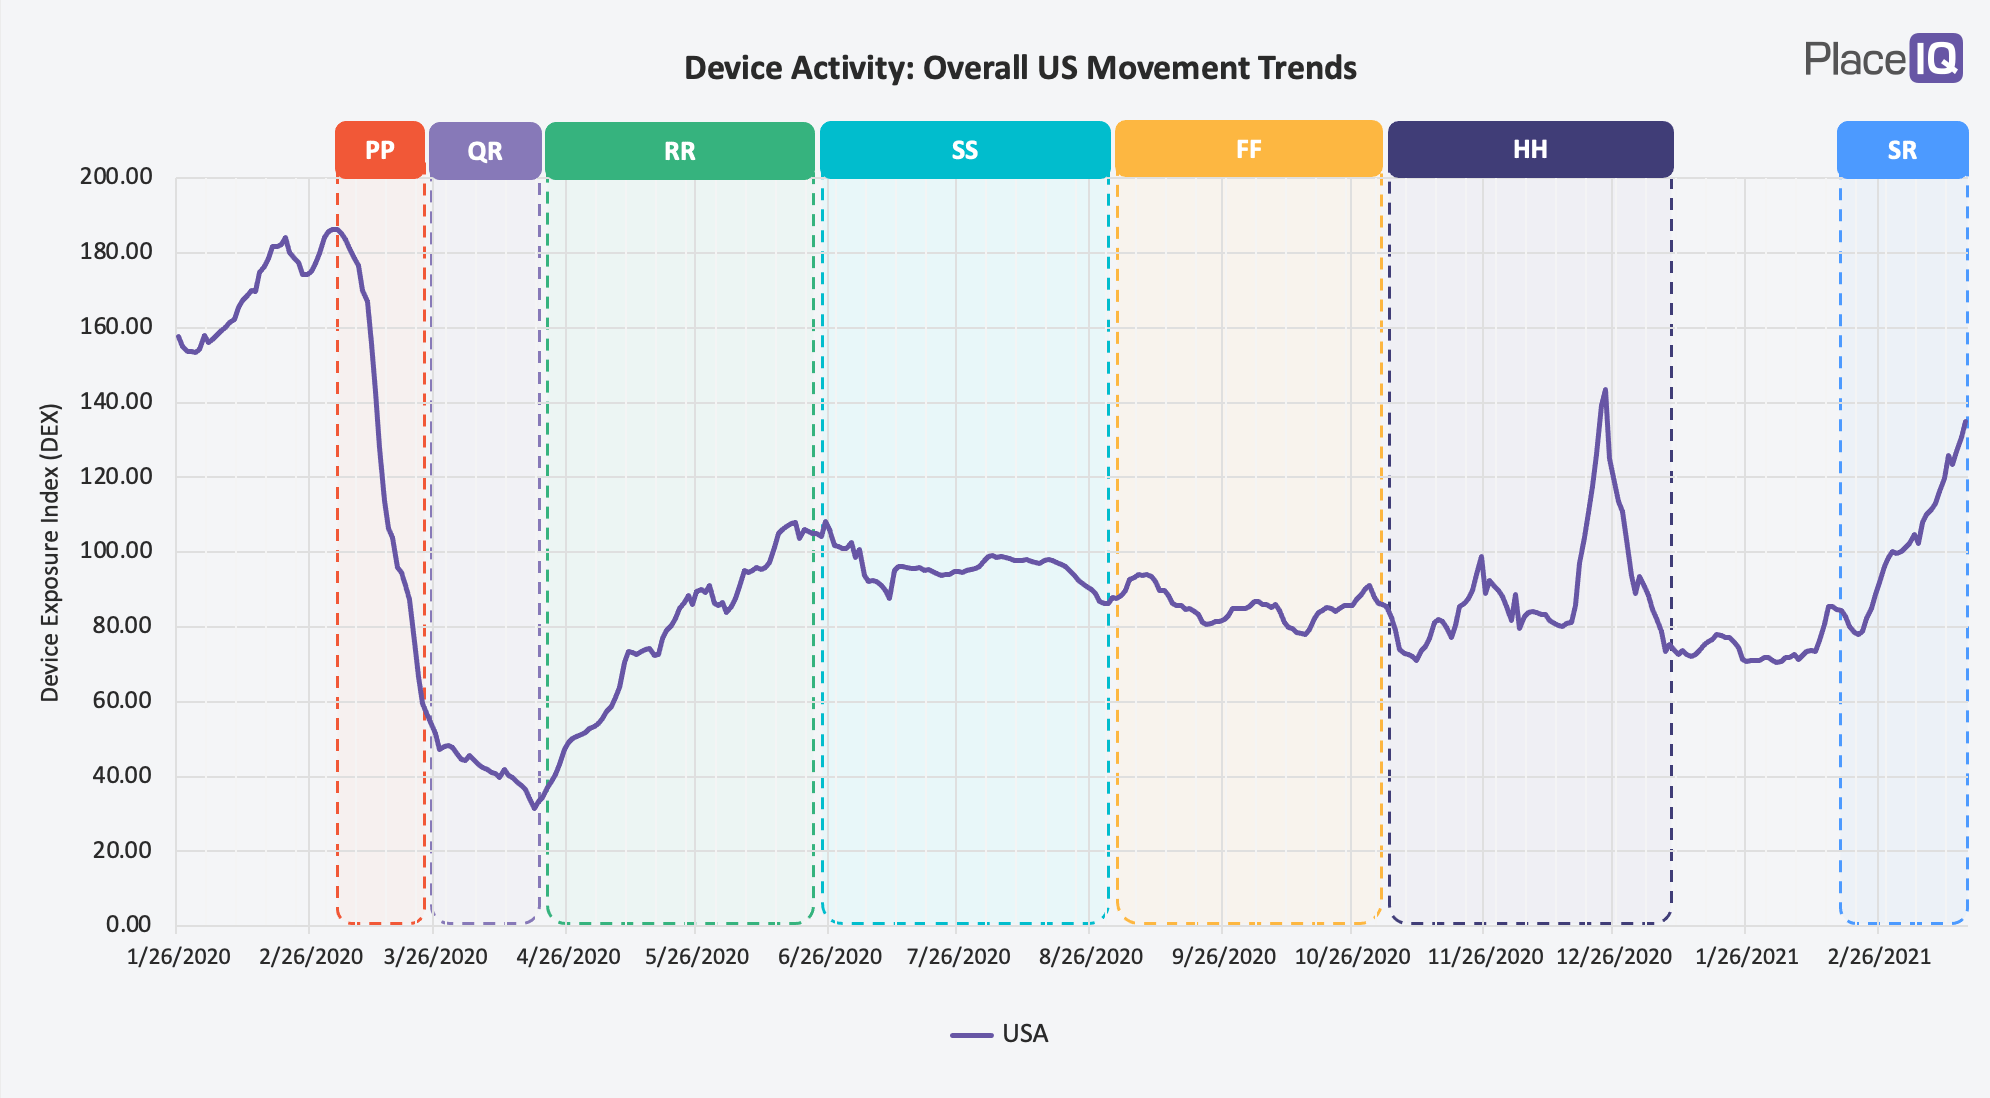
The spike is so high at first we thought it was a bug. But no, it’s very real. More on that below.
The Social Distance Tracker has been quiet in Q1. In lieu of our usual trip to Las Vegas for CES where we execute a learning agenda, we decided to hold our own virtual conference to review major trends, case studies, and learnings from 2020. The response we met was amazing and included over 100 executive briefings in the last couple of months.
Today, we’re back to talk about some significant changes afoot, and our dispatches will be returning to our usual pace in the coming weeks as we follow these new trends.
Our Second Reemergence
Around February 20th, it appears someone fired a starter pistol loud enough for most of the US to hear it. Overall device activity shot up so quickly we felt pretty confident the signal was an error:

We dove into our data and pipelines, looking for the culprit. But traffic was up for every data source, across a wide array of applications. Google and Apple hadn’t tweaked their location APIs. The data did vary, but in ways that suggested human changes not infrastructure, software, or data errors.
This rapid rise in movement data is very real, as evidenced by expected regional variation, expected category variation, and corroborating 3rd party data.
Reemergence Remains Regional & Cultural
For example, the rise in overall mobility varied significantly by region. Breaking down the figures by state we saw some states shot up (like Arkansas, Oklahoma, and South Dakota) while others barely moved (like California, Washington, and Hawaii):
Some states shifted upwards over 40% compared to their January lulls while others ticked up only a few digits:
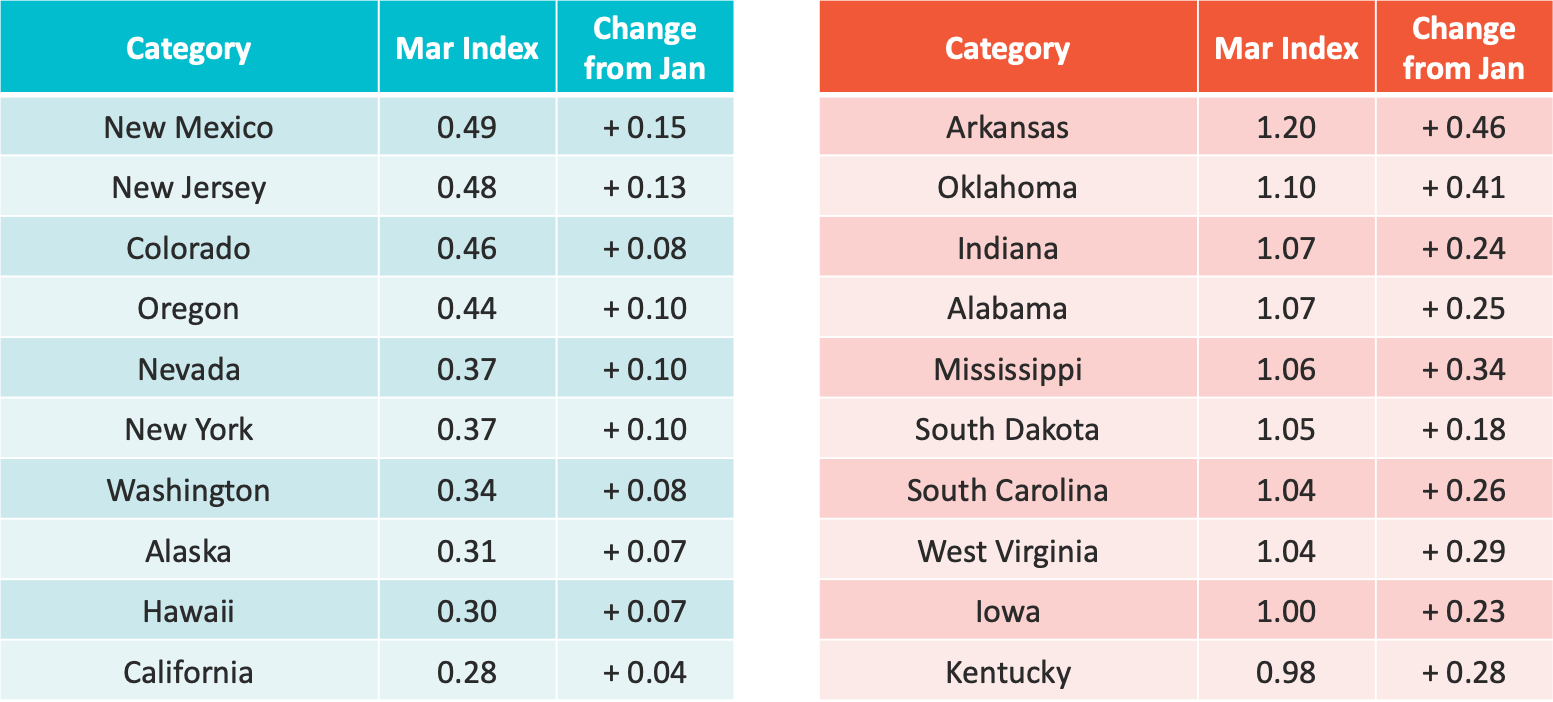
Looking at the table above, a very clear pattern emerges that suggests this spike reflects actual human behavior: the top 10 and bottom 10 states, by overall movement change compared to January, perfectly map to political proclivity. Those states posting the biggest activity gains all went for Trump, while those states which stayed relatively stable went for Biden.
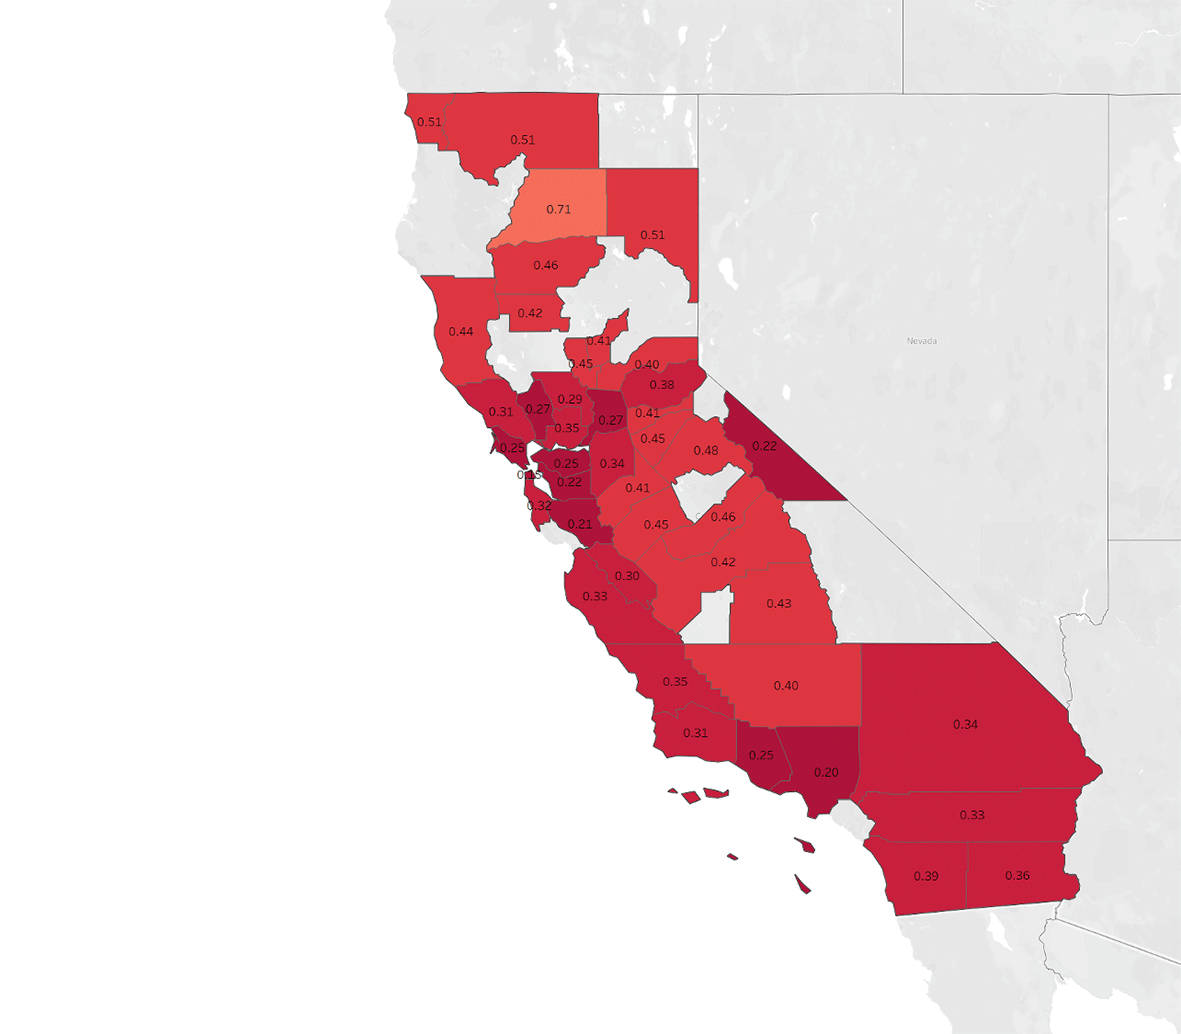
And, as we’ve noted many times before, regional variation doesn’t stop at state lines. If we zoom down to California’s counties we can see a wide range of activity indexes (compared to pre-COVID norms). San Francisco represents a low of 15%, with the general highs topping out in the high 40%’s (with one 71% outlier).
Categories are Returning at Different Rates
Way back in June we identified a general pattern which has held true: venue categories fall into one of three clusters that define their reaction to rising and falling case rates.
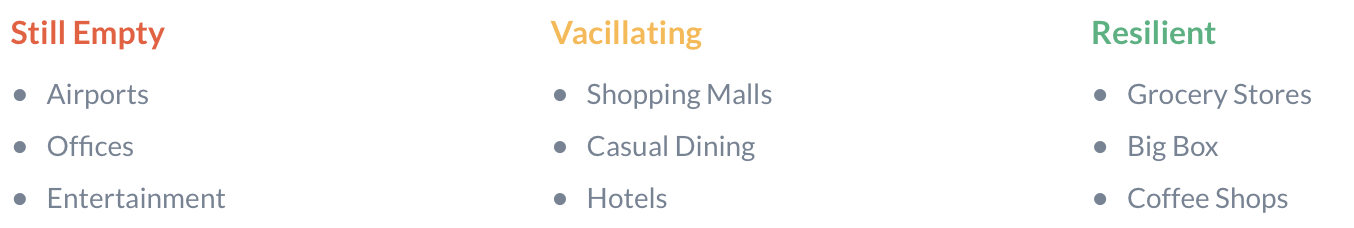
This framework was especially true during the holiday, when case counts were high but people still went out for holiday essentials. Trips were consolidated into ‘Resilient’ venues and pulled away from ‘Vacillating’ specialty retailers.
If the spike we’re seeing today isn’t a mirage or a data issue, we’d expect this framework to hold and the most significant gains to come from ‘Vacillating’ venues whose fortunes are dependent on lower case counts and/or general less risk (due to customers being increasingly vaccinated). This is what we’re seeing:
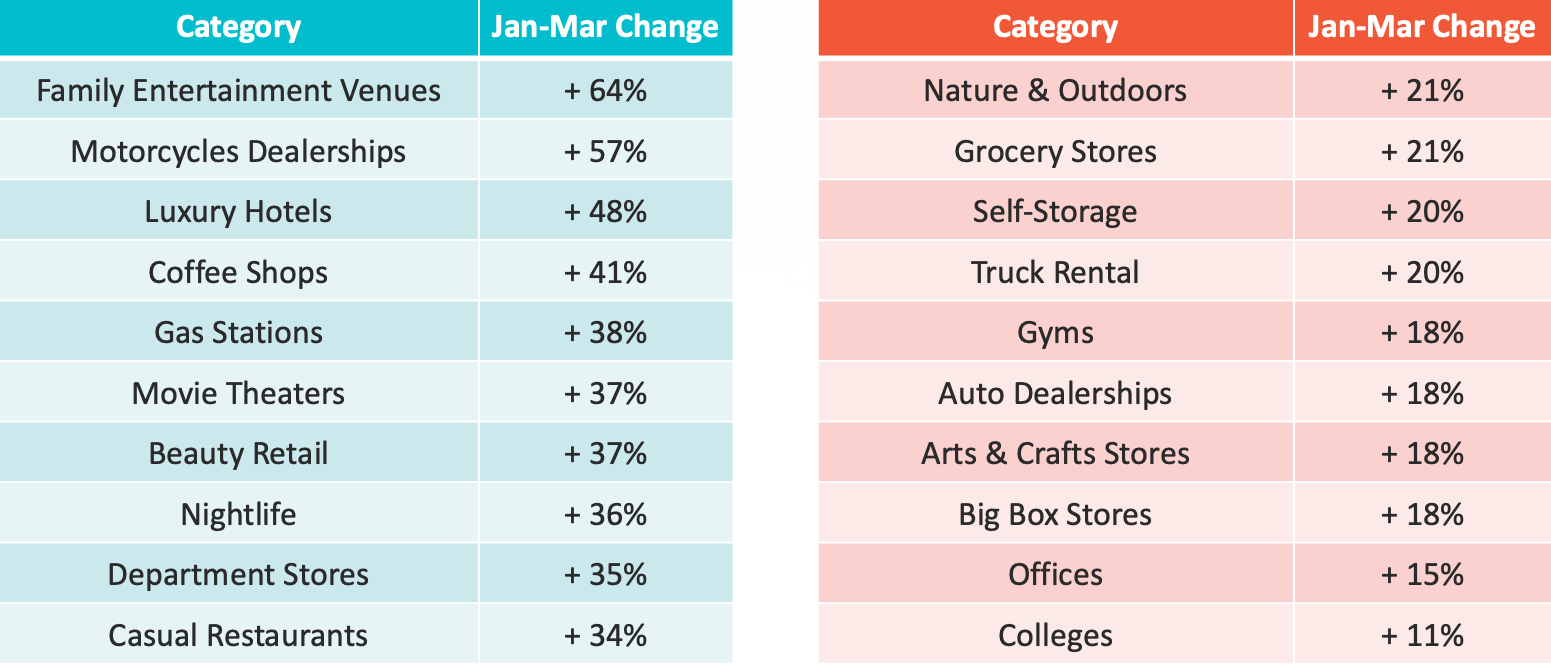
Traffic still rises for grocery and big box stores, but it’s a significantly smaller shift compared to ‘Vacillating’ venues like bars, casual restaurants, movie theaters, luxury hotels, and entertainment venues.
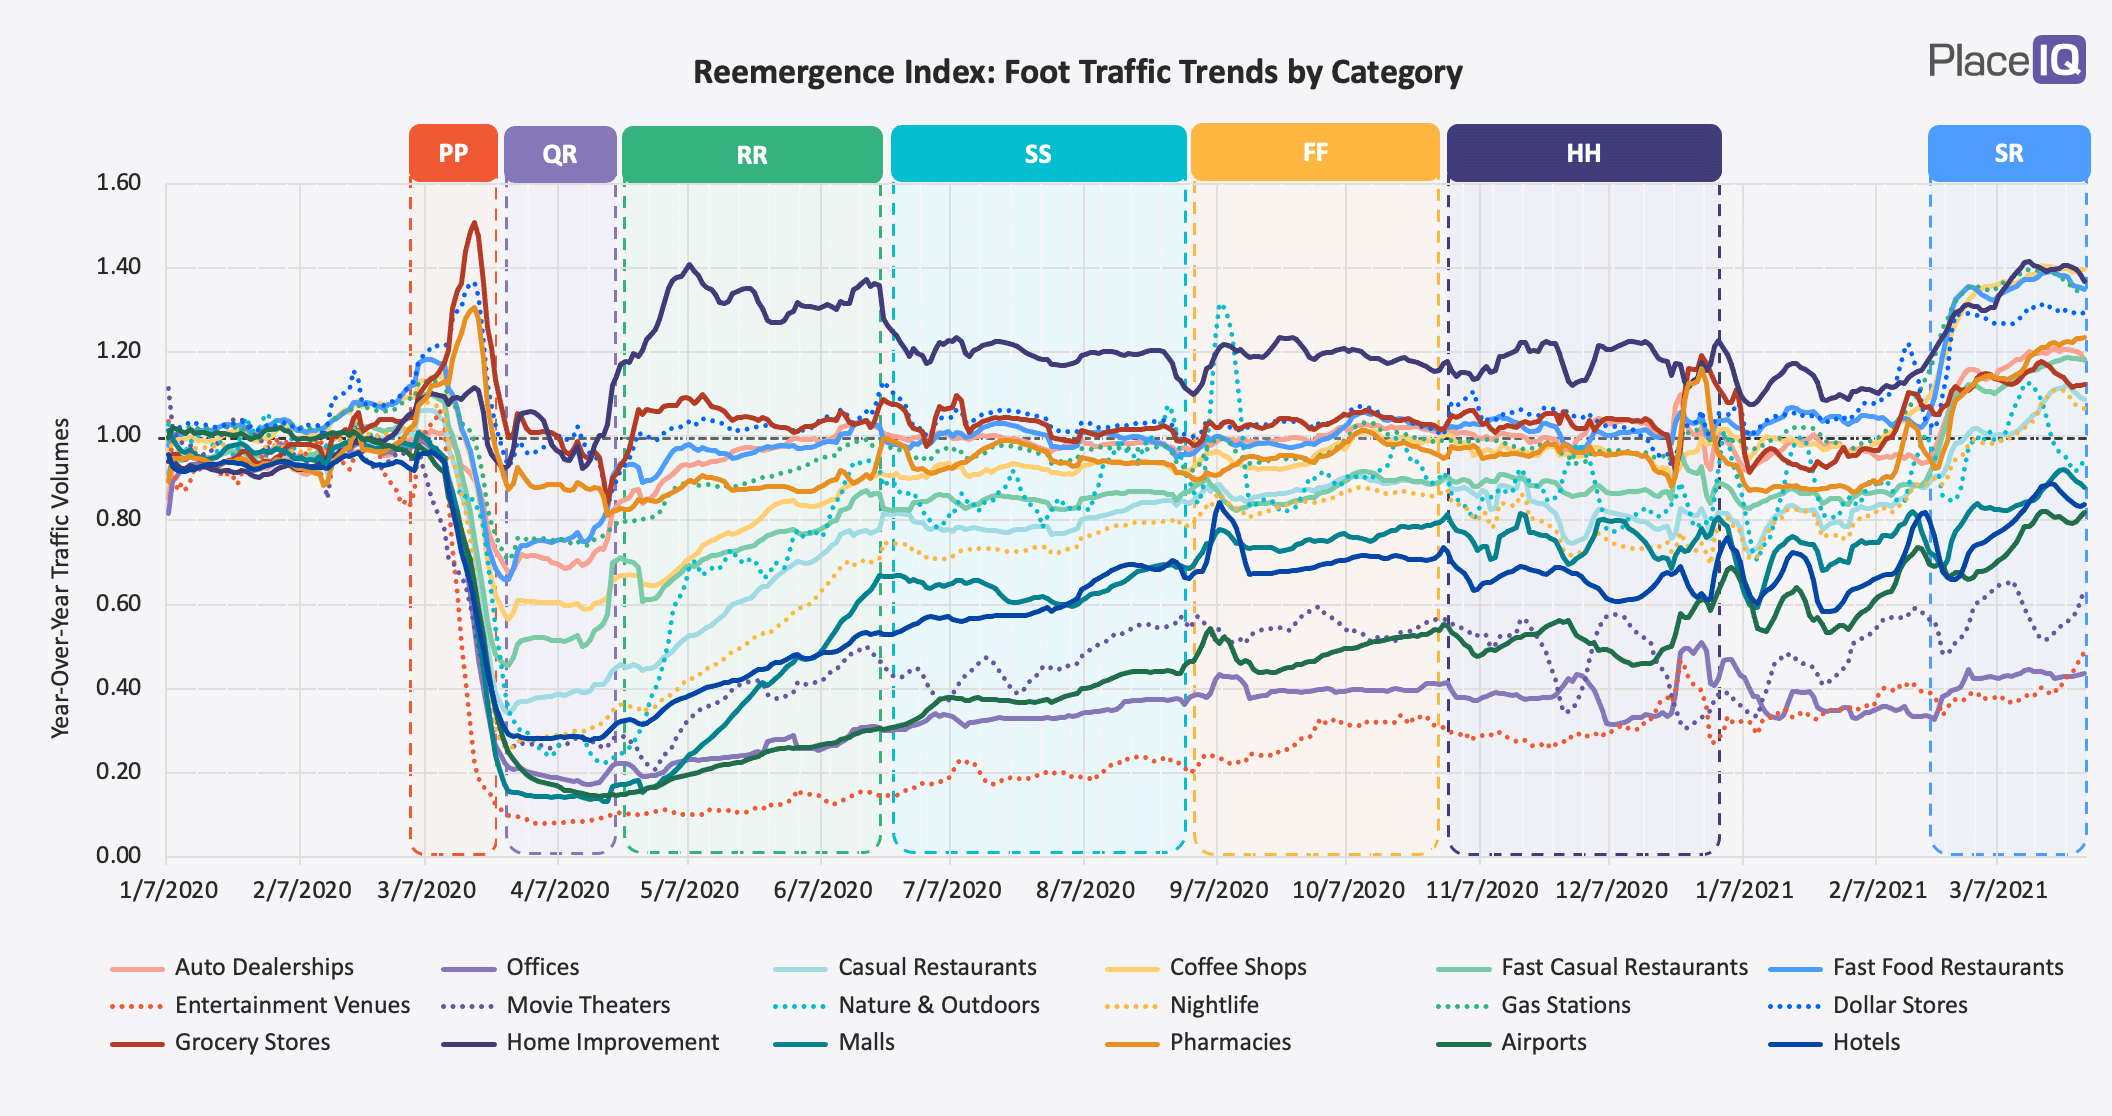
Here’s the full category index view:
But let’s zoom in a bit and look at a few exemplary trends
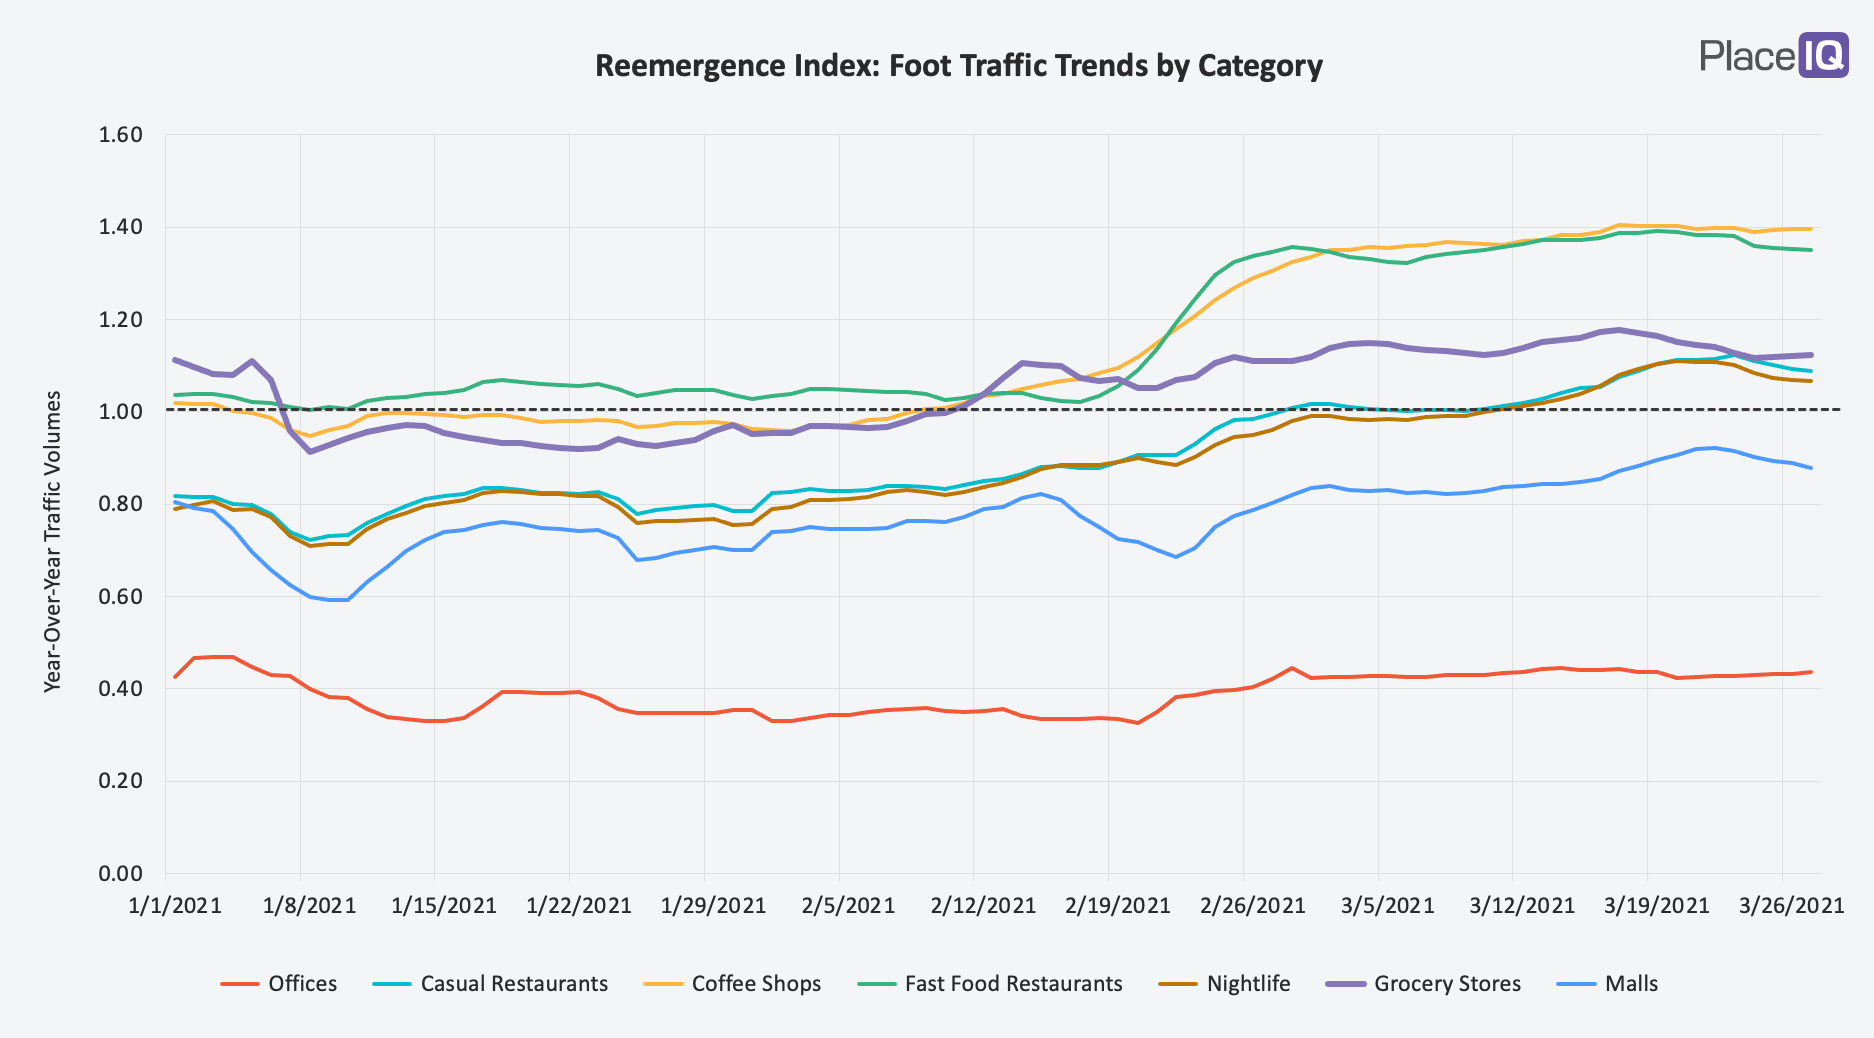
As noted, grocery stores are up, but we aren’t seeing a relative gain as strong those for malls or restaurants. The venues or behaviors we avoided out of caution are the most likely to reap the benefits of reemergence.
That avoided categories benefit most from rising traffic as cases decline and vaccines pick up strongly hints that most people will return to their pre-COVID norms when all of this is over. This is significant!
We’re continually asked which pandemic behaviors will stick and which will revert. Will people continue to cook at home more? Will remote work continue? Will we continue to bike, hike, and camp at record rates? Will we continue to keep our sourdough starters alive? These spikes, and the way they’re distributed among destination categories, suggest there is a pent up demand for pre-COVID normalcy. While this doesn’t address all the questions above (Confession: my sourdough starter didn’t last three months), it does hint at a hunger to resume at least some aspects of life as we knew it in 2019.
But please remember: if case counts return, we expect the vacillating venues to snap back down.
Also very important to note in the chart above, foot traffic to offices has barely moved. We have noticed a recent shift in conversation towards a return to office work. However: this will take time and likely be the one of the last categories to return. (We’ll talk about this more in a future note, but if you can’t wait check out our 2020 review mentioned in the intro).
3rd Party Data Corroborates Our Findings
The regional and category variations detailed above had us nearly certain the trends we were seeing were for real. These unique patterns reflect the human behaviors we’ve observed for over a year but we wanted corroborating figures before we went public with our findings. Extraordinary claims require extraordinary evidence. And the spikes we measured were certainly extreme.
Thankfully, open source data matched our patterns precisely.
Let’s start with data released by Apple. In response to COVID, Apple began releasing a dataset documenting the change in volume of routing requests in their Maps application. Let’s take a look:
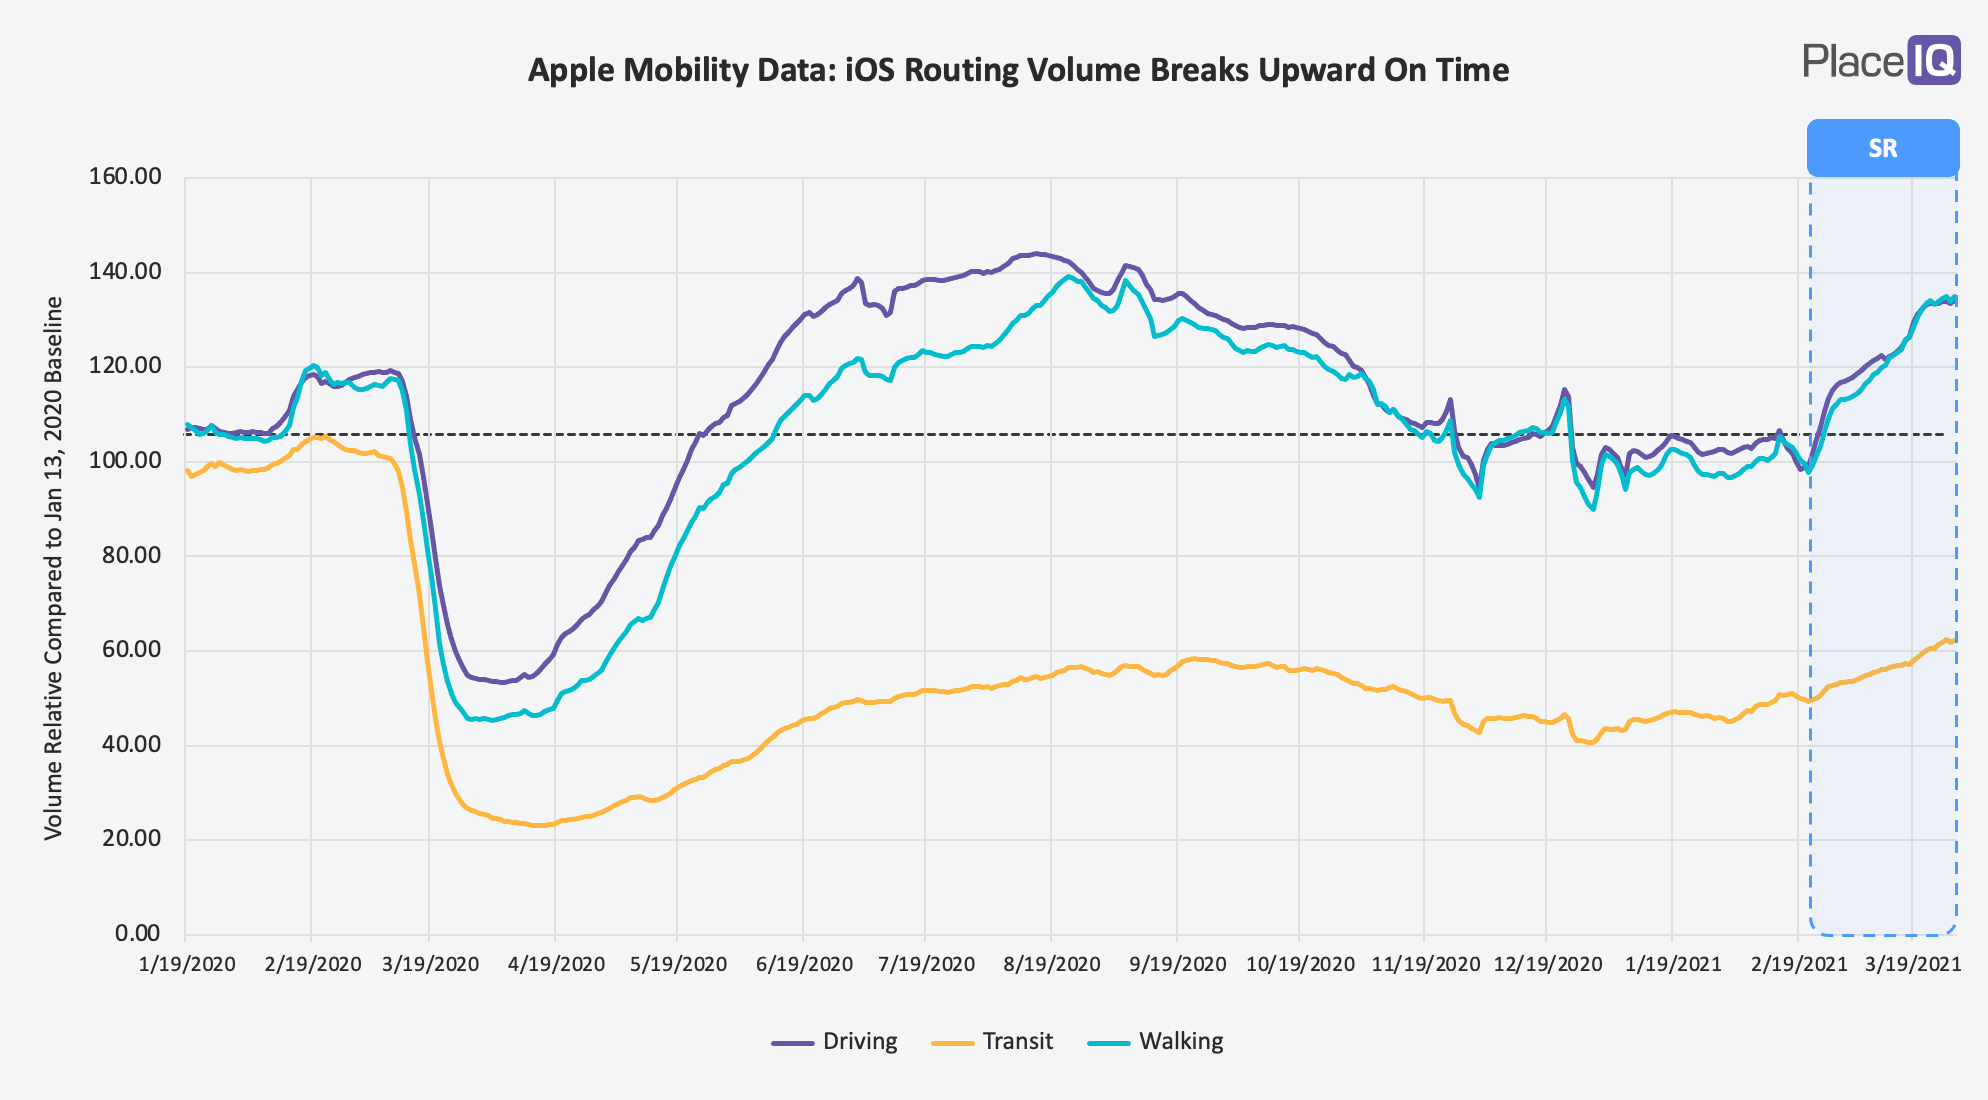
There’s our spike, right on time. From February 20th to late March, requests for driving or walking directions shot up over 35%. Not surprisingly, public transit (which is one of the founding members of our ‘Still Empty’ cluster) saw a slight uptick but nothing close to the alternatives.
In addition to Apple, one of our favorite open datasets to check is one released by the TSA. Everyday, the number of people passing through airport security checkpoints is posted. And again, our spike arrives like clockwork:
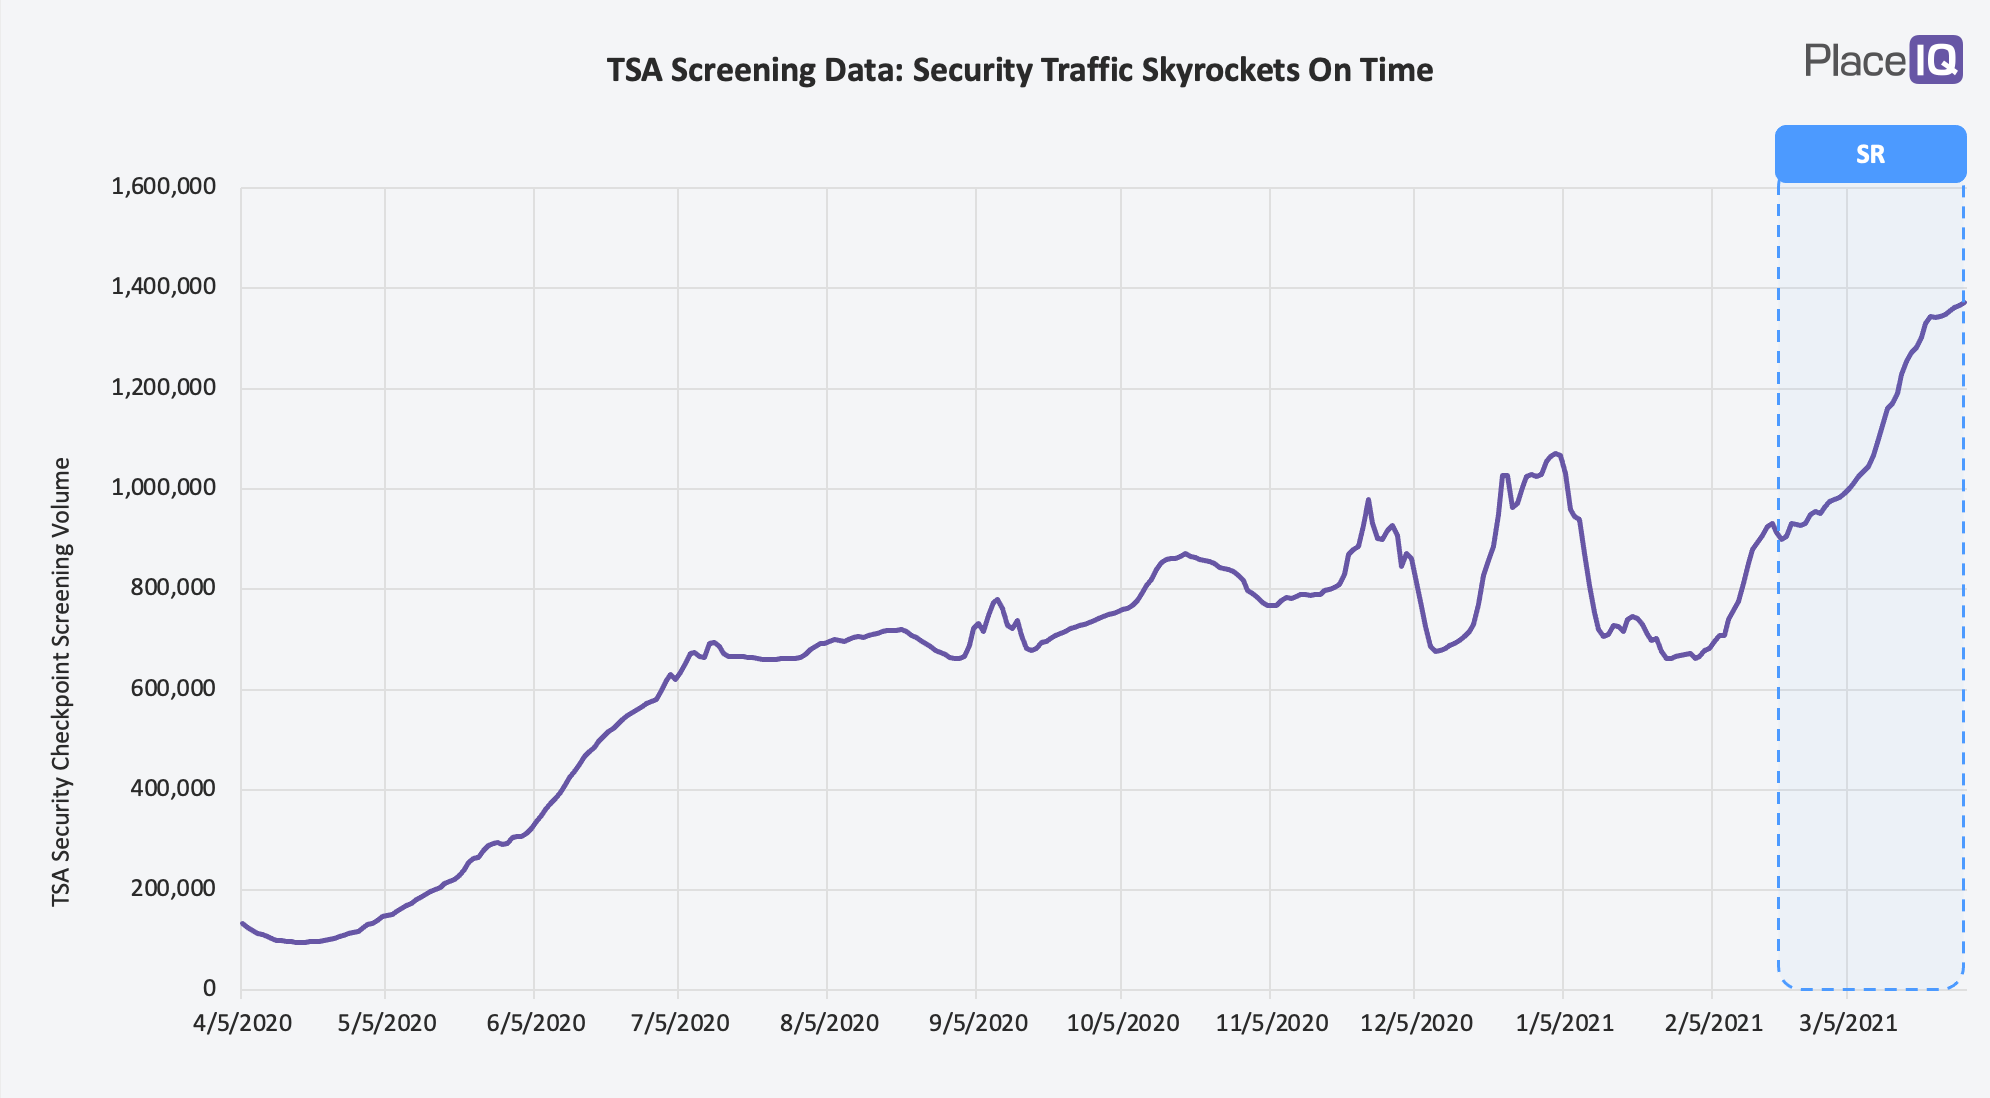
We aren’t at 2019 levels (March daily screenings in 2019 were ~2.5 million), but that lift is dramatic!
By this point we’d also corroborated our figures with sales figures shared by customers and data partners, which firmly agreed. Our Second Reemergence is very, very real.
What to Expect from Our Second Reemergence
Why is this happening now? Our research suggests that multiple factors are playing a role — many of which hit almost at once (which is especially unhelpfully for those seeking natural experiments). People are moving more, likely due to a confluence of factors including declining case counts, vaccination, weather, stimulus, and overall quarantine fatigue.
To be clear, this thing isn’t over.
Offices are still empty. And as long as they’re quiet the ecosystem around them — public transit, business travel, coffee shops, and lunch spots — will remain flat.
While cases are far below the worst of January, they’re ticking back up in many regions. If they continue up, we can expect many categories to stall out and drop. We’ve certainly seen it before. Hopefully we remain cautious and safe while vaccines continue to be deployed.
The USA as a whole is becoming dramatically more active, but traffic still varies widely by region. Until regional variation tapers out, we’ll continue to face an uneven environment with highly local challenges. Meeting people and communities at their preferred risk level remains highly relevant.
We’ll continue to follow these themes and dig into these gains. Welcome back to PlaceIQ’s Social Distance Tracker. Please shoot us a note with any feedback, questions, or ideas.
To learn more about the data behind this article and what PlaceIQ has to offer, visit https://www.placeiq.com/.


Sign up to receive our stories in your inbox.
Data is changing the speed of business. Investors, Corporations, and Governments are buying new, differentiated data to gain visibility make better decisions. Don't fall behind. Let us help.


Sign up to receive our stories in your inbox.
Data is changing the speed of business. Investors, Corporations, and Governments are buying new, differentiated data to gain visibility make better decisions. Don't fall behind. Let us help.