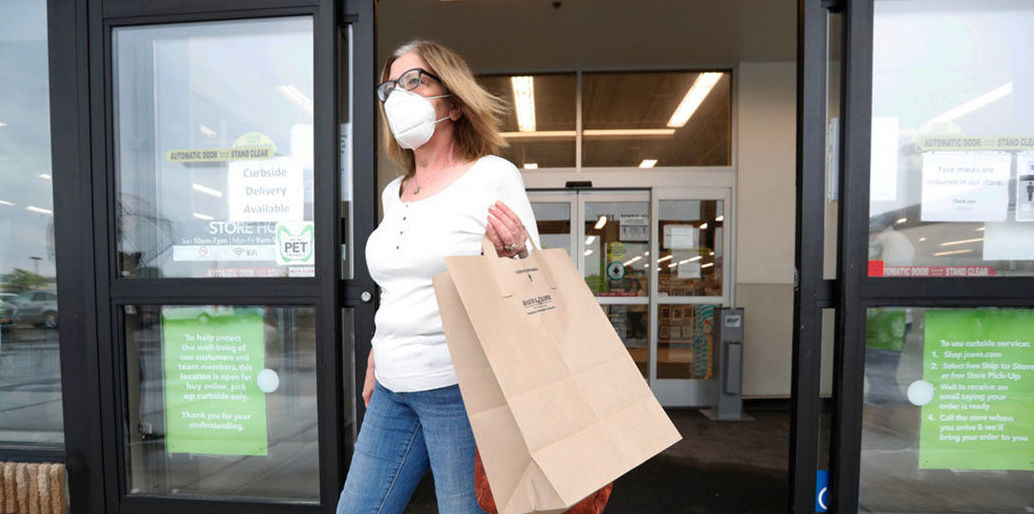
Almost exactly one year after the start of the pandemic, the third and largest-to-date stimulus payment of $1400 per individual (vs. the second round’s $600 and the first round’s $1200) began rolling out to taxpayers in mid-March. In addition to its increased size, the timing of this payout is particularly interesting, coinciding with rising vaccination rates and the re-opening of many local economies, thus providing more ‘purchasing power’ this round. We dove into the data to see how this third stimulus round impacted consumer spending across various geographies, sectors, and retailers.
A note on methodology: For this analysis, we calculate growth relative to two years prior – written throughout as “Yo2Y” – in order to benchmark current performance against ‘normal’ spending levels, in contrast to last year’s anomaly particularly around late March.
Key Takeaways
Largest Impact to Date
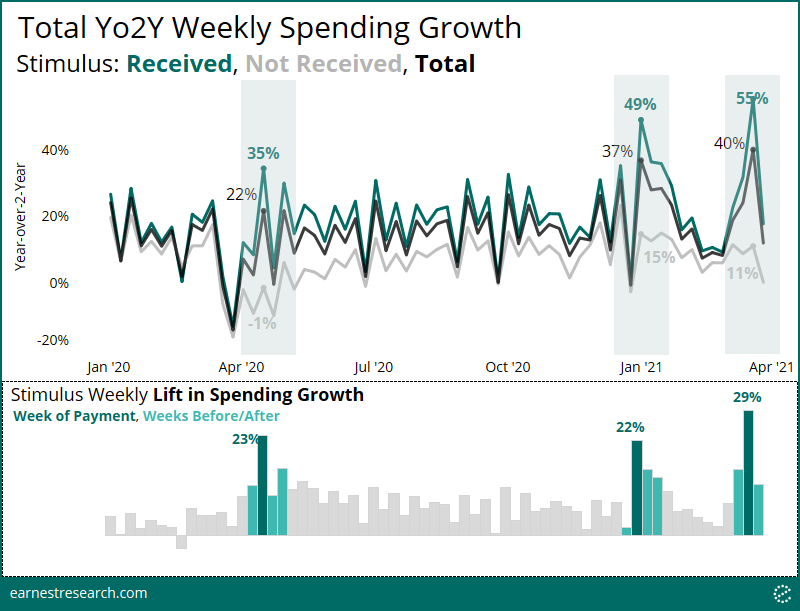
The third round of stimulus payments had the largest impact on consumer spending relative to past rounds. The week of payment (3/18) saw recipients outspend non-recipients by 44% Yo2Y (recipients’ 55% – non-recipients’ 11%), which lifted* total spending growth** a full 29 points. This compares to a lift of 23 and 22 points during the initial weeks of the first and second stimulus rounds, respectively.
Already a full week before payments were distributed to recipients, spending growth saw a 15 point lift; a reflection of how the consumer response was immediately triggered once the bill was signed into law – a week prior to payday – on March 11th. (The first round also saw a 12 point lift in the week preceding payment; the second round did not).
Local Economies Matter
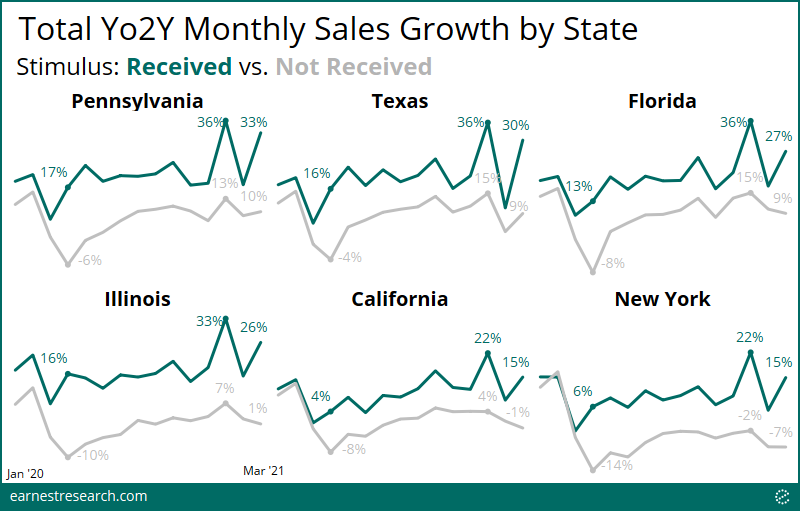
While all states benefited from the stimulus checks, the degree of openness of each local economy had a determined effect on how much the stimulus checks could impact the retail environment.
Texas, and Florida, which eased mask mandates and reopened faster than many other states, as well as Pennsylvania, saw spending growth of ~30% Yo2Y from stimulus recipients in the month of March, but non-recipients were also spending at a relatively healthy ~10% Yo2Y. In contrast, slower to reopen California and New York saw 10+ points of lower spending growth levels across both stimulus recipients and non-recipients – non-recipients actually showed Yo2Y declines in March – impacting just how much the stimulus could lift their local economies.
All Sectors Now Open for Business
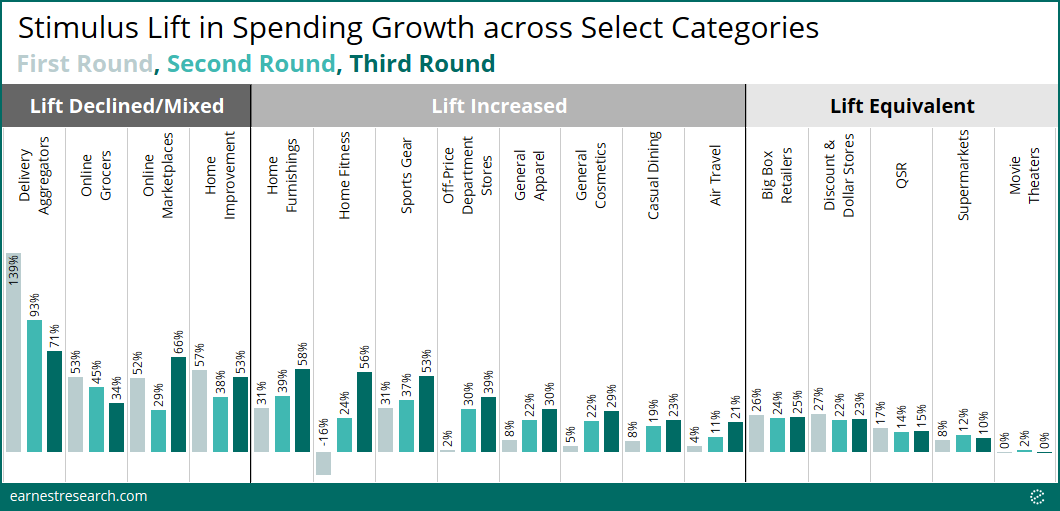
Many sectors experienced an increased lift from the third stimulus payment – a result sparked by a higher payout coupled with the gradual reopening of local economies due to the vaccine rollout nationwide.
Department Stores, Apparel, Cosmetics, Dining, and Air Travel, among others, saw lifts of 20+ points this third round, a notable increase of 10 points from the second round, and a marked contrast to the first round, which saw no benefit from the stimulus due to most of these sectors being closed.
The early pandemic-driven beneficiaries including Restaurant Delivery Aggregators, Online Grocers, Online Marketplaces, and Home Improvement, naturally saw less of a lift this time around relative to the first round, but still saw material lifts of 30 to 70 points. (Online Marketplaces continued strong with a 66 point lift). Essential sectors such as Big-Box, Dollar Stores, QSR, and Supermarkets all saw equivalent lift levels, as did Movie Theaters, which have only recently started to reopen at limited capacity.
Peloton, Kohl’s, and More Etsy
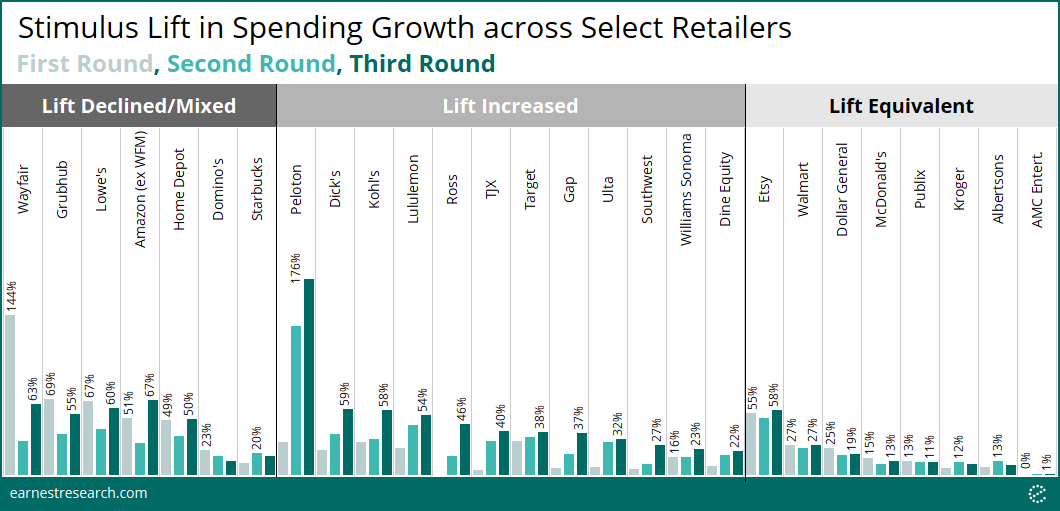
Similarly, looking at some of the largest companies across several of the sectors above, the majority saw increased stimulus lifts this time around, save for the early pandemic-driven beneficiaries such as Wayfair, Grubhub, and Domino’s.
Peloton, Dick’s, Kohl’s, Ross, TJX, Gap, and Southwest, among others, saw impressive third-round lifts. Amazon and Target managed to see increased stimulus lifts, in contrast to Walmart whose lift stayed the same. Lastly, Etsy managed to retain its impressive healthy lift of ~55 points across all three stimulus rounds.
Notes
*“Lift” is calculated as the total spending growth for the entire panel minus the growth for those that did not receive the stimulus. This captures, in other words, how much the cohort of people who received the stimulus contributed to (i.e. ‘lifted’) overall growth.
**Total spending here utilizes our entire spend coverage universe excluding Gig Economy Income, Charitable Giving, Telecommunication, and non-retail-spend Finance categories.
To learn more about the data behind this article and what Earnest Research has to offer, visit https://www.earnestresearch.com/.


Sign up to receive our stories in your inbox.
Data is changing the speed of business. Investors, Corporations, and Governments are buying new, differentiated data to gain visibility make better decisions. Don't fall behind. Let us help.


Sign up to receive our stories in your inbox.
Data is changing the speed of business. Investors, Corporations, and Governments are buying new, differentiated data to gain visibility make better decisions. Don't fall behind. Let us help.


