
Spring is here and the first quarter is behind us. It was around this time last year that the COVID-19 pandemic really began to significantly affect life and the economy with effects reverberating throughout the rest of 2020. A strong, though not ubiquitous, resurgence in apartment demand in the latter half of last year created a question for industry participants at the turn of the new year – to what extent would the multifamily recovery continue into 2021?
As always, only conventional properties of at least 50 units will be included.
National View
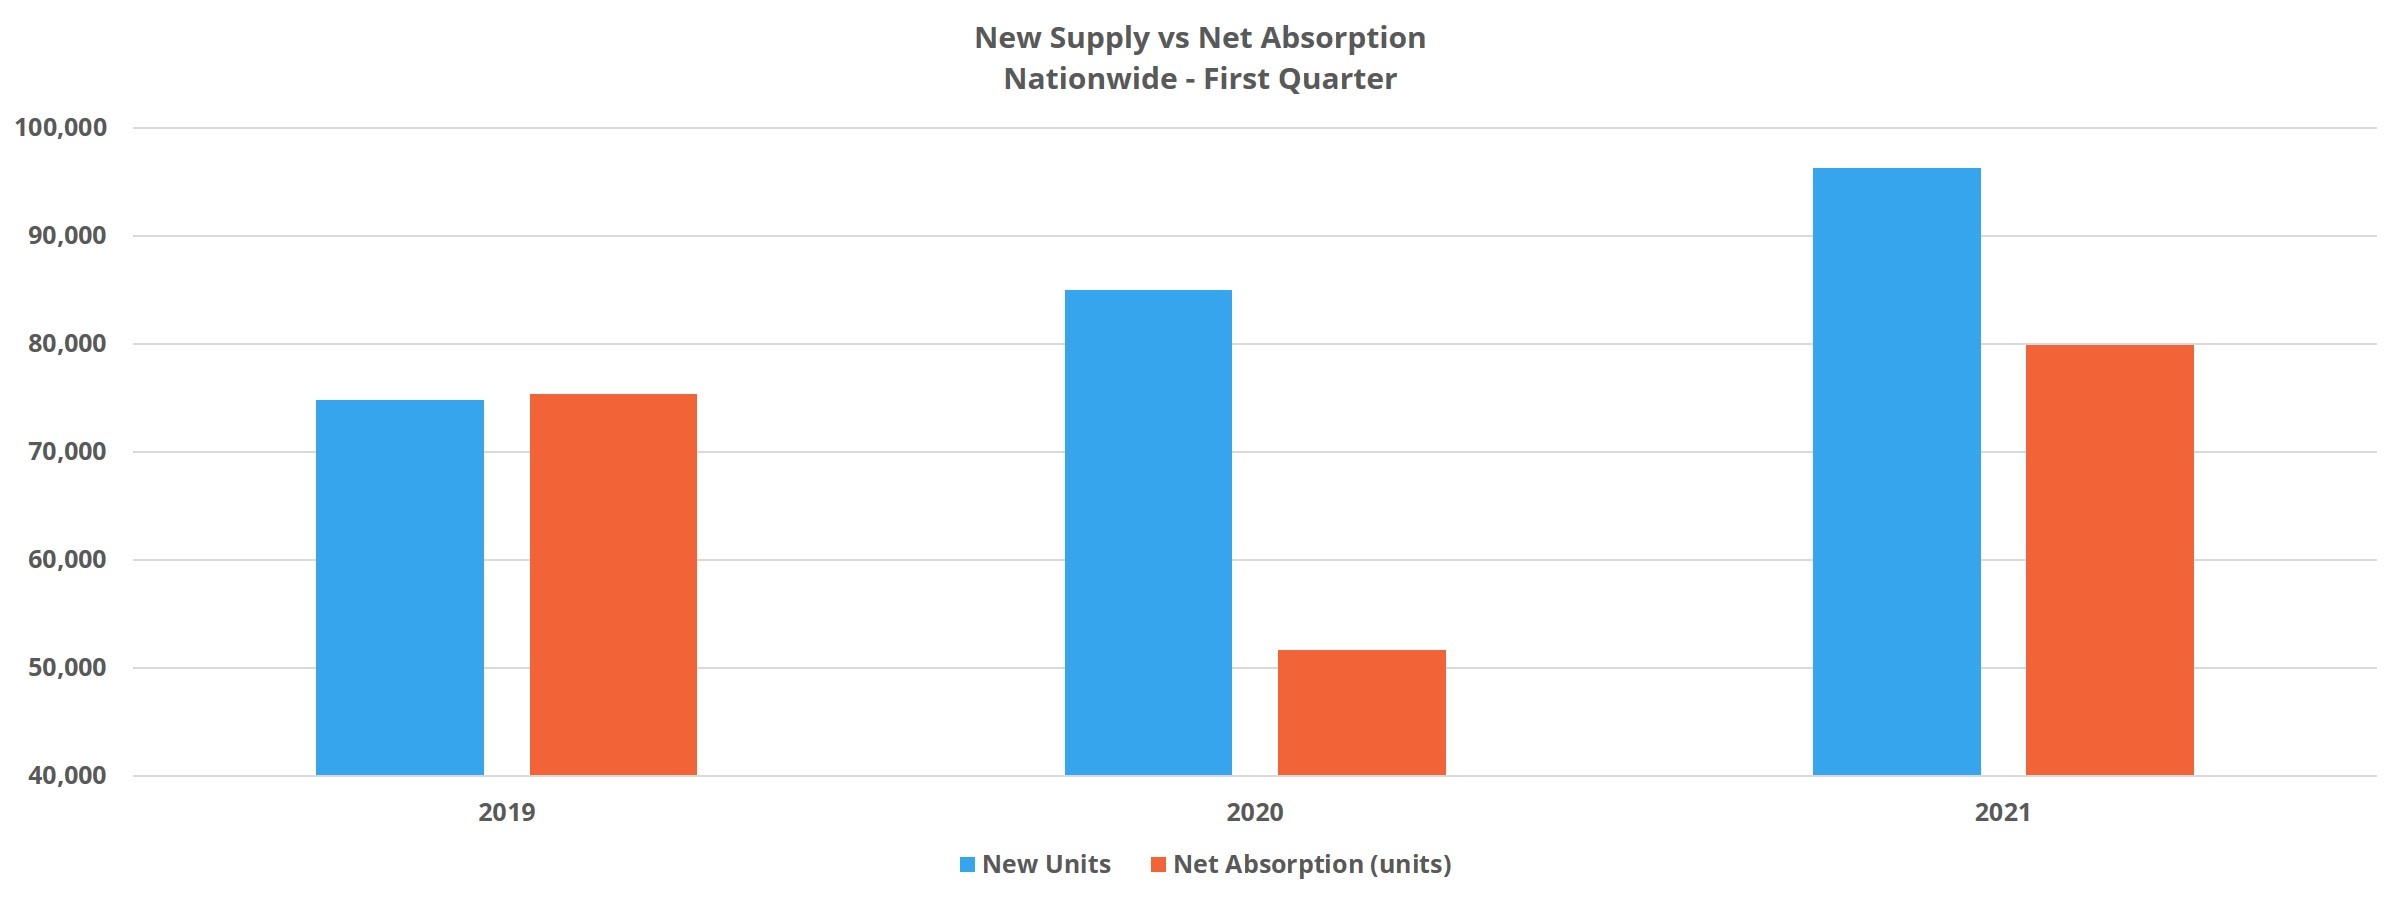
At the national level, new construction activity continued at a feverish pace to the tune of more than 96,000 new units delivered in the quarter. This level of new supply outpaced that from the opening quarters of 2020 and 2019 by a significant margin. The 2021 deliveries equaled around 10,000 units more than in the opening quarter of 2020 and almost 25,000 units more than that portion of 2019.
Last year, in what was a mostly pre-pandemic quarter from an economic perspective, apartment demand was lower in the first quarter than that of in 2019 by about 25,000 units. With such a robust increase in new supply to start this year, similar lackluster demand would have been a real setback for the industry. Fortunately, net absorption totaled roughly 80,000 units – a 55% increase from Q1 2020.
The effect of this supply-demand dynamic on average occupancy and average effective rent growth was very much within range of recent typical first quarter results. Average occupancy was essentially unchanged in the quarter, finishing March slightly below 92%. Average effective rent growth of 1.1% brought the average unit to $1,374 per month. To illustrate the consistency of first quarter recent rent growth in recent years, this year’s 1.1% gain followed a 0.9% gain in Q1 2020 and a 1% gain in Q1 2019.
Lease concessions remain elevated, both in terms of availability and average value. About 20% of conventional properties were offering a new lease discount at the end of March, up from approximately 16% at this time last year. Similarly, the average lease concession value ended the quarter at a little more than four weeks off an annual lease after equaling only three weeks off an annual lease at the end of March 2020.
Regional View
Underneath the national numbers, there was notable variance in first quarter performance by region. For the sake of space, some highlights will be identified here. For a fuller look at regional performance differences, be sure to check the ALN blog. Using NAA region designations and evaluating regional apartment demand within the context of demand from the opening quarter of last year brings three regions into particular focus.
The first is Region 4, which includes Georgia, South Carolina, North Carolina, Kentucky, and Tennessee. Apartment demand in this area of the country was almost triple that of Q1 2020 with net absorption of more than 13,000 units. This was sufficient to maintain average occupancy just above 92% and propelled average effective rent growth to 1.7%, even in the face of increased new supply.
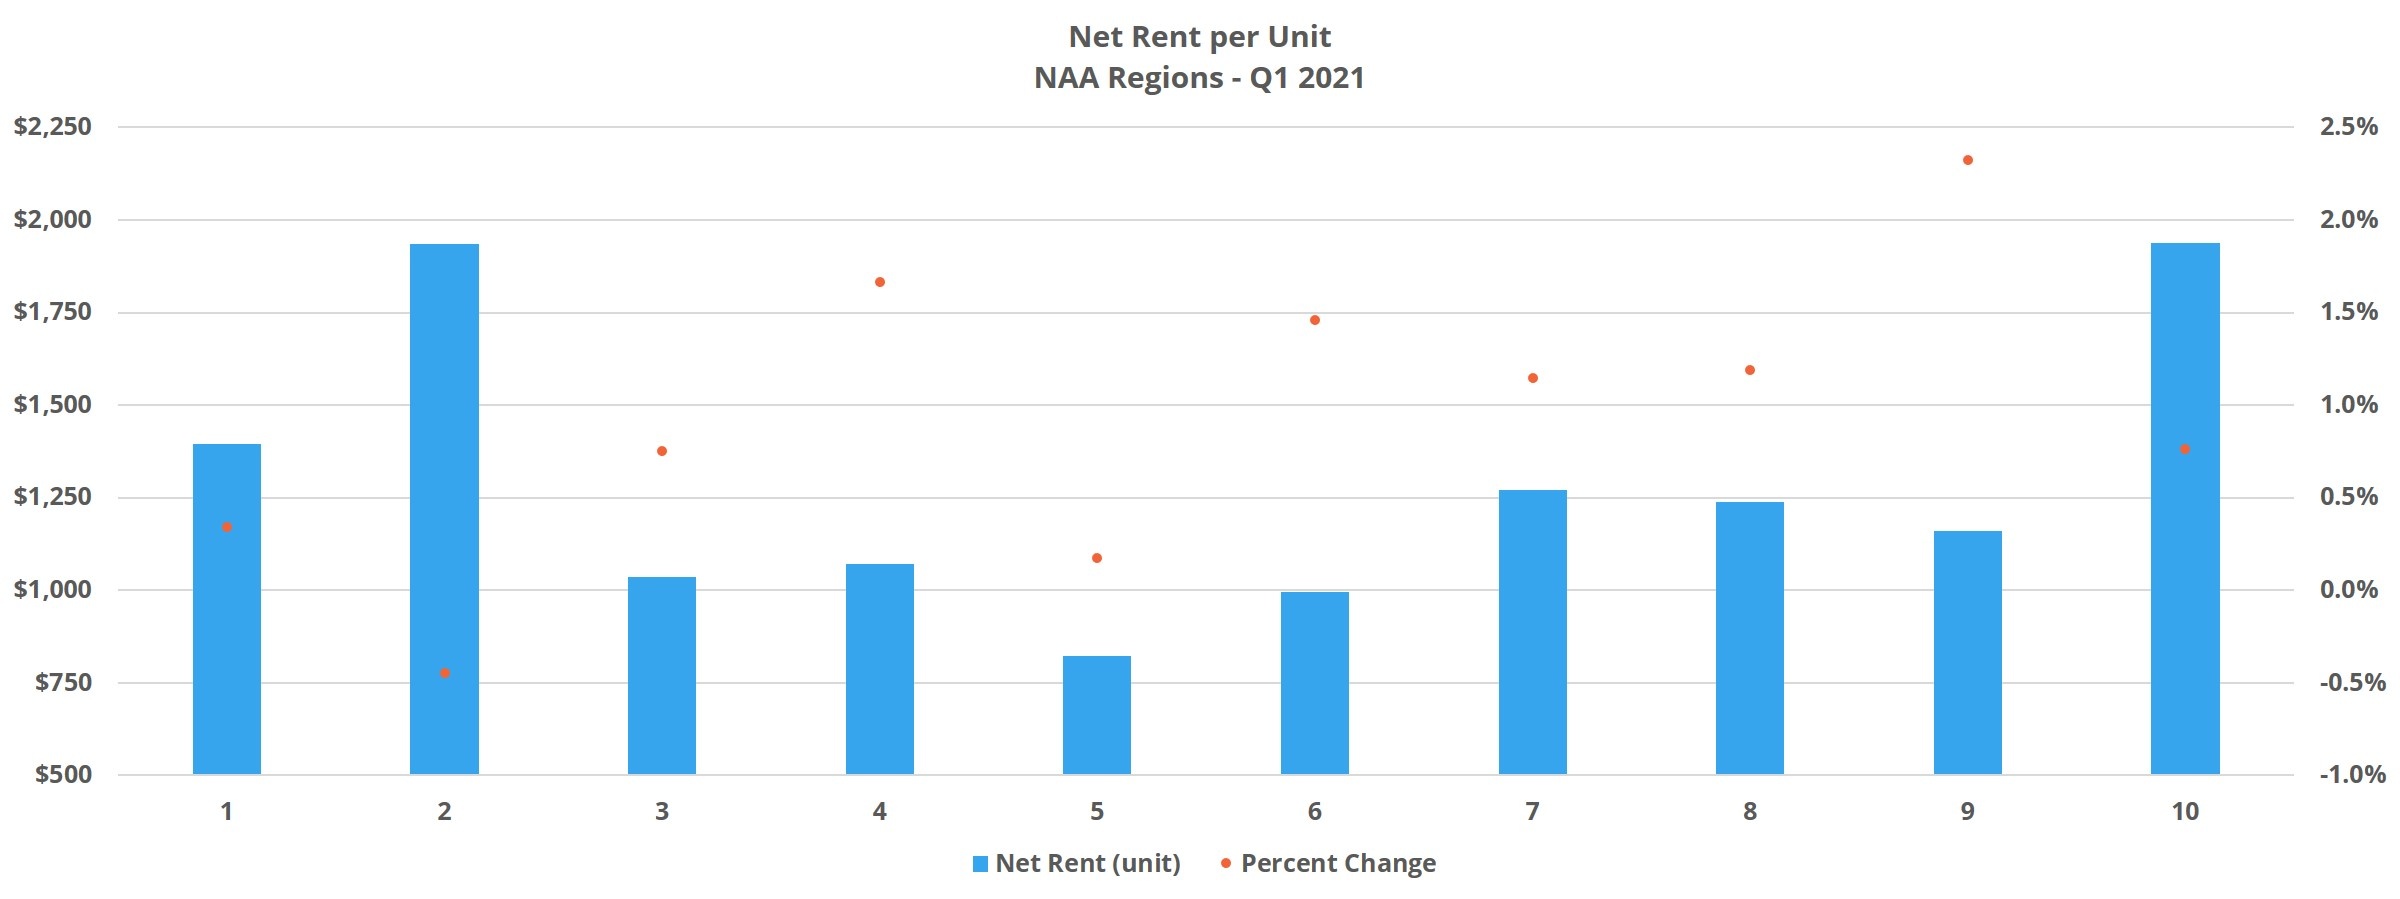
Another region where apartment demand was much stronger to open 2021 than to open 2020 was Region 6 – an area that includes New Mexico and Texas. Here, net absorption also totaled just more than 13,000 units. While this demand did not outpace Q1 2020 to the same extent as in Region 4, the more than 13,000 net absorbed units were more than double the number from the first three months of last year. The result was an unchanged average occupancy for the region at just under 90% and average effective rent growth of 1.6%.
Lastly, Region 9 managed to nearly triple Q1 2020 apartment demand in the opening quarter of this year. This region, comprised of Louisiana, Alabama, Mississippi, and Florida, absorbed more than 14,000 net units in the quarter. A small gain of 0.2% nudged the region to 91% average occupancy and average effective rent growth of 2.1% was the highest of any region.
Price Class View
The rising tide of strong apartment demand lifted all boats to open 2021, with each of the four price classes exhibiting more robust demand than the opening quarter of last year by sizable margins. In fact, for both price Class A and Class B properties, quarterly net absorption outpaced that of both 2020 and 2019.
For Class A, average occupancy closed the quarter where it opened the quarter – just less than 84%. This development was in spite of more than 30,000 net absorbed units in the period. It has to be remembered that the bulk of new units will fall into this category. Rent growth was strongest in this group of properties, with the average Class A unit renting for $1,937 per month after a 1.3% quarterly increase. Aiding in that rent growth was the decreased availability and average value of lease concessions, though both remain elevated compared to recent history.
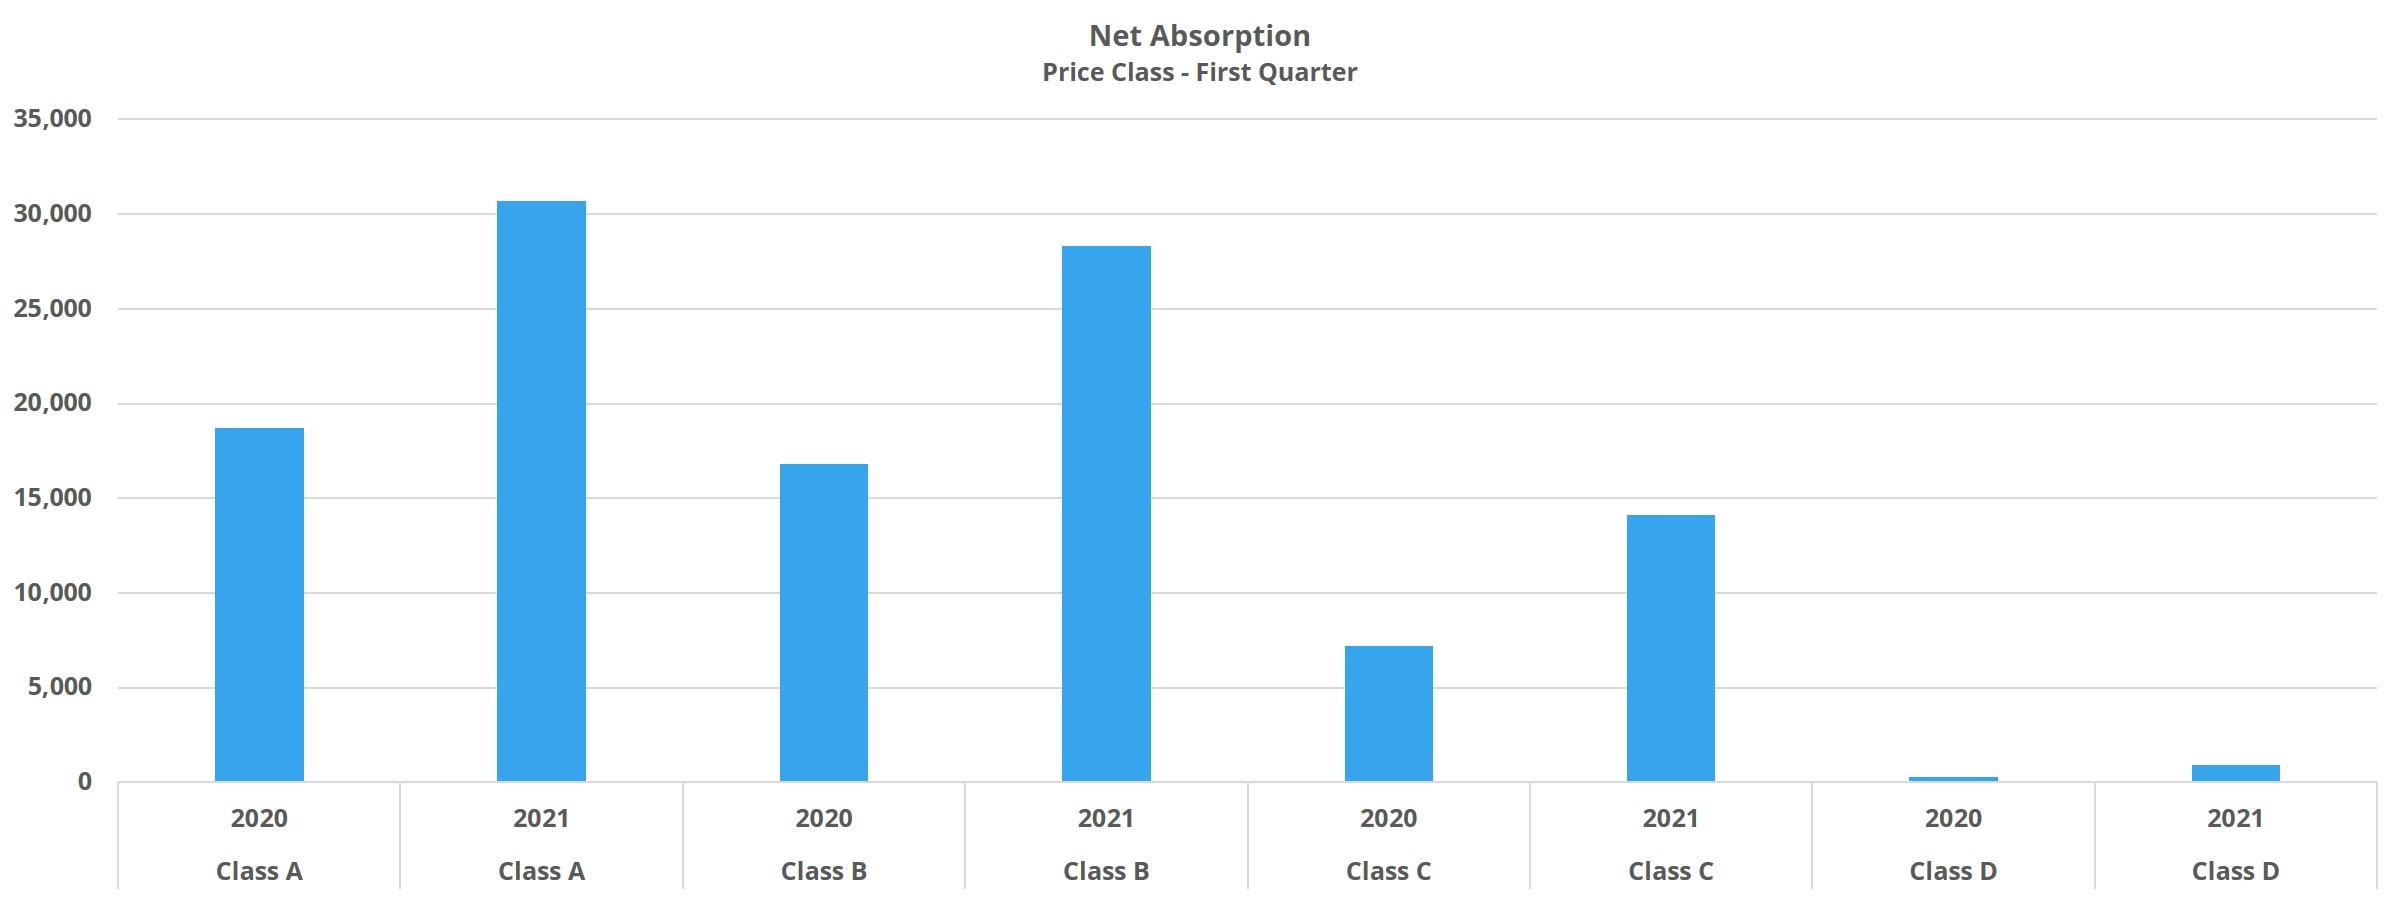
Class B properties similarly saw no real movement in average occupancy and closed March at just below 91% as a group. Net absorption of more than 28,000 units compared favorably to the around 17,000 net absorbed units in Q1 2020, and this demand resulted in average effective rent growth of 1%. The average Class B unit ended the quarter leasing for $1,531 per month. Here too, the availability of lease discounts decreased, but unlike in Class A, the average discount value rose by 2% in the quarter to settle at almost five weeks off a 12-month lease.
The bottom two price tiers likewise experienced no average occupancy change in the quarter and each finished March at around 94%. Compared to last year, apartment demand performed even better in these groups than in the top two price classes. Class C properties absorbed more than 14,000 net units, roughly double that of last year’s first quarter, and demand tripled for Class D properties with net absorption approaching 1,000 units. Rent growth was more tepid here, however. Class C average effective rent rose by 0.8% while Class D rent appreciation was less than 0.5%. A headwind for Class D rent growth was an increase both in concession availability and average value.
Takeaways
The first quarter was an encouraging one for the multifamily industry. Healthy apartment demand, more than 50% higher than that from Q1 2020, helped to offset the delivery of nearly 100,000 new units to maintain average occupancy and add about 1% to average effective rent.
States in the Mid-Atlantic region and across the south stood out in terms of apartment demand. Net absorption in NAA regions 4, 6, and 9 was 140% higher than in the opening quarter of 2020.
From a price class perspective, strong apartment demand was spread across the classes rather than being concentrated only at one end of the spectrum or the other. Rent growth was stronger in the top two tiers, but absorption was most impressive in the lower two tiers relative to the same period last year.
Overall, even though concessions remain higher than normal, the outlook for multifamily appears promising. This is especially the case as the COVID-19 vaccine rollout continues and economic activity continues down the path toward normalcy. After a disastrous second quarter last year, the industry now has experienced three consecutive relatively strong quarters.
To learn more about the data behind this article and what ALN Apartment Data has to offer, visit https://alndata.com.


Sign up to receive our stories in your inbox.
Data is changing the speed of business. Investors, Corporations, and Governments are buying new, differentiated data to gain visibility make better decisions. Don't fall behind. Let us help.


Sign up to receive our stories in your inbox.
Data is changing the speed of business. Investors, Corporations, and Governments are buying new, differentiated data to gain visibility make better decisions. Don't fall behind. Let us help.