
With a year passed since the start of the pandemic, people have shifted where they work, travel, and live. Using our foot traffic data*, we refreshed our October analysis on the COVID-driven Urban Exodus, and analyzed whether this migration out of urban centers has continued to last, or whether people are now returning back to their pre-COVID urban life.
Our Methodology
We looked at particular urban cohorts** pre-pandemic, and analyzed what share of each cohort moved away, where they moved to, and how many have since returned. We replicated this analysis in the prior year (i.e. cohorts from before March 2019) in order to establish and compare the COVID-driven migration and return to a benchmark of “normal” migration patterns exhibited in the data. We believe that the difference between 2020 vs. 2019’s migration is the appropriate way to measure any COVID-driven changes, and is the methodology we employ throughout the analysis.
Key Takeaways
The Great Urban Migration
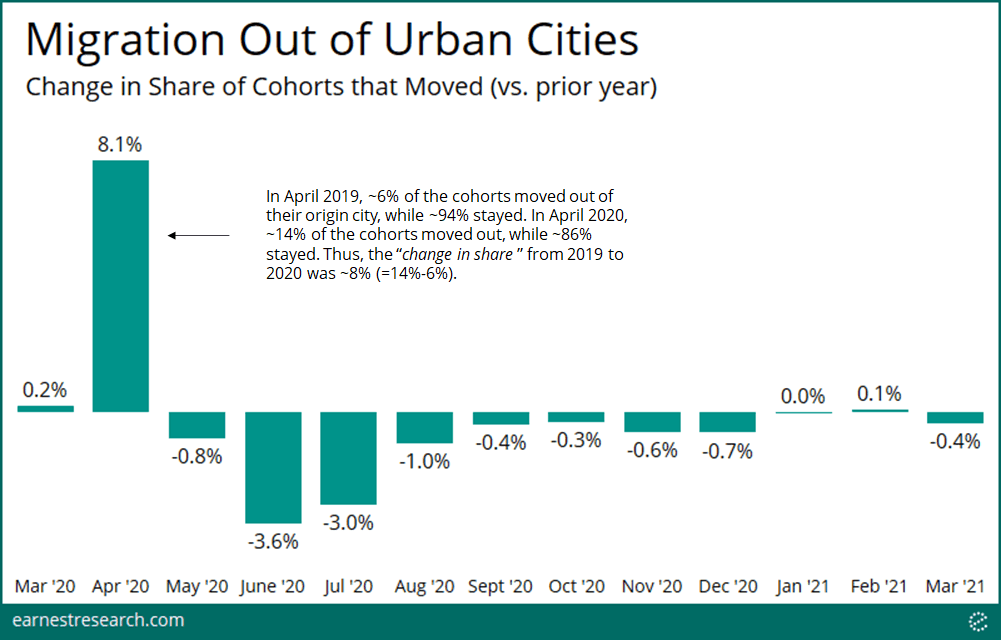
With the nation in lockdown and the prospect of prolonged time at home, many of those that could move did, to the tune of 8% more people moving in April 2020 vs. a more ‘normal’ April 2019. This ‘change in share’ is calculated based on 14% of cohorts migrating from their home city in April 2020, vs. just 6% doing so in April 2019. Conversely, the typical summer moving months of June and July saw reduced migration of -4% and -3% respectively in 2020 vs. 2019. September through March 2021 were little changed versus the prior year’s migration patterns, at 0% or -1%.
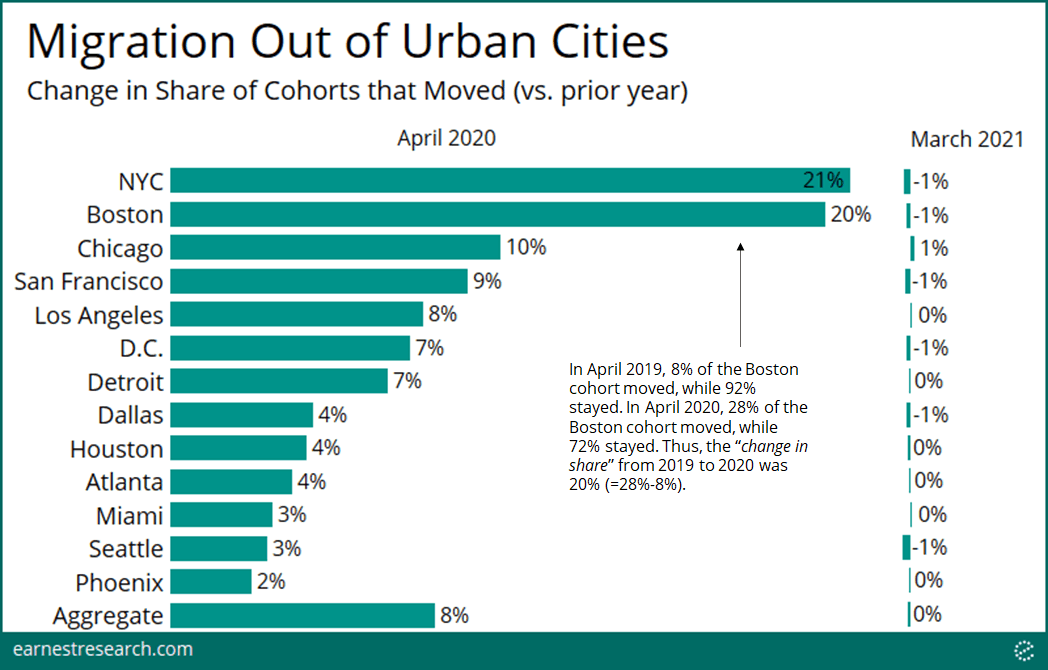
Unsurprisingly, with much of the early U.S. COVID outbreak centered in the northeast, New York and Boston saw the highest rates of migration with around 20% increase in the share of people moving away from these areas. Chicago’s migration rates increased by 10%, while the west coast cities of San Francisco and Los Angeles saw 9% and 8% more migration compared to a typical year. The District of Columbia and Detroit both had ~7% more outflows, while Dallas, Houston, Atlanta, Miami, Seattle, and Phoenix saw just 2-4% more migration than April 2019.
Jumping forward to March 2021 we see little change to prior migration, either flat or down a hair -1%.
Still Fewer Returned
While the urban exodus of 2020 has been widely covered, we continue to monitor whether residents have or will return, particularly now that vaccines are widely available.
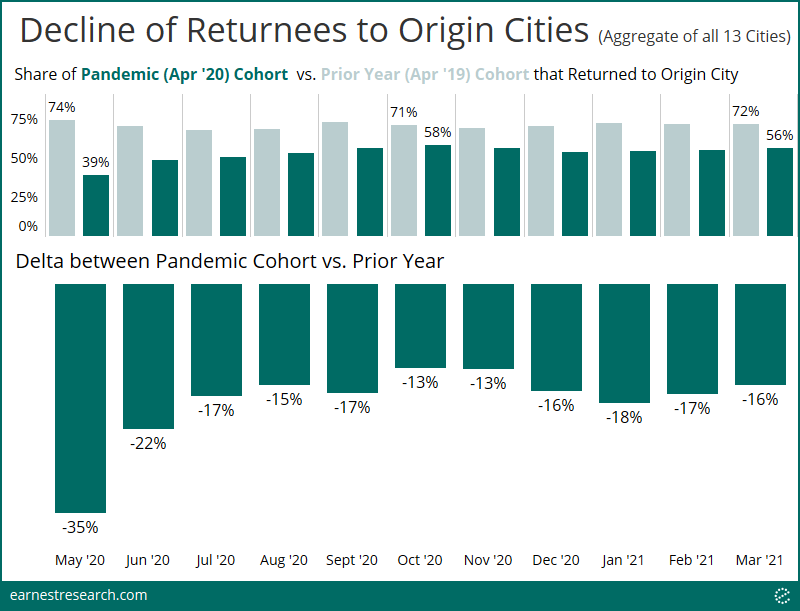
Still to date, the sharp April exodus has resulted in a continued decline in the number of returnees. Focusing on the crucial April 2020 cohort*** that saw outsized migration, after one month away in May, the share that returned home across all thirteen cities fell 35% relative to 2019 (39% of the cohort returned this year vs. 74% last year). This decline of returnees subsided to -13% in October/November, fell a bit more to -18% in January/February, and is currently at -16%, notably, still substantially fewer returnees.
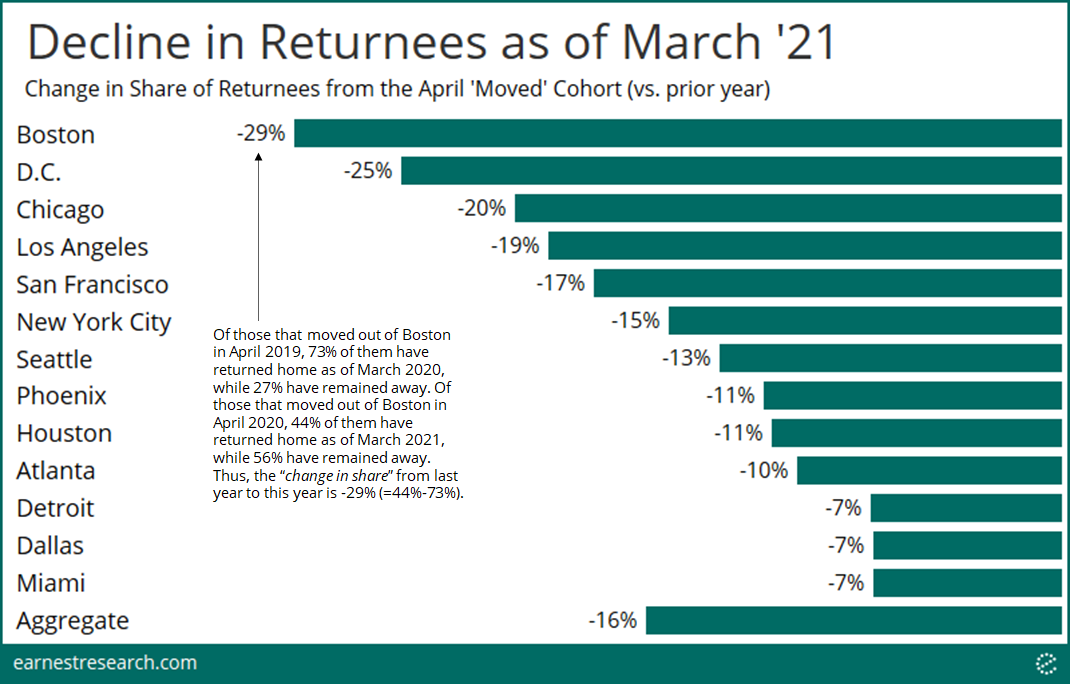
The distribution of returnees differs greatly by city, albeit in a different order to the exodus. Boston has seen the fewest returnees, at -29%, vs. the more typical level of returnees in 2019, followed by the District of Columbia, although the change of administration may also be a factor in the nation’s capital. Chicago saw a change of -20%, followed by Los Angeles and San Francisco at -19% and -17%. After seeing the highest rate of exodus, New York City is in the middle of the pack with -15% fewer returnees. Seattle, Phoenix, Houston and Atlanta saw -13% to -10% change in returnees, while Detroit, Dallas and Miami are least affected at -7%.
Destinations Not Too Far
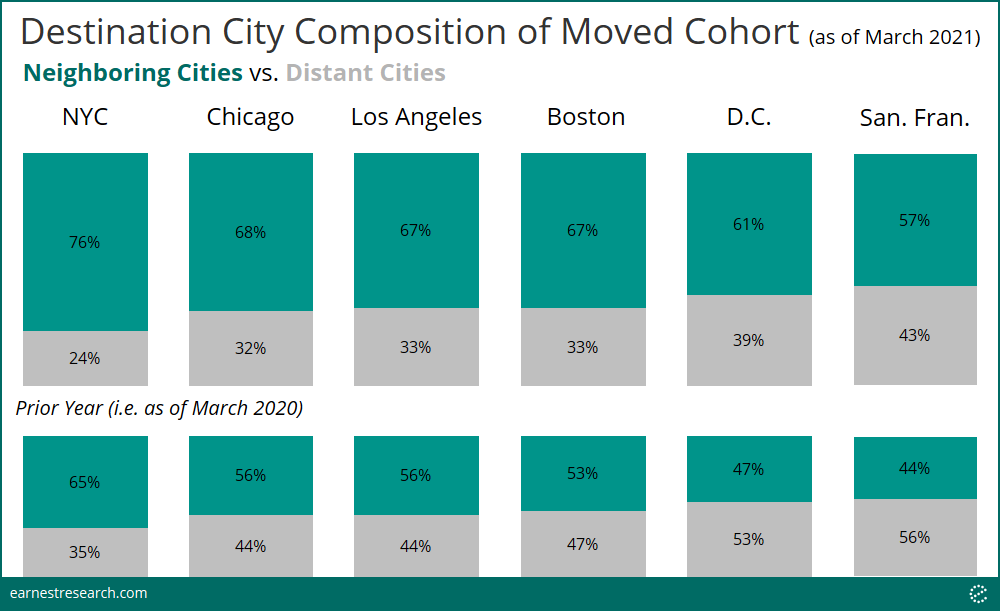
With a significant portion of residents remaining away from their home city, we asked the data the natural next question: where did these people go? The answer to this question can be understood in two different ‘destination-buckets’: 1) neighboring cities and 2) distant cities. We quantified this destination-bucket breakdown for the cities that saw the biggest exodus and the fewest returned, as shown above, (and replicated the analysis in the prior year*** as a benchmark).
As anticipated, the majority of movers (~55% to 75% of them) moved to, and have so far stayed in neighboring cities, as of March 2021 (defined as within the same Core Based Statistical Area). Importantly, this is ~10 to 15% more than the share seen last year. We note that while this is indeed representative of some city dwellers moving outside the city-center due to the pandemic, it is also likely a reflection of commuters no longer commuting to an office (versus an actual change of one’s home city).
New York City saw the highest concentration of people moving to and staying in the surrounding areas, at 76% (11% higher than last year). Chicago, LA, and Boston saw 67-68% (11-14% higher than last year), and D.C. and San Francisco saw 57-61% (13-14% higher than last year), still a majority, but interestingly a deviation from the prior ‘normal’ year where the majority of D.C. and SF movers moved to distant cities.
Notes
The nature of this published piece does not allow for an exhaustive analysis on every city across the country. Please reach out if you are interested in a similar but varying cut of this analysis.
*The data in this analysis is limited to the 650,000+ retail and business establishments that are mapped as part of the core dataset received from our partners. It importantly does not include any private or residential locations.
**Cohorts are defined by the city in which the majority of a consumer’s visits occurred in the 14 months trailing February 2020; with the majority city ascertained via quarterly aggregations in 2019 and monthly aggregations in 2020 and 2021. (The prior year benchmark is defined the same way just in the preceding 12 months). If the majority city changes in a particular month, the resident is considered to have ‘moved’ in that month. We recognize there are various reasons, other than the actual moving of one’s residence, for why the majority of visits could occur in one’s non-resident city. This is a core reason why our analysis focuses on the difference between this year’s migration statistics and last year’s as the benchmark, rather than focusing simply on the nominal percentage of outflows of a given cohort this year.
***Results on returnees may differ from our analysis back in October, as our logic now fixates on the crucial April cohort, and more accurately reflects whether someone has returned home, and has remained at home, as of a particular period.
****Because the analysis limits to cohorts that have moved and have not returned over a twelve month period, when looking at the non-pandemic ‘normal’ year (i.e. from Apr ‘19 to Mar ’20), the cohort sizes can be relatively small, and results can therefore be more volatile.
To learn more about the data behind this article and what Earnest Research has to offer, visit https://www.earnestresearch.com/.


Sign up to receive our stories in your inbox.
Data is changing the speed of business. Investors, Corporations, and Governments are buying new, differentiated data to gain visibility make better decisions. Don't fall behind. Let us help.


Sign up to receive our stories in your inbox.
Data is changing the speed of business. Investors, Corporations, and Governments are buying new, differentiated data to gain visibility make better decisions. Don't fall behind. Let us help.