
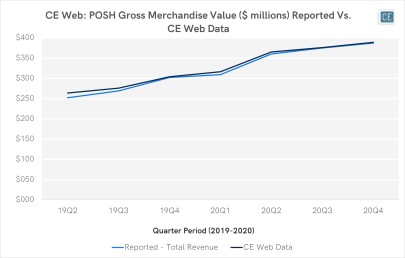
Poshmark has been making its mark on luxury retail by providing a popular marketplace for both reselling goods and listing new items. With the company newly launched as part of our CE Web data to complement our existing CE Transact offering, in today’s Insight Flash we dig into trends vs. the larger consignment space, how the company has performed vs. its largest competitors, and what average selling price looks like by department.
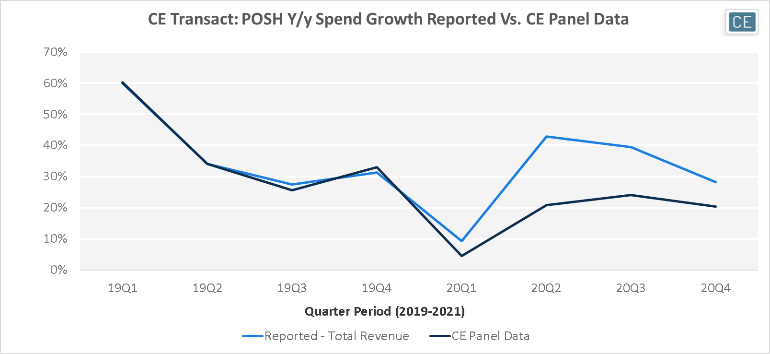
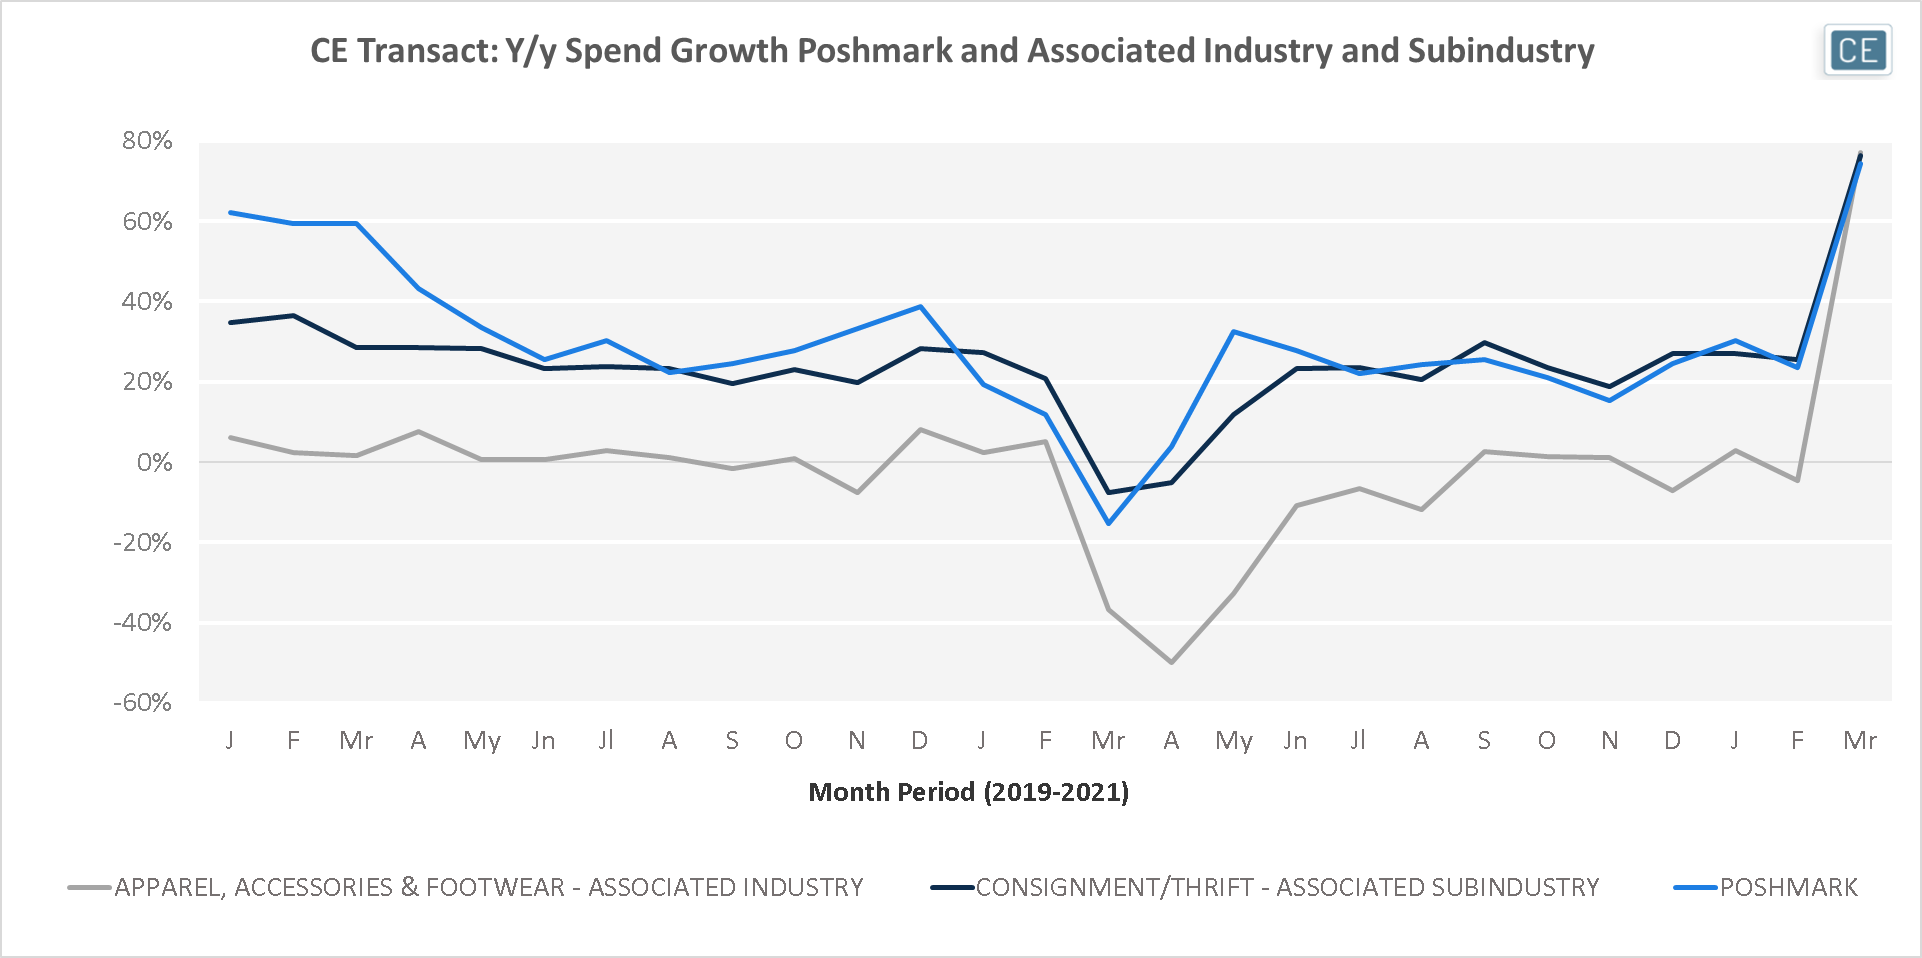
Consignment/Thrift spend growth has been outpacing the overall Apparel, Accessories, and Footwear industry since the beginning of 2019. Poshmark y/y spend growth was stronger than the subindustry throughout 2019, but started to fall behind in January 2020. Although store closures within the subindustry allowed Poshmark to outperform again that spring, growth underperformed the subindustry for much of Summer and Fall 2020. So far in 2021, Poshmark growth has tracked the broader Consignment/Thrift subindustry trends.
Poshmark vs. Subindustry and Industry
Poshmark’s performance relative to broader subindustry trends makes it unsurprising that the company is in the middle of the pack when it comes to competitor growth rates in our CE Transact panel. Vestaire Collective and Mercari have seen the highest spend growth in the subindustry at over 100% each. Kidizen, Fashionphile, and Rebag have also seen higher growth (71%, 56%, and 40%, respectively) vs. Poshmark’s 31%.
Brand Growth vs. Competitors
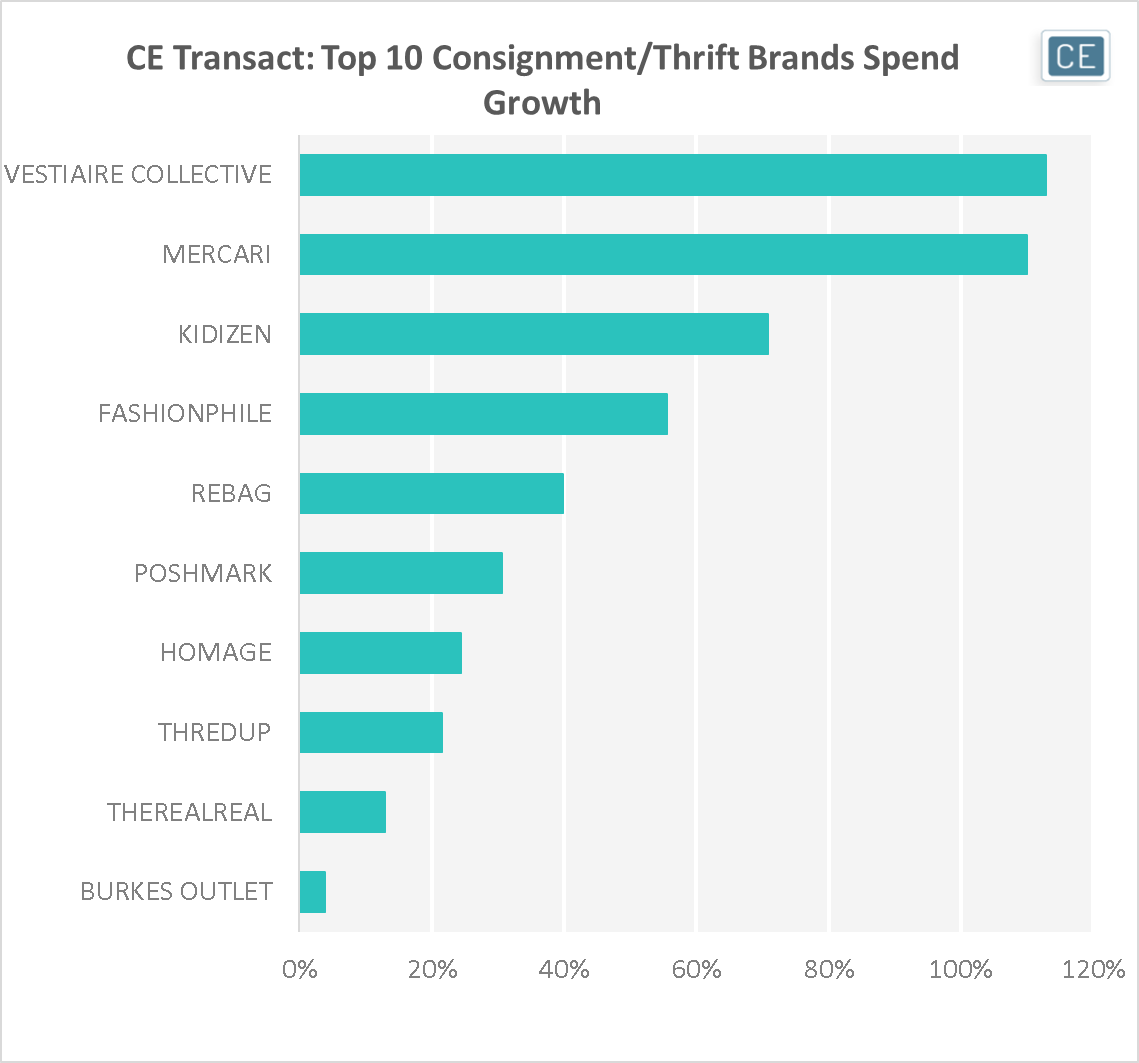
Note: 364 days ending 4/16/2021
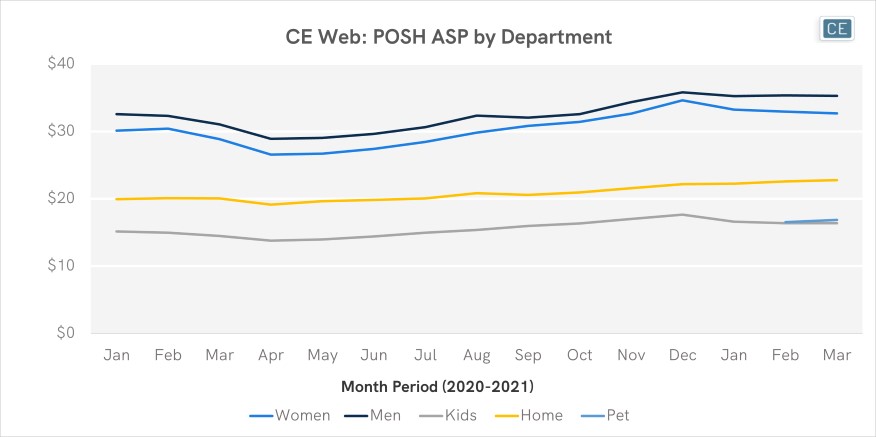
CE Web data allows us to break out Poshmark’s sales by department and see inside shopper baskets to the Average Selling Price (ASP) per item. Purchases for Men have had the highest ASP over the last year, averaging $32.60 over the last twelve months. Purchases in Women were only slightly behind at $30.59. Home ASP over the past year was $21.02, while Kids was $15.73 and the newly launched Pet department had an ASP averaging $16.70 in our first two months of data.
Average Spend by Department
To learn more about the data behind this article and what Consumer Edge Research has to offer, visit www.consumer-edge.com.


Sign up to receive our stories in your inbox.
Data is changing the speed of business. Investors, Corporations, and Governments are buying new, differentiated data to gain visibility make better decisions. Don't fall behind. Let us help.


Sign up to receive our stories in your inbox.
Data is changing the speed of business. Investors, Corporations, and Governments are buying new, differentiated data to gain visibility make better decisions. Don't fall behind. Let us help.