
The occupancy doldrums remained in place with U.S. occupancy falling to an eight-week low (56.7%) during 2-8 May 2021. Using STR’s total-room-inventory (TRI) methodology, which considers hotels that are temporarily closed, occupancy dropped to 54.2%. Demand, however, increased slightly and remained above 21 million as it has since mid-March. The decrease in occupancy was a result of increased hotel openings. Supply was up 0.8% week over week with more than 284,000 additional rooms available this week than in the previous one. The weekly gain was the most since last summer.
The largest supply gains were in the New Jersey Shore market, where 28,000 rooms came online ahead of the summer season, and in Alaska. Among the Top 25 Markets, Washington, D.C., led the pack with the addition of 14,000 rooms followed by New York City. Chicago and San Francisco also saw openings during the week. Looking at the hotel stock by property size, large hotels (300+ rooms) continued to lag with only 93% of the rooms available in 2019 opened today. The other size categories were slightly ahead of the stock they had in 2019.
As mentioned, weekly demand increased but with notable differences. Weekday demand drove the increase and was up by its largest amount of the past month. More than 70% of all markets reported weekday demand gains with weekday occupancy increasing to 52% (50% TRI). Demand and occupancy in the Top 25 were also up with weekday occupancy at 50% for the week. Prior to this week, weekday demand in the Top 25 had fallen for four consecutive weeks. Occupancy for business hotels in urban locations in the Top 25 also increased to 43% after dropping in the previous week. While weekday performance was good, demand indexed to 2019 still has a way to go with this week’s figure dropping to 78.3, its lowest since mid-March.
Weekend demand fell by its largest amount of the past five weeks resulting in occupancy of 68% (64% TRI). Recall, weekend occupancy had been at or above 70% since early April. While we know supply gains played a role in this week’s overall occupancy softness, there is also seasonality at play. As compared with the same weekend in 2019, weekend demand came in with the second highest index (96) of the year, reflecting nearly identical performance during the comparable weekend from two years ago.
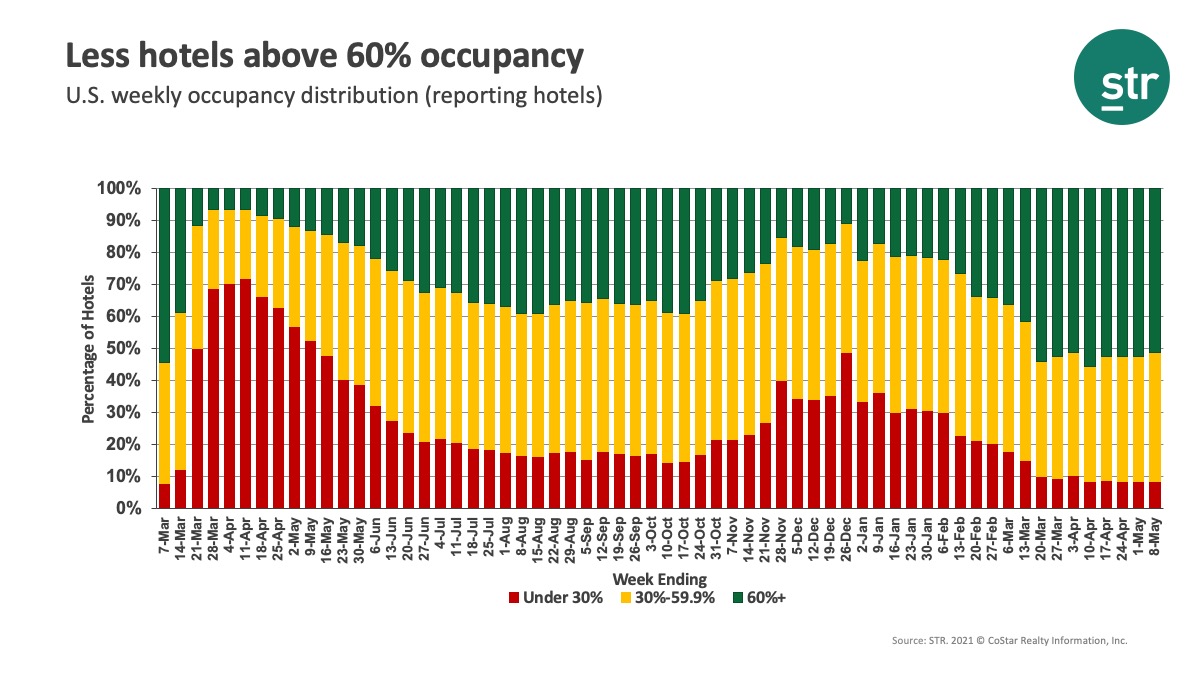
Occupancy distribution saw a slight change as less hotels had occupancy above 60% this week (51% this week versus 52% in the previous two weeks). There was also a slight rise in the number of hotels with occupancy below 30%. The 3,039 hotels with under 30% occupancy was the highest of the past three weeks but far better than the 14,000 in that category at the beginning of the year.
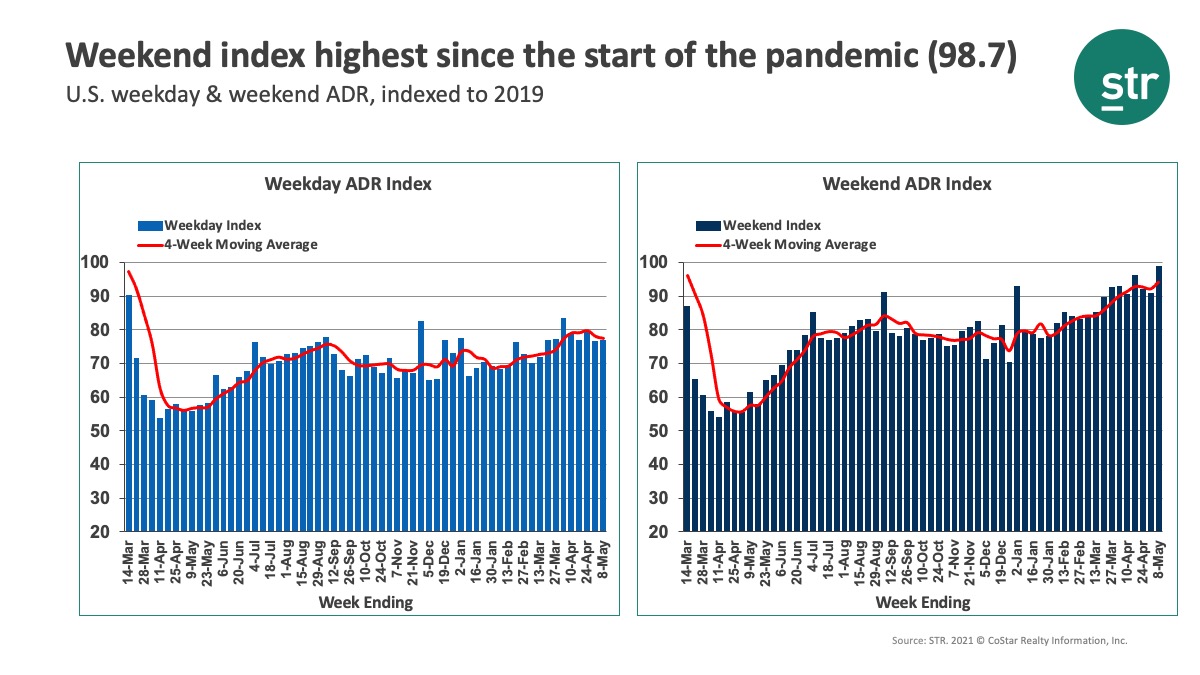
ADR advanced for a third straight week and by the largest amount in some time, up 1.1% to $110, which was also the highest level since early April. Weekday ADR led the way with percentage growth better than what was seen over the weekend. However, weekend ADR continued to be stronger on an absolute basis and reached US$125, the best level since January 2020. Weekend ADR indexed to 2019 was also the highest since the start of the pandemic (98.7), indicating current ADR was almost identical to what it was in 2019. Weekday ADR increased to US$102 and has been above US$100 in seven of the past eight weeks. Top 25 ADR advanced nearly 2% during the weekdays for a total week gain slightly better than the total U.S.
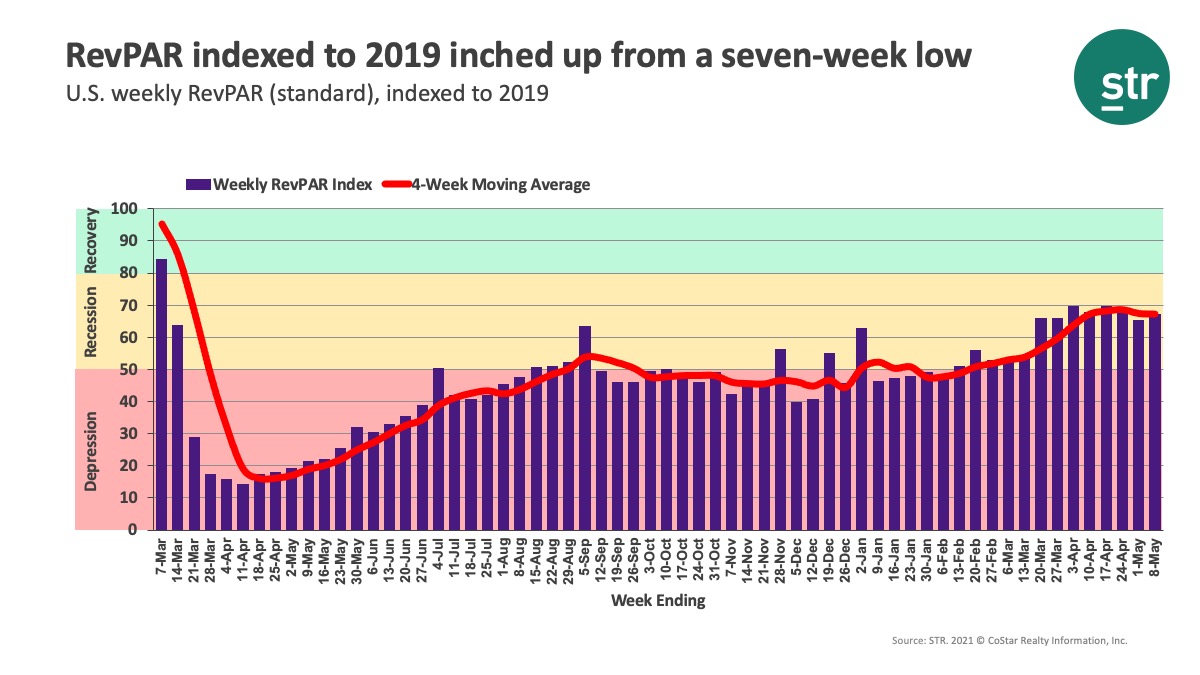
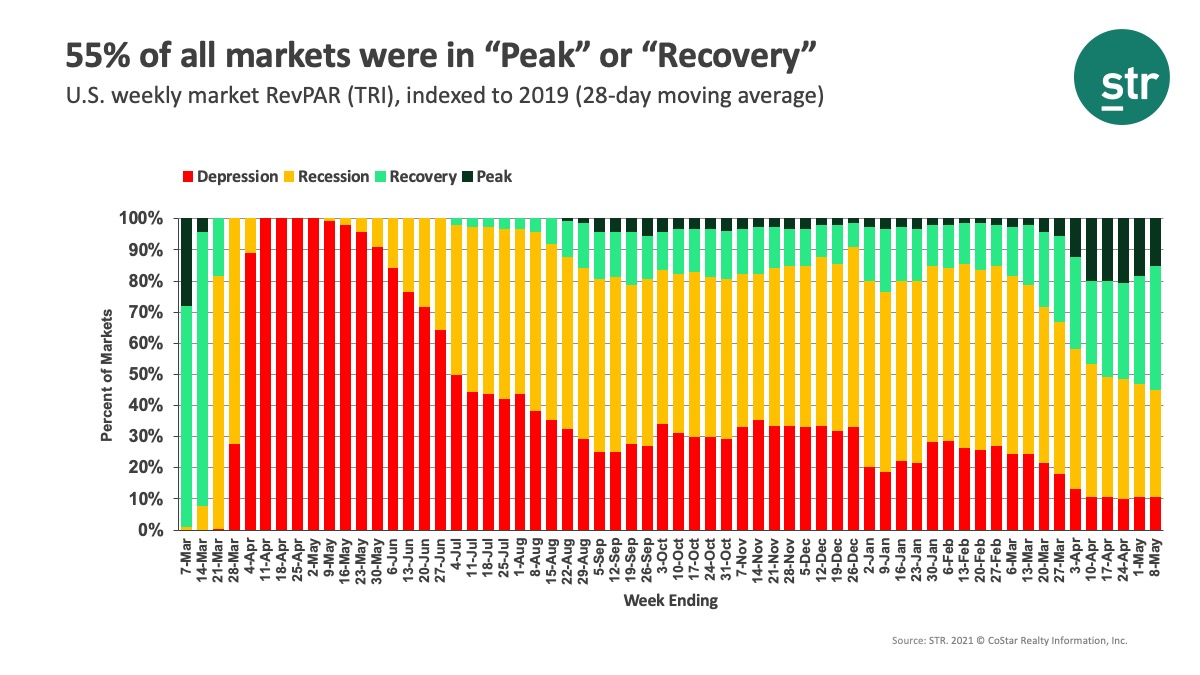
U.S. industry RevPAR inched closer to the 2019 level with the weekly RevPAR index at 67, meaning this week’s RevPAR was 67% of what it was in 2019 in the same week. A week ago, RevPAR indexed to 2019 was nearly two points lower. On a market basis, 55% (91 of 166) of markets were classified as being in “Peak” (2021 RevPAR greater than 2019 RevPAR) or “Recovery” (2021 RevPAR between 80% to 100% of 2019 RevPAR) for the week. The number of markets (18) in the “Depression” category (RevPAR indexed to 2019 below 50) remained unchanged from last week. Florida Keys had the highest index (142) as it has for weeks. Gatlinburg/Pigeon Forge, TN had the second highest weekly level followed by Sarasota FL, confirming the ongoing strength of the leisure market. In all for the week, 25 markets had a weekly RevPAR greater than their 2019 weekly results, which is down from the number we have seen over the previous four weeks.
Looking ahead, the hacking of the Colonial Pipeline and the resulting gasoline shortages will likely impact weekend travel up and down the East Coast this coming weekend (14-15 May). We also fear that it could impact travel related to university graduations, particularly in the South. The good news is that the disruption to car travel will be short with little to no impact on the upcoming Memorial Day weekend, which should put an end to the occupancy doldrums. Labor issues, however, could impact the industry’s ability to serve the highly anticipated surge in leisure travel over the summer. Now is the time to plan mitigation efforts.
Outside of the U.S.
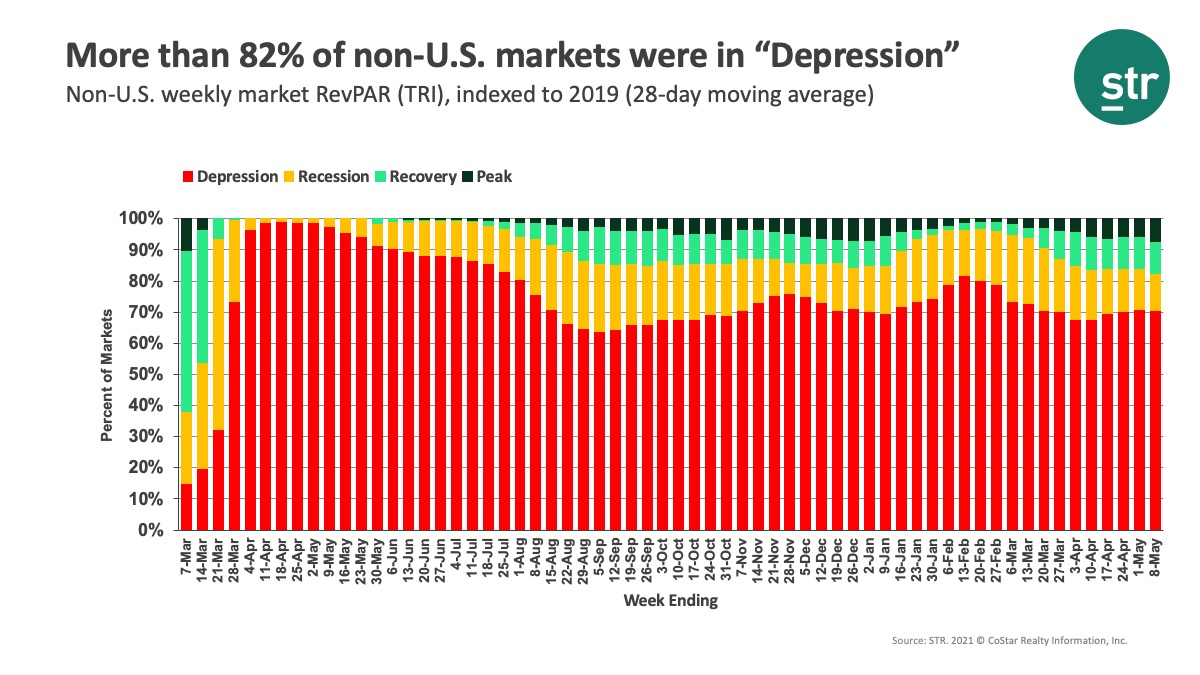
Occupancy continued to remain low with some exceptions. Eight countries or territories saw occupancy above 50% this week, including China, Australia, Russia, and Puerto Rico. Unfortunately, 75% of the 105 countries with sufficient and consistent data samples from 2019 showed weekly occupancy below 30% for the week. On a market level, 71% of 348 non-U.S. markets remained in the “Depression” category, unchanged from the previous week.
About the MRM
When the U.S. hotel industry reached the one-year anniversary of the earliest COVID-19 impact, year-over-year percentage changes became less actionable when analyzing performance recovery. Thus, STR introduced a weekly Market Recovery Monitor that categorizes each STR-defined market based on an indexed comparison with the same time periods in 2019. An index is simply a ratio that divides current performance by the benchmark (2019 data).
For example, during the week ending 6 March 2021, U.S. RevPAR was $48.13. In the comparable week from 2019, RevPAR was $87.75. This produces an index of 54.8 ($48.13/$87.75*100), meaning RevPAR was slightly more than half of what it was in 2019.
We use an index to place each market in one of four categories: depression (index <50), recession (index between 50 and 79.9), recovery (index between 80 and 99.9), and peak (index >=100). Additionally, we highlight other top market performances that contribute to higher levels of recovery across the U.S.
To learn more about the data behind this article and what STR has to offer, visit https://str.com/.


Sign up to receive our stories in your inbox.
Data is changing the speed of business. Investors, Corporations, and Governments are buying new, differentiated data to gain visibility make better decisions. Don't fall behind. Let us help.


Sign up to receive our stories in your inbox.
Data is changing the speed of business. Investors, Corporations, and Governments are buying new, differentiated data to gain visibility make better decisions. Don't fall behind. Let us help.