Week ending 12 June
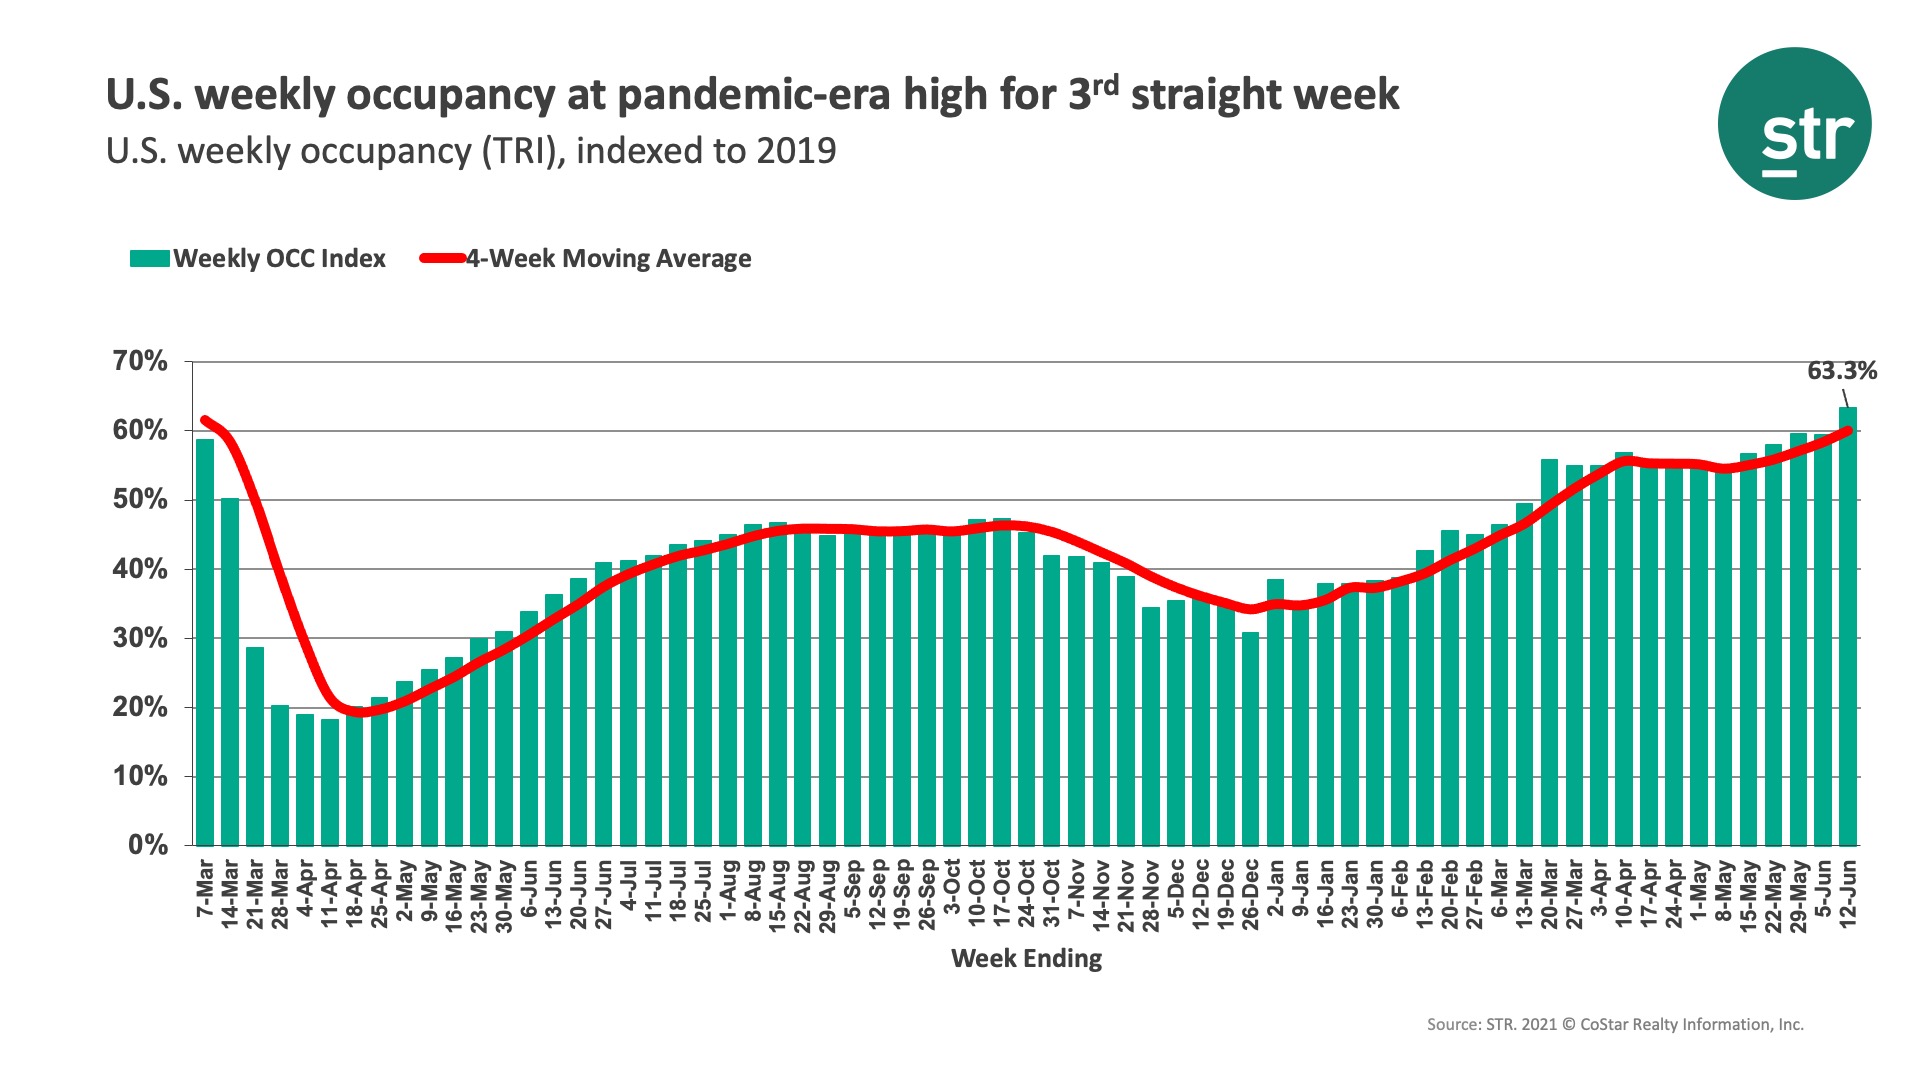
U.S. hotel industry occupancy soared to its highest level since November 2019, reaching 66.0% for the week ending 12 June 2021. Room demand surpassed 25 million in the week, up 1.6 million week on week, and was 91% of the level recorded in the comparable week from 2019. This is significant given the fact that business travel and group demand remain curtailed. Occupancy on Saturday reached 81%, a level like the Saturday of this year’s Memorial Day weekend, while the full weekend came in at 78.8%, the highest since fall 2019 and higher than the comparable weekend of 2019. Additionally, occupancy was above 62% for each day, except Sunday and Monday. On a total-room-inventory basis (TRI), which accounts for temporarily closed hotels, weekly occupancy was 63%, the highest since the start of the pandemic. TRI occupancy for the weekend was 75%, also a pandemic-era high.
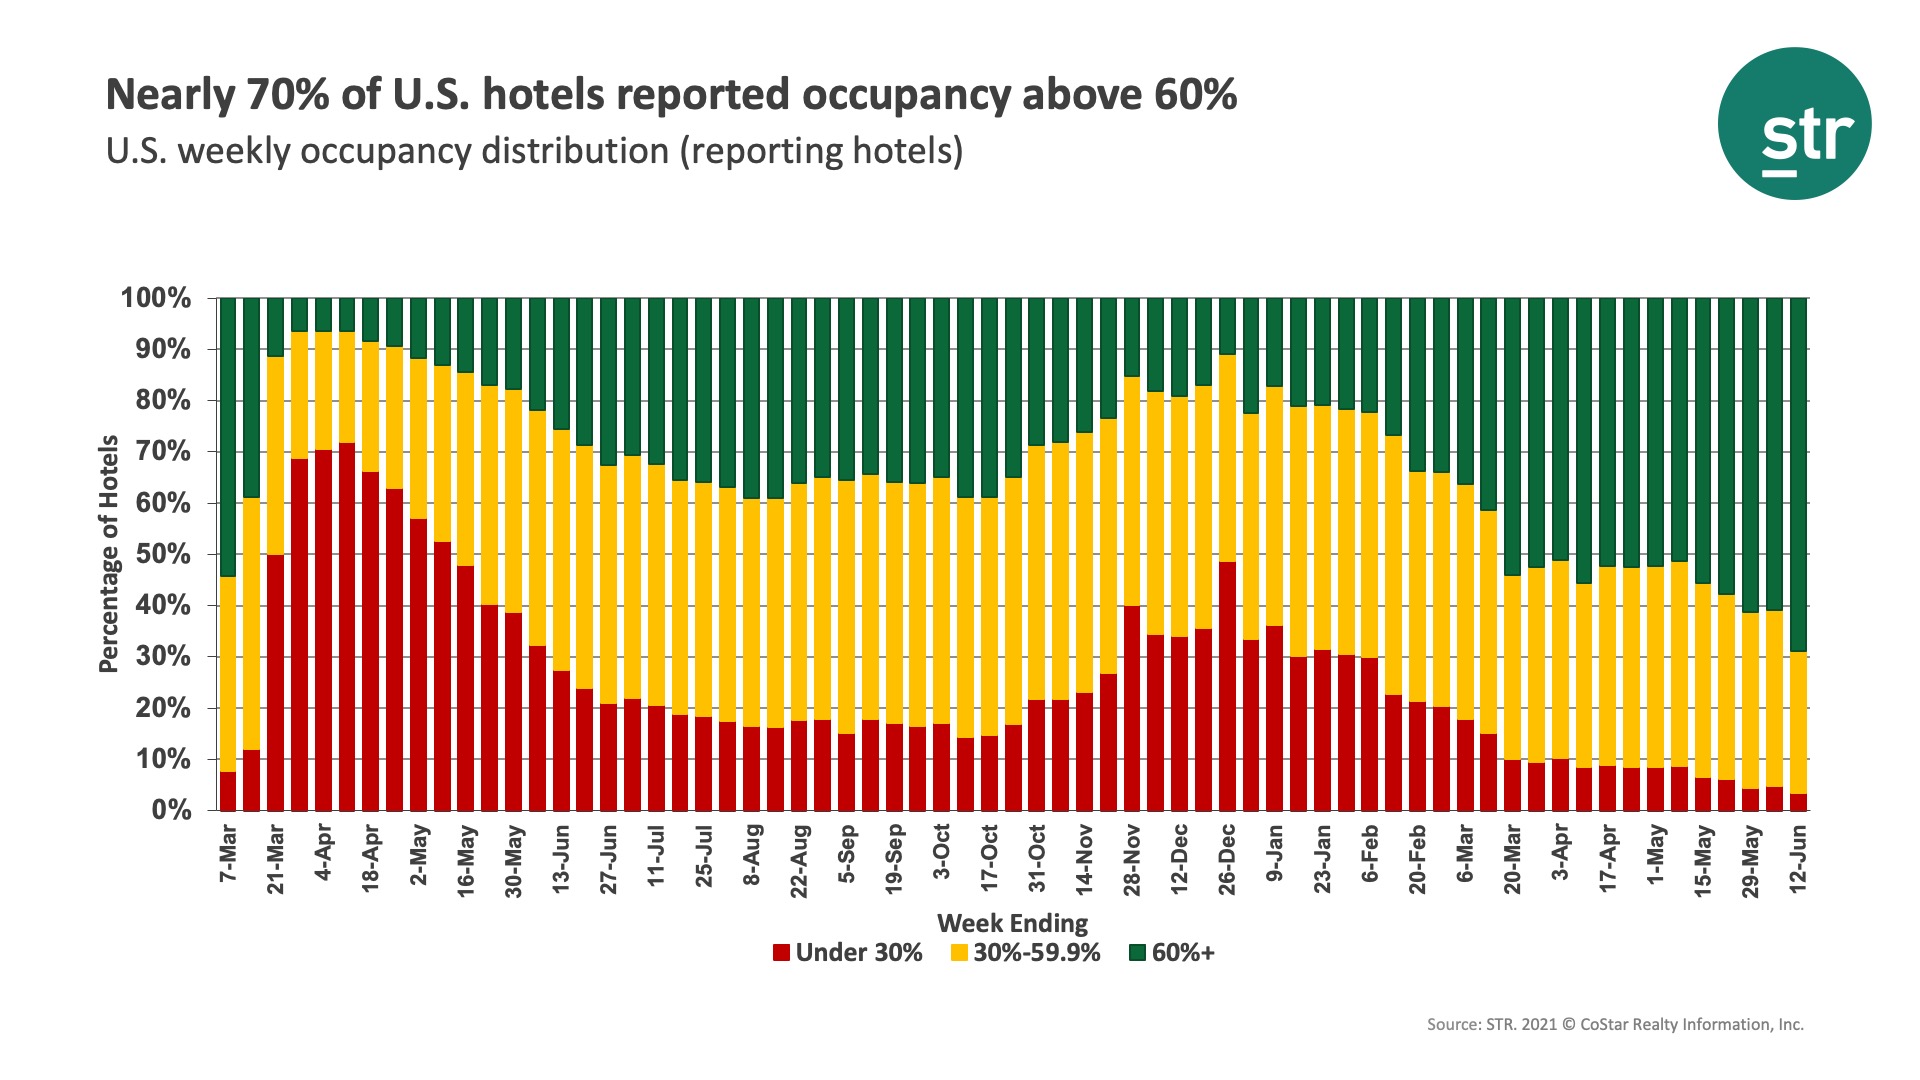
Nearly every market reported TRI occupancy above 50% in the week except San Francisco, New York, Washington, D.C., and Syracuse. Among open and operating hotels in New York, weekly occupancy rose to 62% as room demand increased to its highest level since the pandemic’s start. More than 70% of New York’s open hotels reported occupancy above 60% for the week. In contrast, only 48% of open hotels in D.C. saw occupancy above 60%.
Upper Midscale chains, the largest branded chain scale, had the highest TRI occupancy for the week (70%), its highest since October 2019. Economy chains had the next highest at just under 66%. TRI occupancy was lowest among Luxury (48%) and Upper Upscale (51%) hotels. Both chains scale have been hampered by the performance of large (300+ rooms) hotels in Urban locations, where TRI occupancy remains in the 40-49% range. Excluding those hotels, both chain scales would see occupancy approximately 5 points higher. It is worth noting that countrywide, large hotels (all locations and chain scales) reached 52% TRI occupancy in the week, which was the first time above 50% in more than a year.
Room demand improved in every market except six, with Columbus, OH posting the largest loss a week after it hosted the Memorial Tournament. Miami also saw a decline in its demand, but it’s index to 2019 remained above 100, meaning Miami sold more rooms this week than in the comparable week in 2019. Chicago saw the largest weekly gain in demand, but its volume was still 35% less than what it was for the 2019 comparable. Overall, nearly 40% of markets had demand at or above the level seen in 2019 with every market in Florida and South Carolina outperforming 2019 weekly demand except Orlando.
For the third consecutive week, ADR increased and was at 90%+ of the 2019 level. Weekend ADR was above the 2019 comparable for the third straight week. Most markets have an inflation-adjusted ADR at 80% or more of 2019’s levels. The quick rise in rates even merited a comment from the Federal Reserve board chairman, Jerome Powell, who said “we expect that those prices will get back up to where they were, but there is no reason to think that they’re going to keep going up a lot, because if they are people will build new hotels,” which would result in lower prices. ADR relative to 2019 remains subdued during the weekdays in the Top 25 Markets, where the index was in the low 70s this past week. On the weekends, relative ADR was like what is being seen across the country.
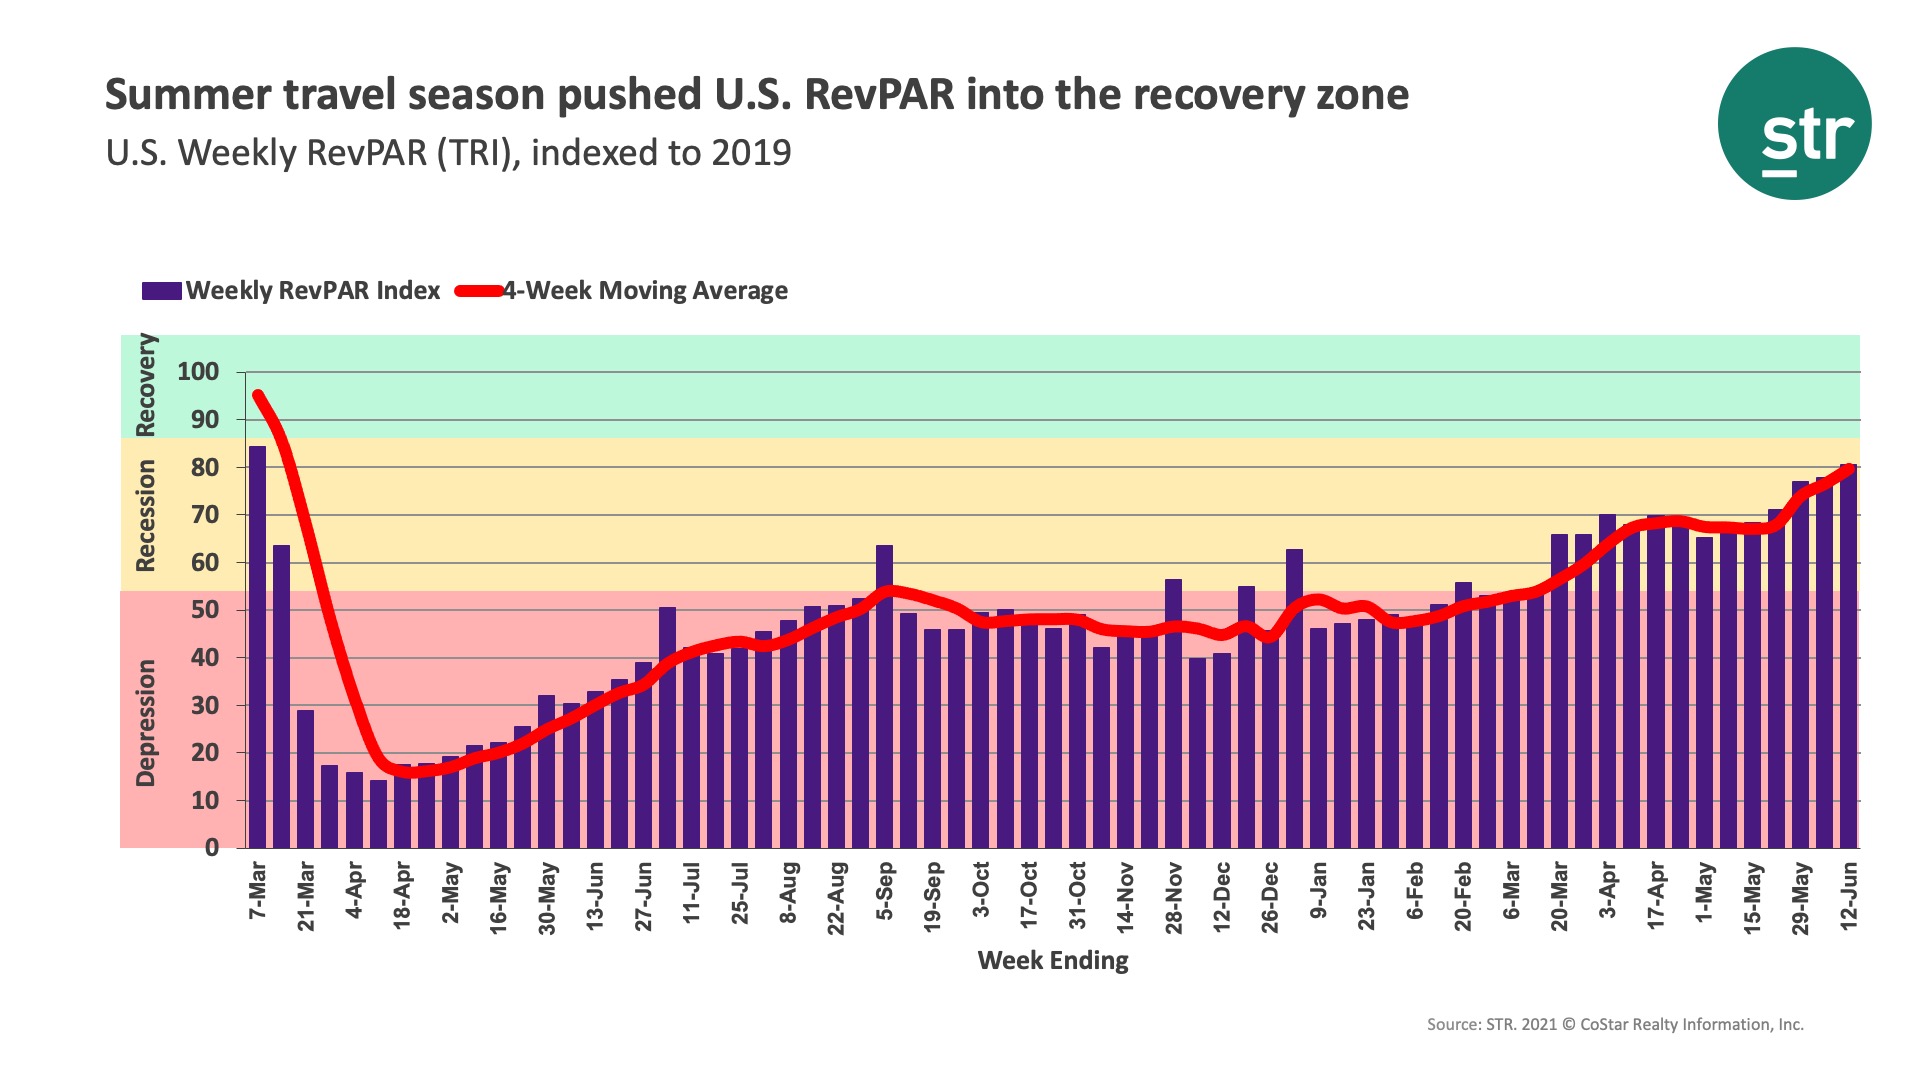
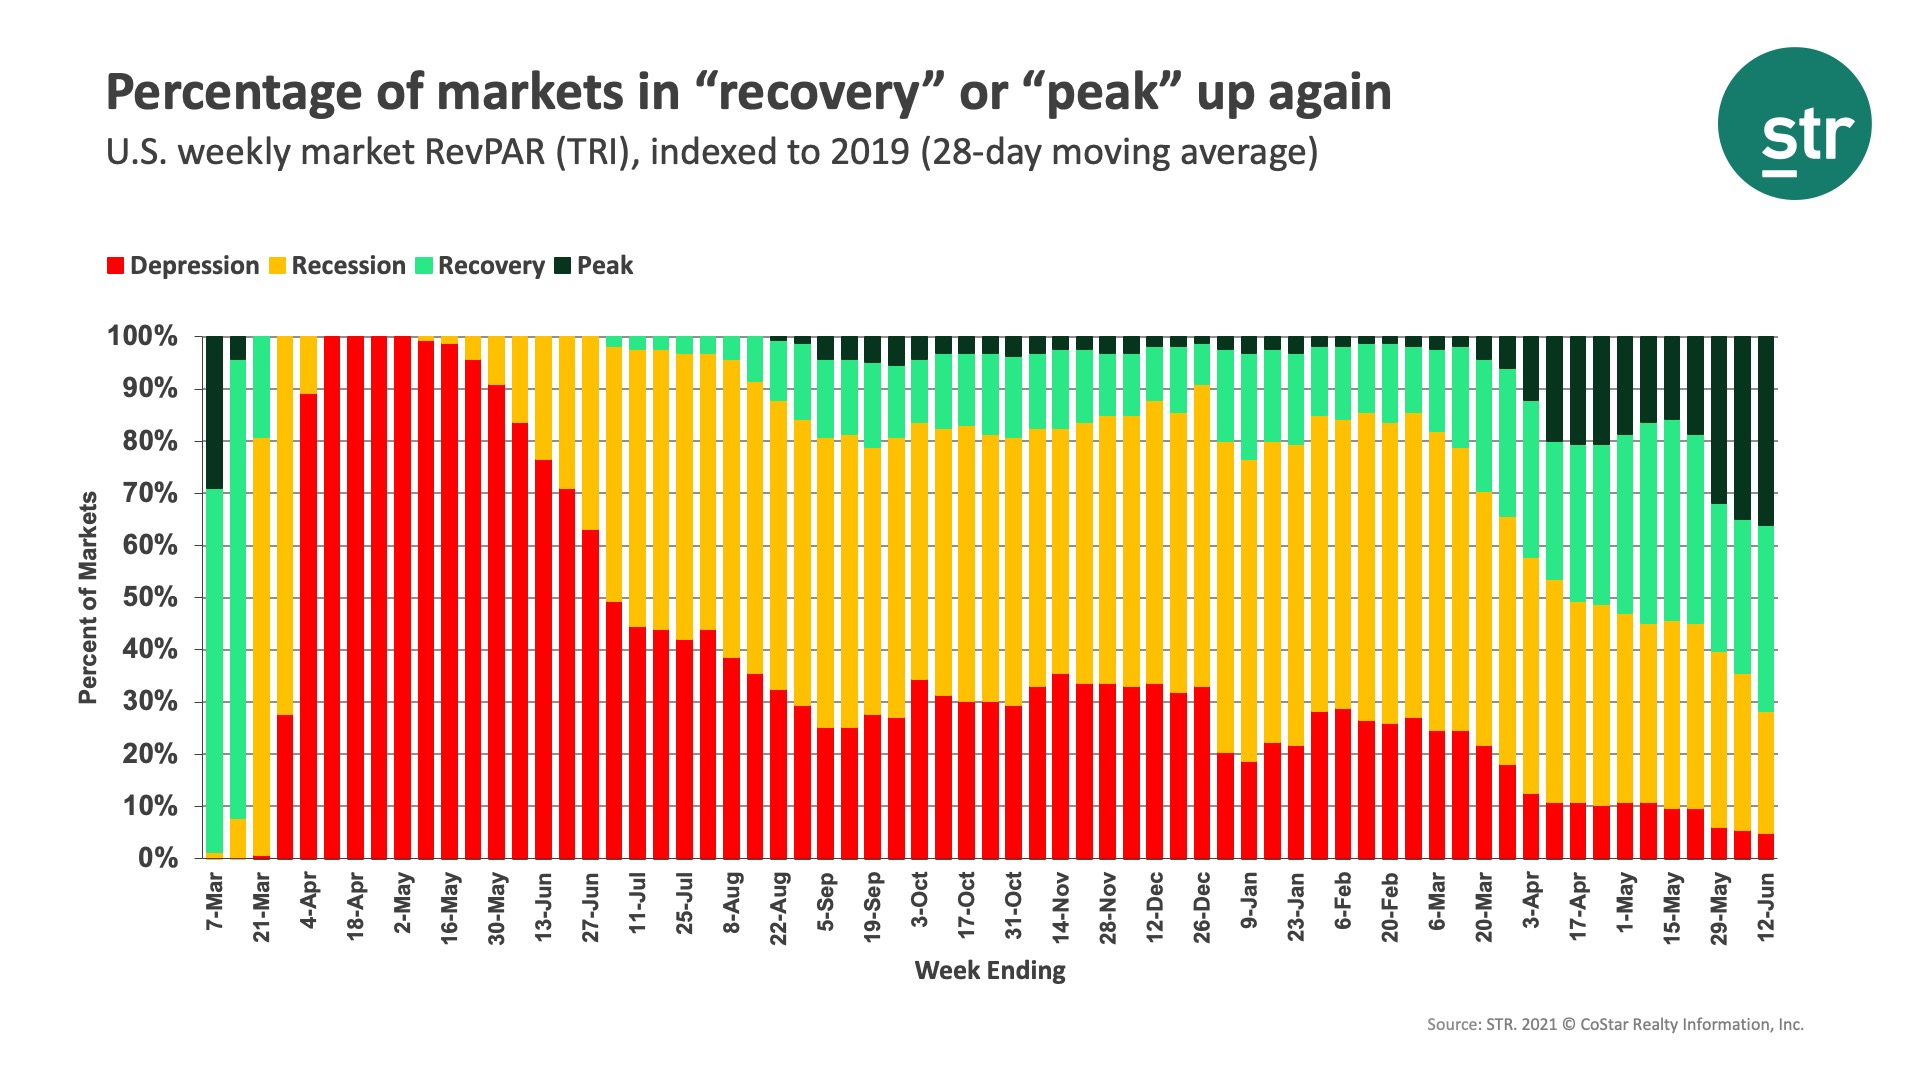
TRI RevPAR indexed to 2019 reached 77% this past week, just shy of the “recovery” level. Among open hotels, relative RevPAR was in the “recovery” zone. More than 64% of all markets are now in the “recovery” or “peak” categories, the most since the start of the pandemic. One-third of all markets are still in the “depression” and/or “recession” categories. As we have noted before, large (300+ rooms), urban, higher-chain scale hotels continued to be the ones with the lowest relative RevPAR to 2019. On the flip side, 45% of U.S. hotels showed weekly RevPAR higher than the corresponding week in 2019.
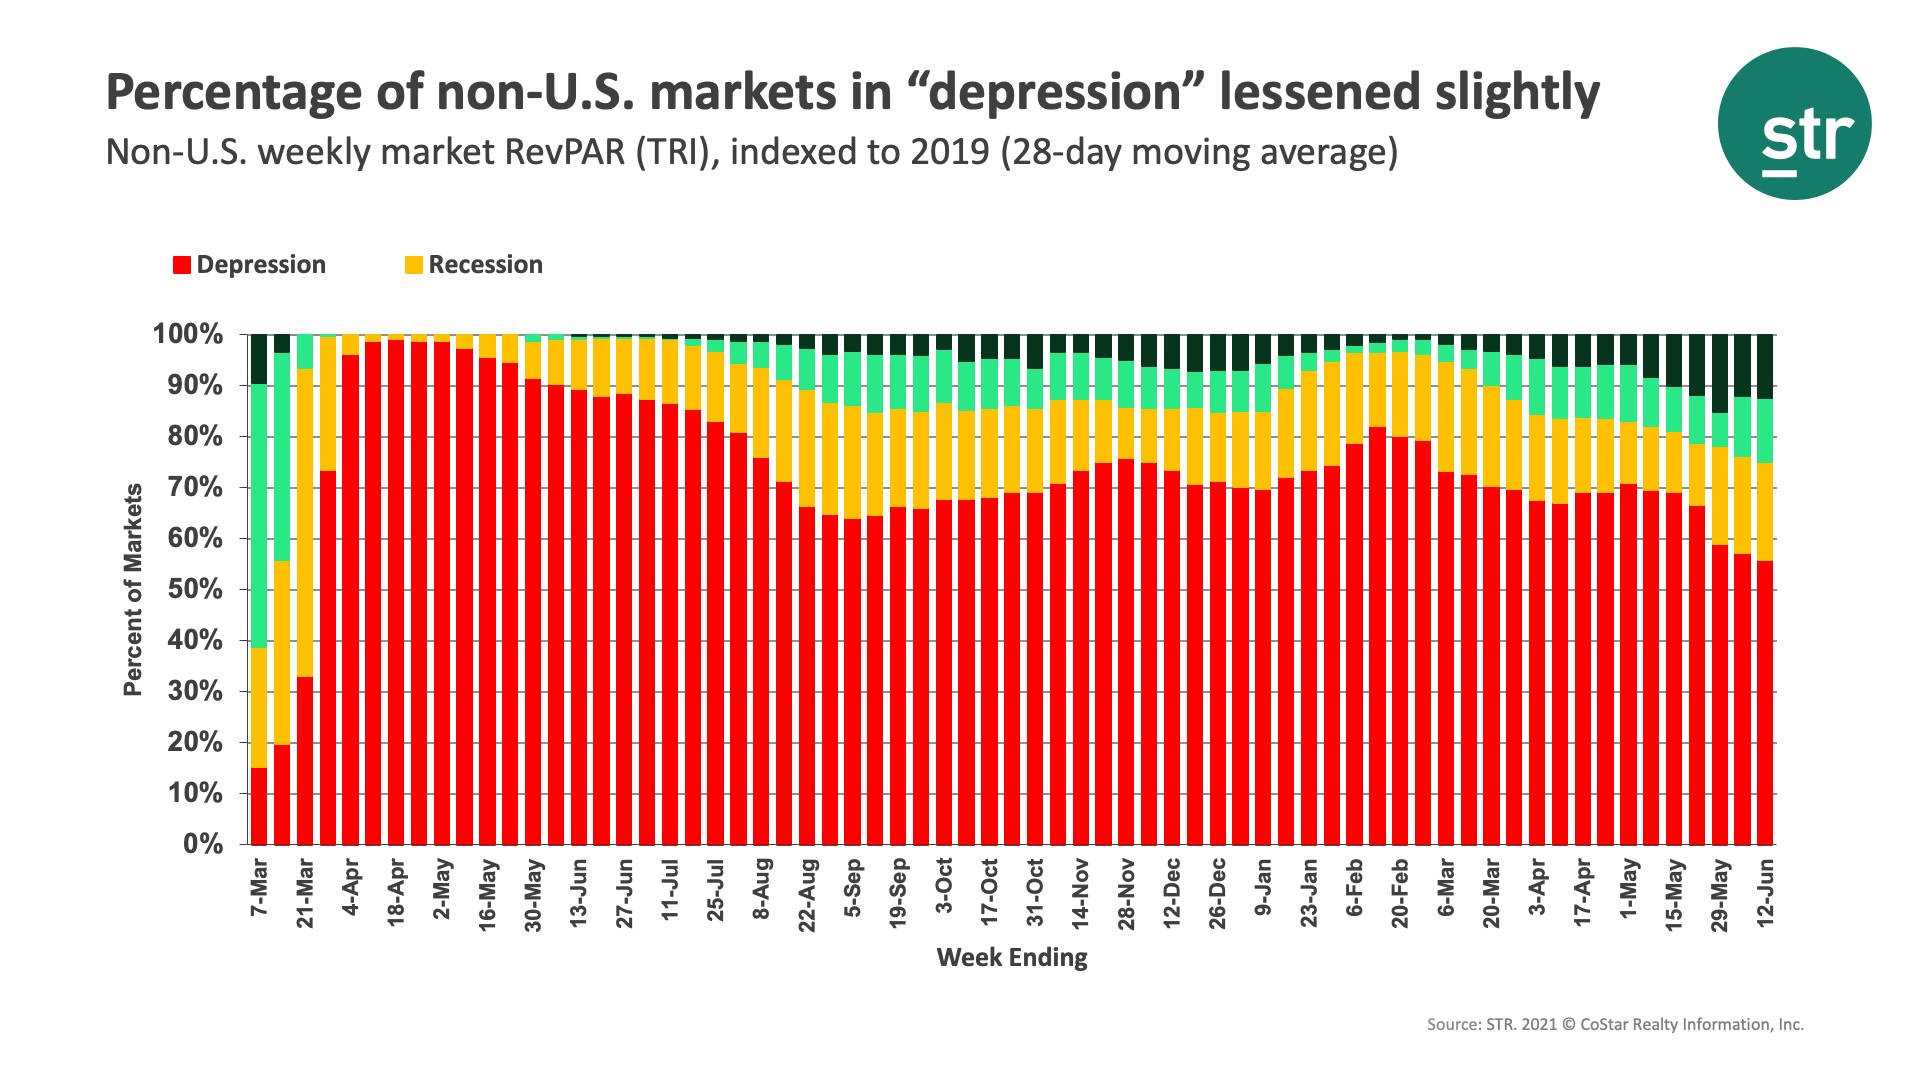
Performance outside of the U.S. stayed weak with 91 of the 100 countries tracked this week reporting TRI occupancy below 50%. The average occupancy for all 100 was at 32.3%, nearly unchanged from the prior week. TRI market-level RevPAR indexed to 2019 for all non-U.S. markets remained in the “depression” category. In total, 52% of all non-U.S. markets were in the “depression” category, down slightly from the prior week.
U.S. weekly performance was strong, and we expect it to be so through July and into August. Operators are telling us that it could be even better, but they are having to forgo occupancy due to ongoing labor shortages in many markets. It’s also great to see ADR returning to near pre-pandemic levels, which will certainly boost short-term profitability, but increasing costs could erode those gains. Only time will tell. In any case, we rejoice that people are traveling again and enjoying the many wonderful hotels our industry has to offer.
About the MRM
When the U.S. hotel industry reached the one-year anniversary of the earliest COVID-19 impact, year-over-year percentage changes became less actionable when analyzing performance recovery. Thus, STR introduced a weekly Market Recovery Monitor that categorizes each STR-defined market based on an indexed comparison with the same time periods in 2019. An index is simply a ratio that divides current performance by the benchmark (2019 data).
For example, during the week ending 6 March 2021, U.S. RevPAR was $48.13. In the comparable week from 2019, RevPAR was $87.75. This produces an index of 54.8 ($48.13/$87.75*100), meaning RevPAR was slightly more than half of what it was in 2019.
We use an index to place each market in one of four categories: depression (index <50), recession (index between 50 and 79.9), recovery (index between 80 and 99.9), and peak (index >=100). Additionally, we highlight other top market performances that contribute to higher levels of recovery across the U.S.
To learn more about the data behind this article and what STR has to offer, visit https://str.com/.


Sign up to receive our stories in your inbox.
Data is changing the speed of business. Investors, Corporations, and Governments are buying new, differentiated data to gain visibility make better decisions. Don't fall behind. Let us help.


Sign up to receive our stories in your inbox.
Data is changing the speed of business. Investors, Corporations, and Governments are buying new, differentiated data to gain visibility make better decisions. Don't fall behind. Let us help.