
We recently shared how our data is providing early and predictive signs that growth in Food Delivery spend remains elevated. While spend remains relatively high versus pre-pandemic levels, we can look at a number of underlying customer metrics to help unpack the reasons for the improvement.
This week we look at how customer cohort analysis enables a deeper and more accurate understanding of customer behaviour trends over time, relating to retention, spend frequency, order size and customer spend value.
Assessing these metrics provides a better understanding of what we can expect in the Food Delivery sector now that hospitality venues have begun to re-open.
Customers acquired during the pandemic stay longer and spend more often
The reduction in available hospitality outlets and lockdown restrictions saw Food Delivery spend per customer cohort improve almost immediately from the onset of the pandemic. Spend per customer cohort is a good proxy for measuring customer spend value and is measured by a number of metrics including monthly retention, transaction frequency and order size. We can measure spend per customer over varying periods of time (e.g. 3 months, customer lifetime etc). For the purpose of this analysis and to get the best read of how customer behaviour has changed since the pandemic began, we have assessed it on both an annual and six-monthly basis.
1. Monthly retention: While we see a large portion of new Food Delivery customers drop off after their first purchase, retention (measured by at least one transaction in the month) has continued to improve in customer cohorts acquired during the pandemic. The recent cohorts acquired in 2021 have shown the highest levels of retention. Even in the most recent April cohort we are continuing to see new customers trial Food Delivery platforms and maintain higher retention levels. We will watch this closely in the coming months, noting that indoor dining only resumed across the UK from May 17th.
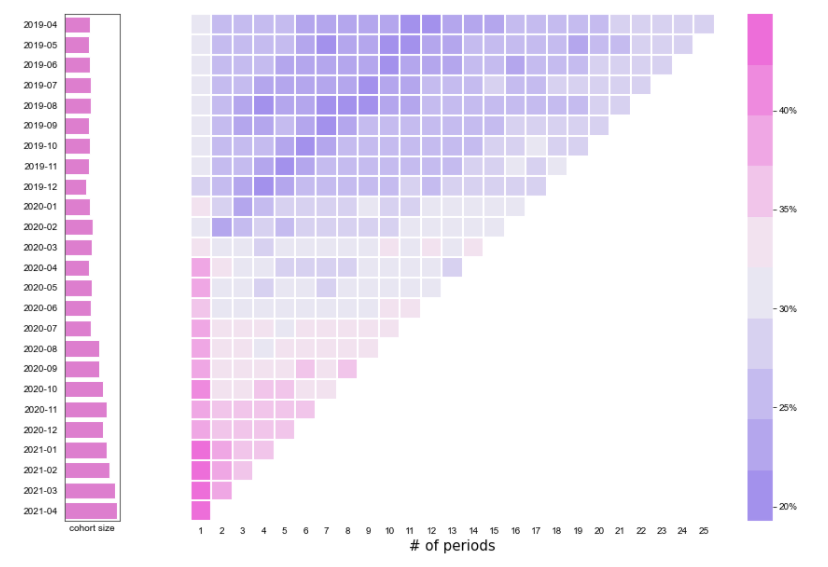
*Retention is measured by at least 1 transaction in the month for each customer cohort
2. Transaction frequency: As retention has improved we have also seen average monthly transaction frequency improve. Taking retention into account, consumer cohorts acquired after Feb 2020 have transacted between 10-40% more, or made 0.7-2.2 additional purchases during the first 6 months of trialling a Food Delivery platform (cohorts from March 2020 – Dec 2020) compared to Jan 2020 and Feb 2020 cohorts.
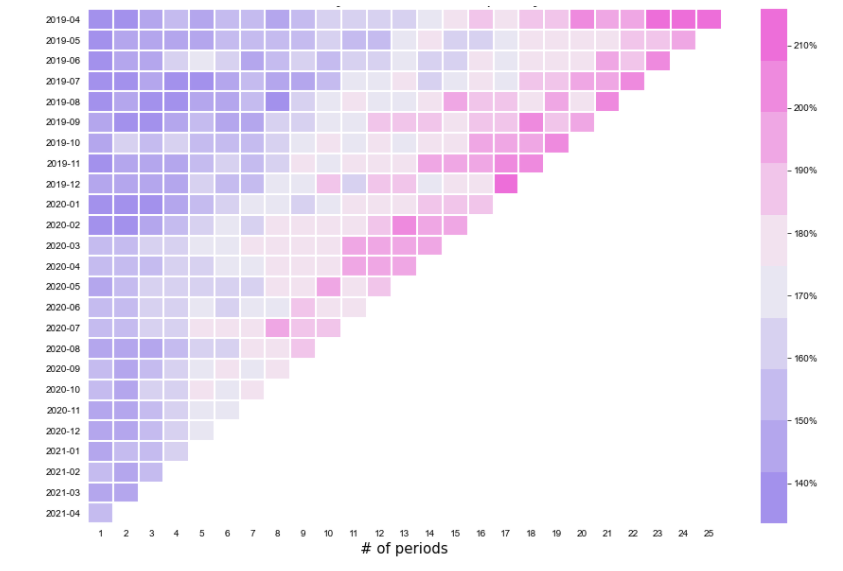
*Frequency is measured by the average number of transactions in a given month for a given cohort. Growth is relative to month 0.
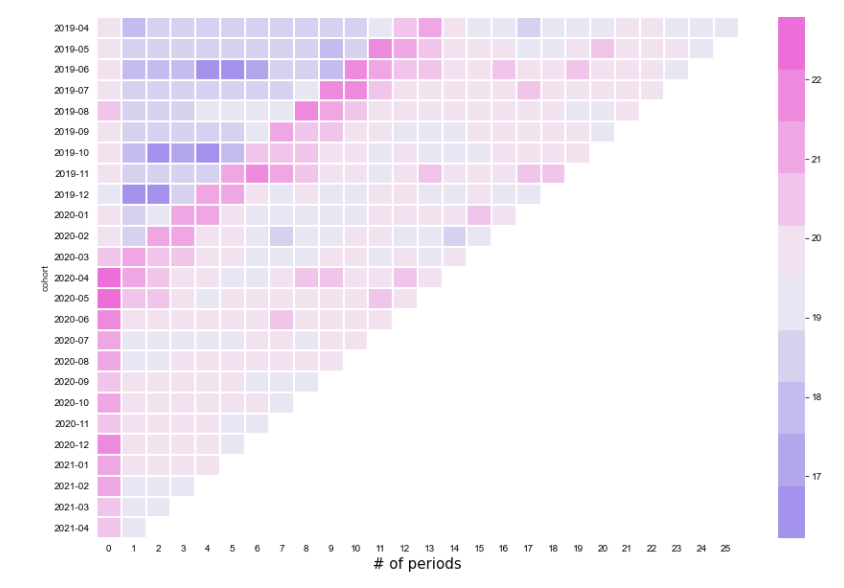
3. Order size: We see order size peak at the start of the pandemic before normalising. As outlined in last week’s blog, there are many drivers of this, including a growing number of lower cost options now available on food delivery platforms, and more competition and promotional activity particularly during lockdown periods. However this trend in normalised order size is not as pronounced for all industry participants.
Customer cohorts acquired during the pandemic spend over 50% more a year
Overall customer spend value is improving. Customers acquired during the pandemic have spent over 50% more than those acquired prior to the pandemic on a 12 month basis.
Using the metrics outlined above, in the charts below we have taken the average spend per customer (in the initial cohort) over the first 6 and 12 months and indexed the spend to April 2019. Only those customer cohorts with at least 12 or 6 months of spend have been included.
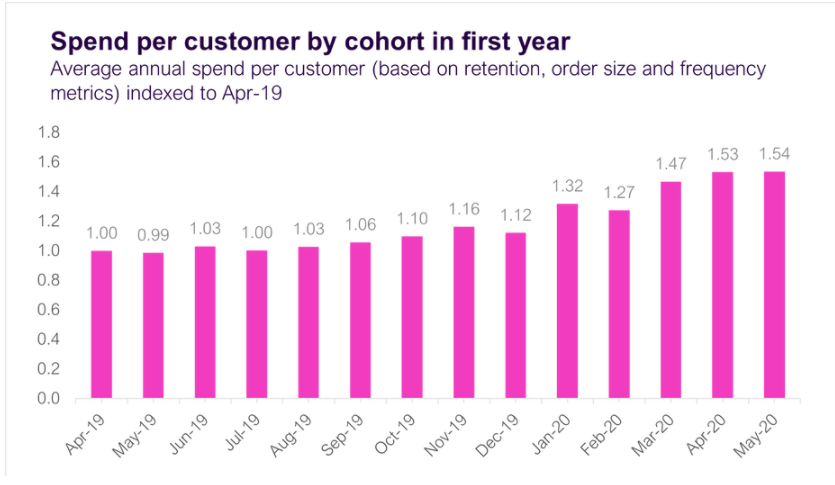
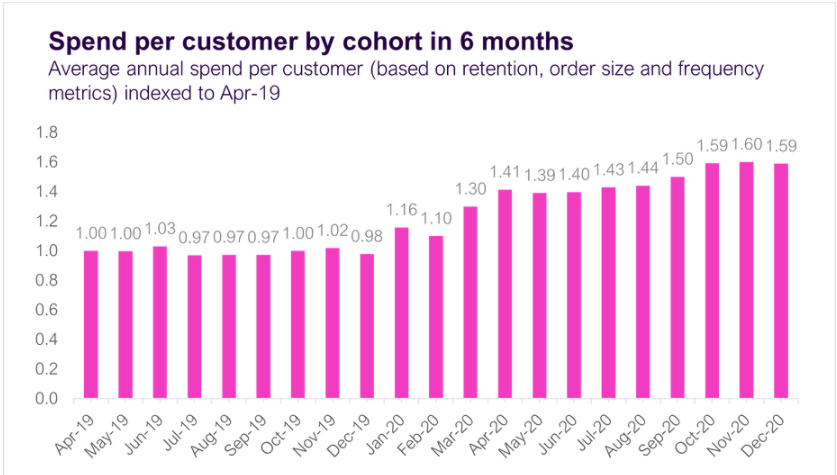
Looking at customer cohort spend over the first 6 months, recent cohorts have also shown spend per customer increase. The question is whether this trend will stay as restrictions lift and pubs and restaurants re-open.
As the economy continues to recover in the UK, we will look for the early and predictive signs in our data to indicate whether spending behaviour has changed more permanently or is showing signs of reverting to pre-pandemic norms.
To learn more about the data behind this article and what Fable Data has to offer, visit https://www.fabledata.com/.


Sign up to receive our stories in your inbox.
Data is changing the speed of business. Investors, Corporations, and Governments are buying new, differentiated data to gain visibility make better decisions. Don't fall behind. Let us help.


Sign up to receive our stories in your inbox.
Data is changing the speed of business. Investors, Corporations, and Governments are buying new, differentiated data to gain visibility make better decisions. Don't fall behind. Let us help.


