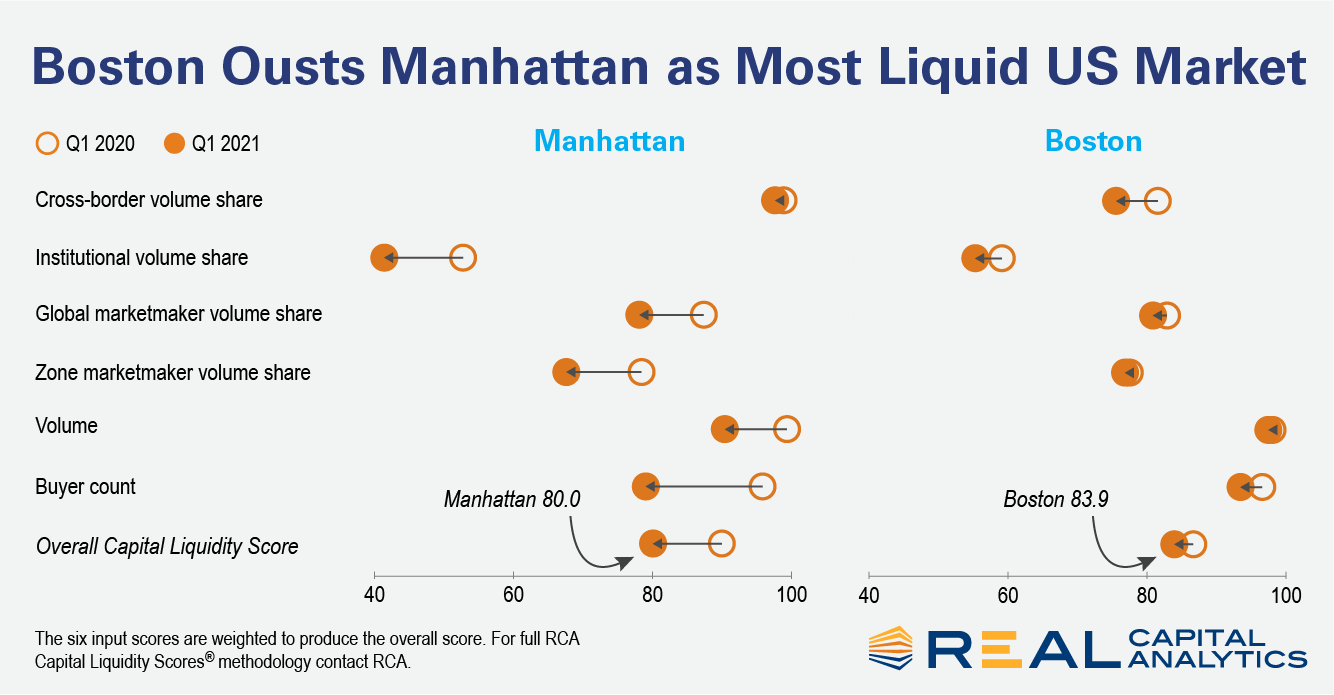
For the past two quarters, Boston has ranked as the most liquid commercial property market in the U.S., bumping Manhattan into second place, according to the RCA Capital Liquidity Scores. In the chart below we illustrate how Boston has usurped Manhattan, showing the six inputs which are weighted to calculate the overall scores.
–For Boston, the component of unique, active buyers has slipped only slightly in the past four quarters, while for Manhattan this input has been falling since the end of 2019, dropping at an accelerated pace over the past two quarters.

Boston’s score for investment volume has barely budged during the pandemic era, ranking behind only Dallas. Manhattan’s score for investment volume has dropped by 4%.
–Manhattan’s share of institutional investor volume has declined steadily since the start of 2019, though most institutional investors never could buy assets in pricey Manhattan. Boston’s share has dipped marginally.
–Manhattan’s share of global marketmaker volume and zone marketmaker volume is currently at the lowest ebb since the inception of the liquidity scores in 2008. Boston’s score has been little changed over the past four quarters.
–The cross-border share component has worked in Manhattan’s favor in recent quarters. While it has fallen marginally since the latter half of 2017, Manhattan still has strong cross-border presence relative to most markets.
To learn more about the data behind this article and what Real Capital Analytics has to offer, visit https://www.rcanalytics.com/.


Sign up to receive our stories in your inbox.
Data is changing the speed of business. Investors, Corporations, and Governments are buying new, differentiated data to gain visibility make better decisions. Don't fall behind. Let us help.


Sign up to receive our stories in your inbox.
Data is changing the speed of business. Investors, Corporations, and Governments are buying new, differentiated data to gain visibility make better decisions. Don't fall behind. Let us help.


