
Week ending 26 June
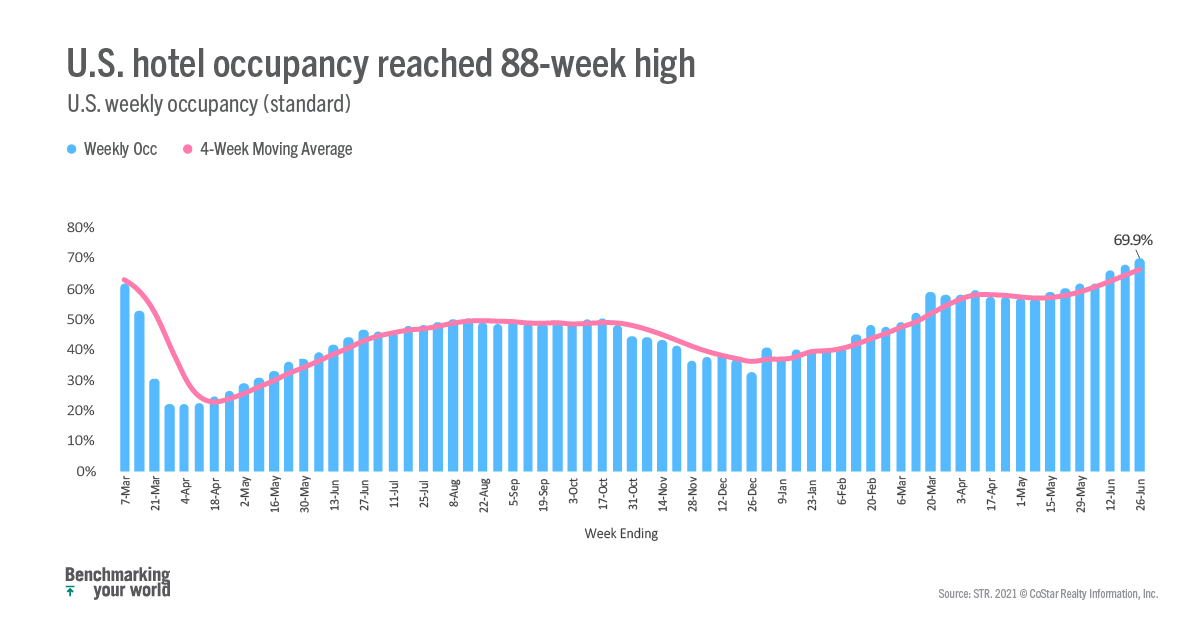
While summer travel has not yet been “record-breaking” as some predicted, growth for the U.S. hotel industry has simply been spectacular over the past month. We expect that June will produce more than 110 million room nights sold, the most since October 2019. Room revenues have also been a pleasant surprise and are predicted to be down just 10% from what they were in June 2019. Last week’s results added to the good news with most metrics reaching pandemic-era highs. Occupancy for the week ending 26 June 2021 hit 69.9%, which was the industry’s highest level in 88 weeks. Weekend (Friday & Saturday) occupancy soared to 82% and has surpassed the comparable period in 2019 twice over the past three weeks. This was the first time that weekend occupancy surpassed the 80% level since October 2019. Not to be left out, weekday occupancy (Sunday-Thursday) advanced to 65%, which was also the highest level since November 2019. On a total-room-inventory basis (TRI), which accounts for temporarily closed hotels, weekly occupancy was 66.8%.
Weekly room demand reached 26.8 million, indexing at 94 to 2019, meaning weekly demand was down just 6% versus the comparable week two years ago. Of the 166 STR-defined markets, 75% reported weekly demand greater than 90% of their 2019 comparable with 50% of all markets seeing higher demand this week than in the comparable week two years ago. At the submarket level (654), there are seven where demand is less than 50% of what it was in 2019, with four submarkets (Midtown East, N.Y., San Francisco Market St., Minneapolis CBD, and Midtown West/Times Square NY) showing about 40% of the demand they reported two years ago. Weekly TRI occupancy among the submarkets ranged from 29% in Midtown East in New York City to 93% in Key West. Seventy-two percent of submarkets reported TRI occupancy between 60% and 70%.
At the hotel level, nearly one fifth of all reporting hotels had occupancy above 90% during the week, but that is less than what was seen in 2019. A deeper look revealed that the percentage of hotels with occupancy below 60% is higher this year than what it was in 2019. That is due to the continued drag from large hotels (300+ rooms), where weekly occupancy was 13 points lower this week than all other hotels. That trend continues to be a function of limited group and business demand. Excluding large hotels, weekly occupancy jumps to 72% and has nearly identical distribution to 2019.
Weekly ADR, not adjusted for inflation, was essentially the same as it was in 2019, led by hotels outside the Top 25, where weekly ADR was at its highest level in history. Overall, 61% of all reporting hotels had a higher ADR this past week as compared to two years ago. On average, 77% of hotels in Resort, Interstate and Small Metro/Town locations had a higher ADR this week than what they did in 2019. Accounting for inflation, weekly ADR was 5% lower this past week than what it was during the comparable 2019 week. However, weekend ADR was 13% higher this week than it was in 2019 and is at a record high. Even when accounting for inflation, weekend ADR is at its highest level ever. Weekday ADR is nearing its 2019’s level.
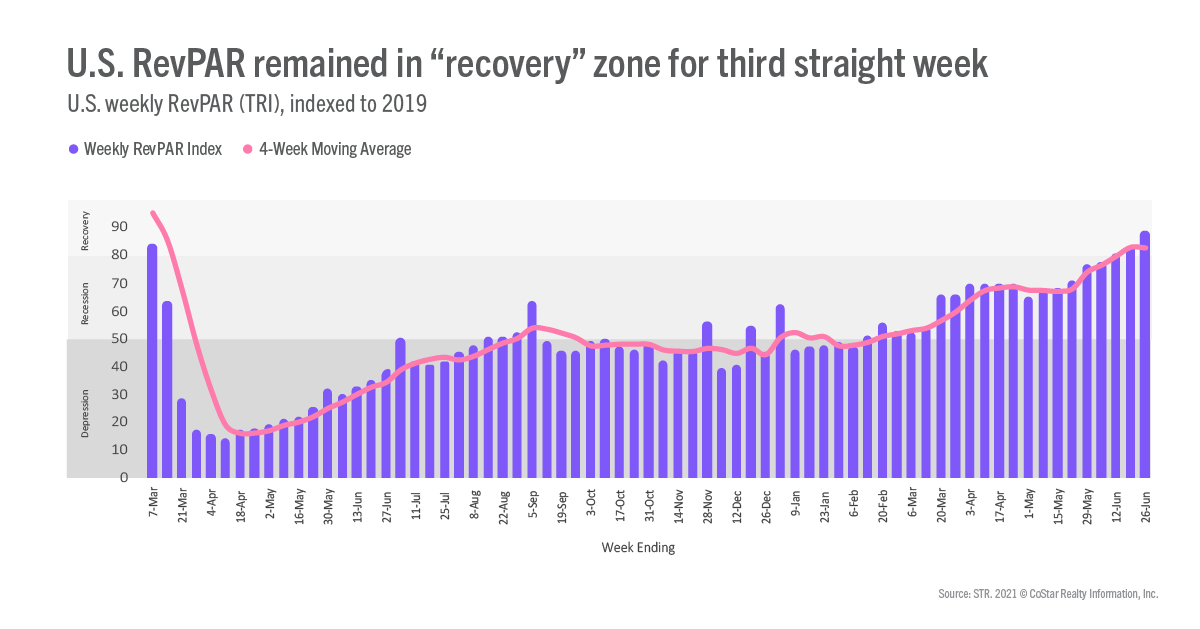
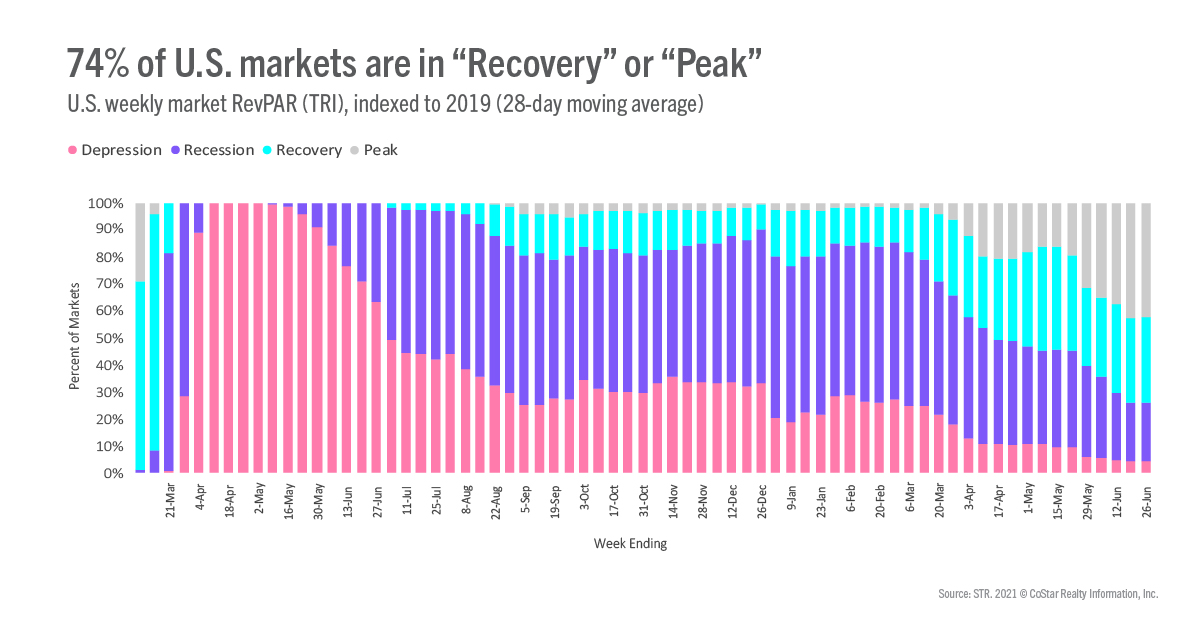
Absolute TRI RevPAR hit yet another pandemic-era high (US$89). When indexed to its comparable week in 2019, TRI RevPAR remained in STR’s “recovery” zone (TRI RevPAR indexed to 2019 between 80 and 100) for a third straight week. More than 42% of all markets were in the “peak” category (TRI RevPAR indexed to 2019 greater than 100) with another 32% in recovery. The percentage in both was nearly identical to the previous week. Seven markets remain in the “depression” zone (TRI RevPAR indexed to 2019 less than 50). That too was unchanged from last week and continued to include Boston, Chicago, New York, San Francisco, and Washington, D.C.
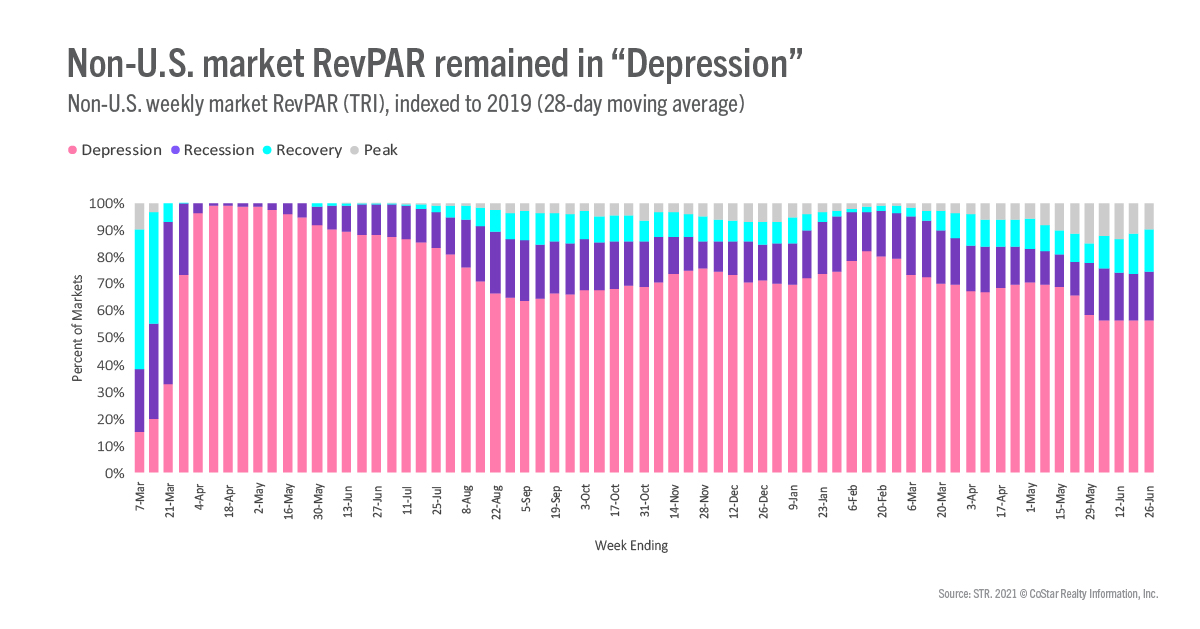
Performance outside the U.S. improved slightly as weekly TRI occupancy increased by nearly two points week over week to 36%. Among the top 10 countries based on supply, TRI occupancy ranged from 53% in China and the U.K. to 17% in Japan. Canadian TRI occupancy has risen by 3 points week on week for the past two weeks with weekly TRI occupancy hitting 36%, the highest in nearly a year. TRI RevPAR indexed to 2019 for most global markets (75%) remained in the “depression” or “recession” categories with no real change from the previous week.
While global markets continue to suffer, the trajectory seen in the U.S. will likely manifest itself in those markets when travel restrictions and the like abate further. The U.S. is expected to see solid growth until summer’s end. There is hope that business and group travel will strengthen like what has been seen with leisure, but the outlook remains cloudy at best. Like we mentioned last week, a few weeks of RevPAR indexed to 2019 in the “recovery” category does not mean the U.S. industry has recovered. We know that the recovery is uneven, and many hotels are still struggling through difficult financial conditions. One thing is certain, we are on the road to recovery but it’s going to be quite a journey.
About the MRM
When the U.S. hotel industry reached the one-year anniversary of the earliest COVID-19 impact, year-over-year percentage changes became less actionable when analyzing performance recovery. Thus, STR introduced a weekly Market Recovery Monitor that categorizes each STR-defined market based on an indexed comparison with the same time periods in 2019. An index is simply a ratio that divides current performance by the benchmark (2019 data).
For example, during the week ending 6 March 2021, U.S. RevPAR was $48.13. In the comparable week from 2019, RevPAR was $87.75. This produces an index of 54.8 ($48.13/$87.75*100), meaning RevPAR was slightly more than half of what it was in 2019.
We use an index to place each market in one of four categories: depression (index <50), recession (index between 50 and 79.9), recovery (index between 80 and 99.9), and peak (index >=100). Additionally, we highlight other top market performances that contribute to higher levels of recovery across the U.S.
To learn more about the data behind this article and what STR has to offer, visit https://str.com/.


Sign up to receive our stories in your inbox.
Data is changing the speed of business. Investors, Corporations, and Governments are buying new, differentiated data to gain visibility make better decisions. Don't fall behind. Let us help.


Sign up to receive our stories in your inbox.
Data is changing the speed of business. Investors, Corporations, and Governments are buying new, differentiated data to gain visibility make better decisions. Don't fall behind. Let us help.