
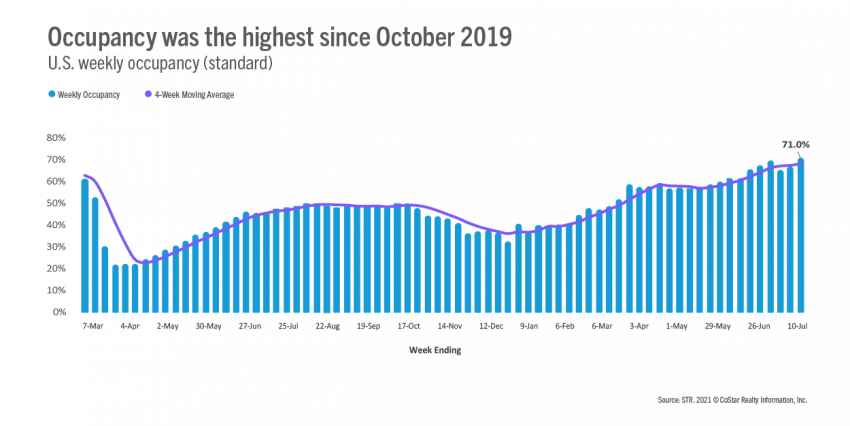
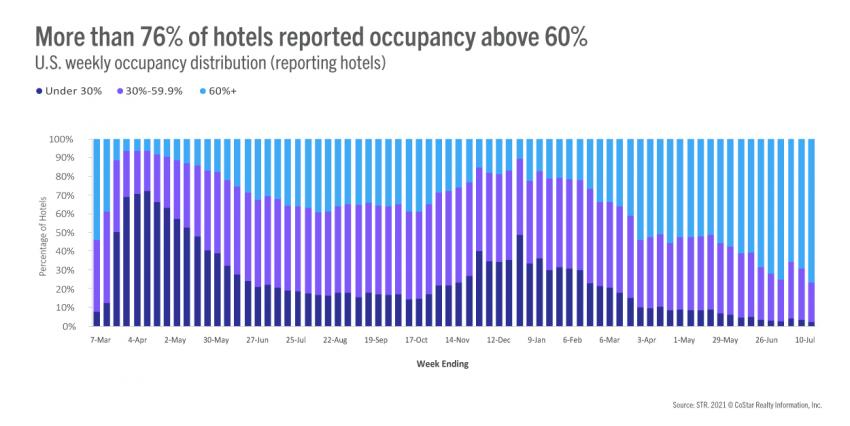
In the week ending 17 July 2021, occupancy soared to 71.0%, its highest level since the Columbus Day holiday week of October 2019. Also for the first time since the week ending 19 October 2019, daily occupancy was above 70% Wednesday through Saturday. Weekend occupancy surpassed 80% for the second time this year but was shy of the high recorded four weeks ago. Excluding STR’s Top 25 Markets, occupancy was 72% and was the best since late summer 2019. Small (under 75 rooms) and medium (75-299 rooms) hotels did even better with occupancy of 73% for the week. More than one-fifth of all reporting hotels had occupancy above 90%, which was the most since summer 2019 but still fewer than the 27% at or above that level during the corresponding week last year. On a total-room-inventory basis (TRI), which accounts for temporarily closed hotels, weekly occupancy was 68.2%.
For the past six weeks, Resort location hotels have had the highest occupancy and this week was no exception with occupancy of 76%. Occupancy was 72% in all other location types (Airport, Interstate, Small Metro and Suburban) except Urban, where occupancy was 63%—the highest for Urban hotels during the past 72 weeks. As compared to the same week in 2019, occupancy remained at a deficit except in Interstate locations, which had a one-point premium and are benefiting from the increase in “drive-to” vacations. Small Metro locations are also doing well and were just slightly below the levels of 2019. On the other hand, hotels in Urban locations had nearly a 20-point occupancy gap versus the same week in 2019 followed by Airport hotels with an 11-point occupancy gap. In summer 2019, Airport and Urban location hotels had the highest occupancy, while Interstate and Small Metro were the lowest. Resorts were in the middle.
Resort-type markets also continue to see the highest occupancy levels, led again this week by Gatlinburg/Pigeon Forge, TN (91%). On the other end of the spectrum, San Francisco remained at the bottom (49%) as it has for most of the year. Seventeen markets reported occupancy of 80% or more in the week as compared to 59 in the same week of 2019. Demand was up across nearly every market with Denver seeing the largest increase due to its hosting of Major League Baseball’s All-Star Game. Washington, D.C., which has accompanied San Francisco at the bottom in terms of occupancy, saw its largest demand gain since the presidential inauguration as vacation travelers returned with the gradual reopening of attractions.
After the industry achieved an all-time high last week, ADR came in slightly lower, making it the second highest in history. Of 166 STR-defined markets, 60 saw ADR decrease by 1% or more week on week. Even though weekly ADR declined, it remained above the level seen in 2019 for a third consecutive week with weekend ADR remaining above its 2019 level for an eighth week.
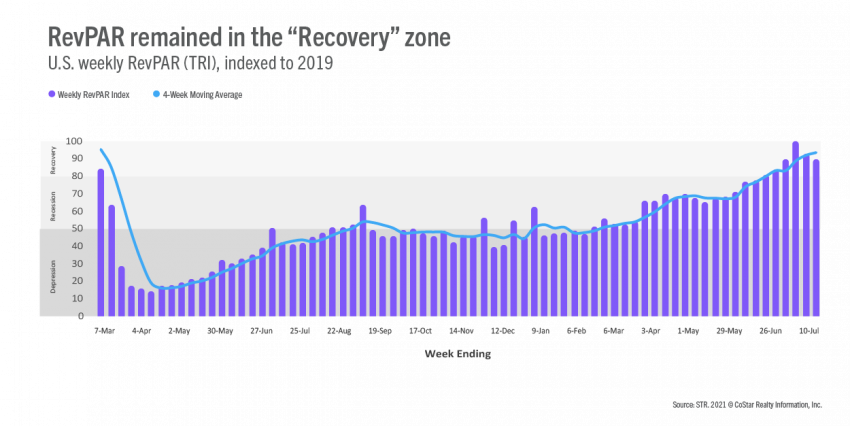
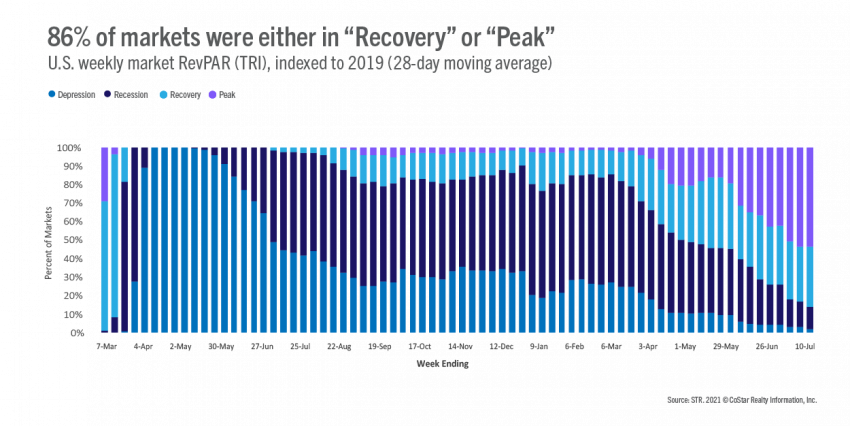
TRI RevPAR stayed in the “Recovery” category (TRI RevPAR indexed to 2019 between 80 and 100) for a sixth week, dropping to a level seen three weeks ago. Using a 28-day moving total to smooth out shifts in holidays, 89 of the STR markets (54%) had TRI RevPAR classified as “Peak” as TRI RevPAR indexed to 2019 was above 100; the number of markets was unchanged from last week. More markets entered “Recovery” with 54 (33%) in that category this week. Twenty markets remained in “Recession” (TRI RevPAR indexed to 2019 between 50 and 80) with three in “Depression” (TRI RevPAR indexed to 2019 below 50). The three in “Depression” were San Francisco, San Jose and New York City. Notable markets in “Recession” included Chicago, New Orleans, Philadelphia, Portland, and Seattle. On a sub-market basis, San Francisco Market St had the lowest 28-day TRI RevPAR indexed to 2019 at 27 (meaning this week’s RevPAR was only 27% of what it was in the comparable week of 2019) followed by New York Midtown East at 31. On the other end, Round Rock/Georgetown, TX indexed above 200 for a second consecutive week. More than half (335 of 654) of all submarkets were at “Peak” and 19 were in “Depression.”
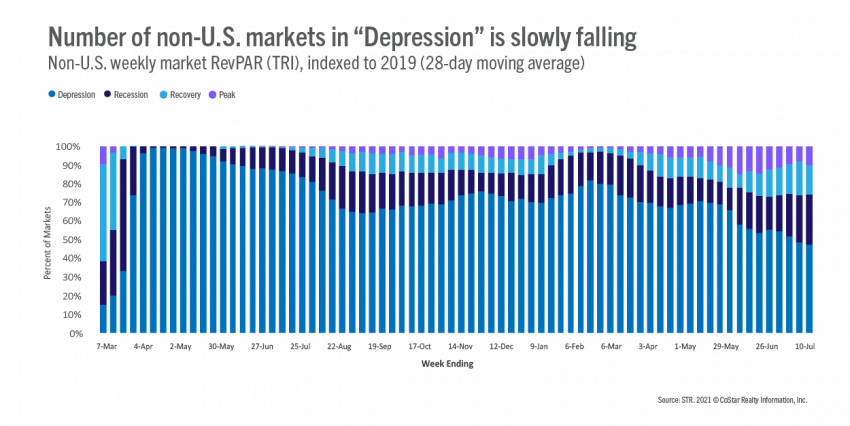
Occupancy outside the U.S. improved to 41%, which was the best since the start of the pandemic. Among the largest countries based on supply, China’s occupancy improved to 61%, its highest of the past nine weeks. U.K. occupancy also grew week on week growth, topping 57% with more to come as the country reopens. Canada and Mexico occupancy also improved to 47%. Japan remained at the bottom with occupancy below 20%. Among markets, TRI RevPAR on a 28-day moving average and indexed to 2019 also showed improvement with the number of markets in “Depression” falling to 47% (165 of 348 comparable markets). Another 93 were in “Recession.” On the positive end, about one quarter of markets were either in “Recovery” or “Peak.” The percentage has varied only slightly over the past several weeks.
While this week saw the highest U.S. occupancy since 2019, there is growing concern that the spread of the Delta variant could impact demand in the coming weeks. If that happens, we could currently be at or nearing the year’s occupancy peak as lower levels were already expected for the fall because of missing business and group demand along with reinstatement of in-person school, which will reduce weekday leisure travel. Like the summer’s best thrill ride, we expect the next several months to have many ups, downs and sharp turns.
To learn more about the data behind this article and what STR has to offer, visit https://str.com/.


Sign up to receive our stories in your inbox.
Data is changing the speed of business. Investors, Corporations, and Governments are buying new, differentiated data to gain visibility make better decisions. Don't fall behind. Let us help.


Sign up to receive our stories in your inbox.
Data is changing the speed of business. Investors, Corporations, and Governments are buying new, differentiated data to gain visibility make better decisions. Don't fall behind. Let us help.