
For a third consecutive week, occupancy remained above 70% (25-31 July 2021), but that was down from the pandemic-era high (71.4%) achieved in the previous week. While occupancy slipped, average daily rate (ADR) advanced to yet another record high (US$143) on a nominal basis. Nominal revenue per available room (RevPAR) stayed above US$100 for a second week, though it also fell from the previous week’s level. On a total-room-inventory basis (TRI), which accounts for temporarily closed hotels, weekly occupancy was 67.5% and nominal RevPAR was US$97. Those TRI metrics include the 1.3% of U.S. rooms still closed because of the pandemic.
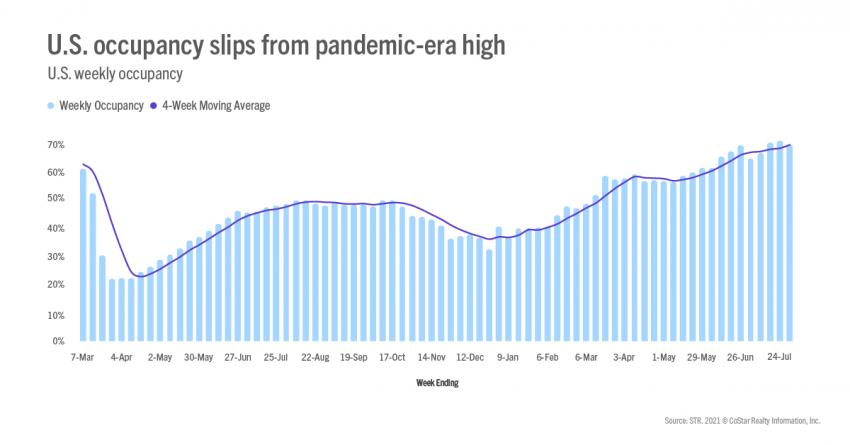
After two weeks above 27 million, weekly room demand fell below that level, and was about 95% of the level seen in the comparable week of 2019. Demand has been down by an average of 8% compared with 2019 for the past eight weeks. However, we expect that gap to widen in the coming weeks as in-person school begin. STR’s School Break Report reveals that most U.S. schools will be in session by the third week of August. Anticipate that demand, and subsequently occupancy, will slide downward each week as schools restart. With the rise in COVID-19 cases due to the Delta variant, we don’t believe that dwindling leisure demand will be mitigated by an uptick in business and group travel. Also, unlike last year, demand will likely not be supported by the ability for families with children to work and attend school virtually.
Among open hotels, the number of markets with occupancy above 80% fell from 29 in the previous week to 25 during the most current week. However, two markets, Gatlinburg/Pigeon Forge, TN, and Colorado Springs, have remained above 90% for the past two weeks. There were also less markets with occupancy between 70% and 80% as well as more with occupancy between 60% and 70%. Four markets saw strong weekly occupancy gains with Chicago seeing the largest gain in demand due in part to the Lollapalooza music festival. Chicago occupancy has been above 60% for the past four weeks. Tucson remained at the bottom for a third week. Among the Top 25 Markets and using STR’s TRI methodology as most of the hotels temporarily closed are in that group, San Diego had the highest occupancy (81%), while New York City showed the lowest (51%). New Orleans, Washington, DC, and San Francisco all had weekly occupancy below 55%.
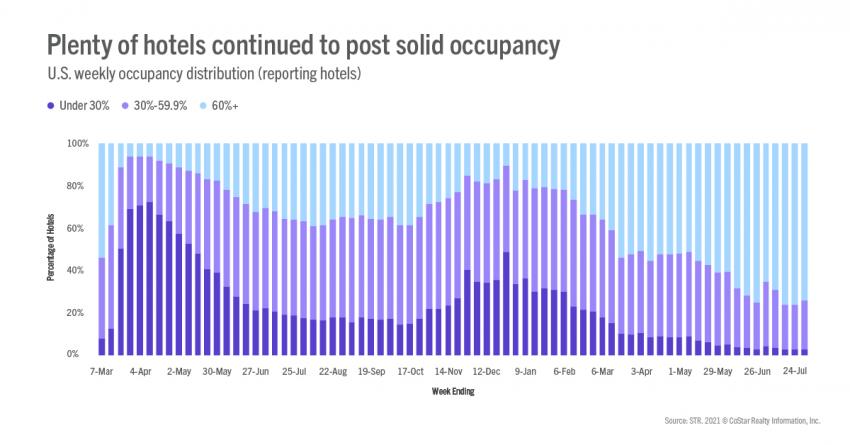
Property-level occupancy also shifted downward a bit with 74% of reporting hotels posting occupancy of 60% or more in the week, down from 76% in the previous fortnight. Twenty three percent of hotels reported weekly occupancy of less than 60%, up from 21% in the previous week. Three percent of hotels continued to see very low occupancy (less than 30%) with that percentage seeing little change in the past six weeks. Weekend occupancy stayed above 80% for a second consecutive week, and weekday occupancy reached another pandemic-era high (68%).
While nominal ADR hit a new record high, week-on-week growth was low (0.3%). The slowdown in weekly ADR growth was due to a drop in weekend ADR (-0.8%), the second such decline of the past eight weeks. ADR was up in the Top 25 Markets, where nominal ADR was the highest since the start of the pandemic. Outside of the Top 25, ADR showed the slightest gain but attained another nominal record at US$139. For the past six weeks, nominal ADR has been higher than in the comparable periods of 2019. On an inflation-adjusted basis (real), weekly ADR has been better than 2019 in three of the past six weeks with this week being one of the three.
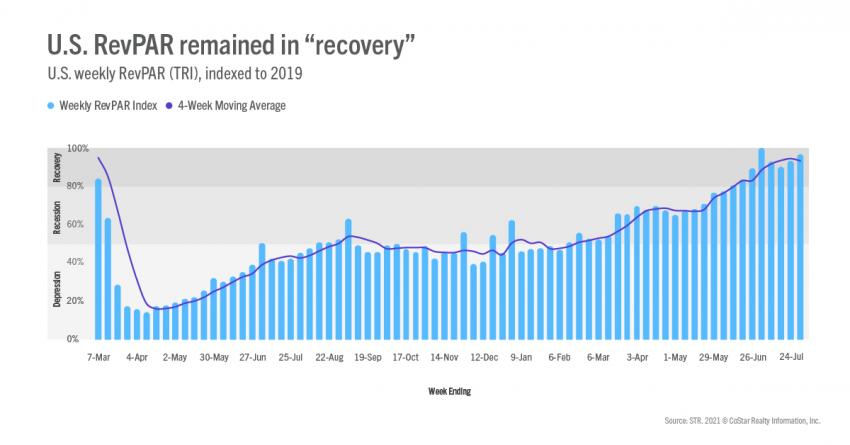
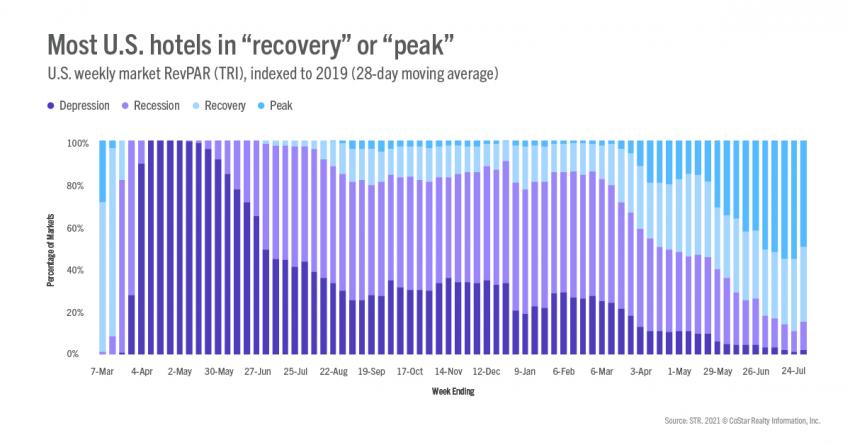
TRI RevPAR remained in the “recovery” zone with an index of 97 versus the same week of 2019 (“recovery” is defined as TRI RevPAR indexed to 2019 between 80 and 100). The industry has been in “recovery” for the past eight weeks. Real TRI RevPAR as been in “recovery” for the past six weeks. On a 28-day moving total basis, 85% of markets were either in “recovery” or “peak” (TRI RevPAR indexed to 2019 greater than 100), down from 89% the previous week. Three markets remained in the “depression” category (TRI RevPAR indexed to 2019 under 50) and 22 markets were categorized as being in “recession” (TRI RevPAR indexed to 2019 between 50 and 80). Two of the three markets in “depression,” San Francisco and San Jose, have been there since the start of the pandemic. New York City reentered the category this week after a brief exit last week. Six of the 10 markets with the highest TRI RevPAR index are in Florida with the remainder mostly in southeastern destination markets. The Florida Keys continued to have the highest TRI RevPAR index.
Outside of the U.S.
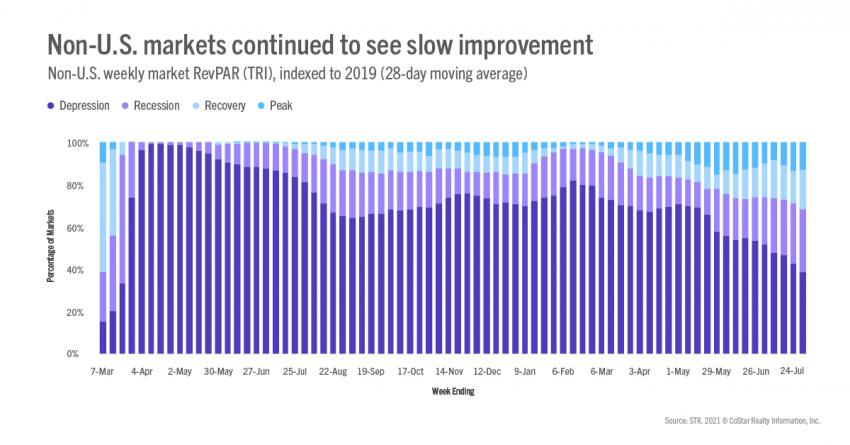
TRI occupancy fell 2.8 points to 42%, which was the largest decline in some time. The decrease was somewhat widespread across countries with China leading as COVID-19 cases rise. Among countries with the largest number of hotels, the U.K. saw another week of solid gains with TRI occupancy achieving a pandemic-era high of 64%. TRI occupancy was up in Canada and Germany. Canada’s TRI occupancy was at a new pandemic high (55%). Over the past 28 days, TRI RevPAR indexed to 2019 for non-U.S. markets in aggregate advanced to 60, meaning most non-U.S. markets are still in “recession.” Taking a closer look, the majority (39%) of non-U.S. markets were in “depression” with 30% in “recession.”
Taking a closer look, the majority (39%) of non-U.S. markets were in “depression” with 30% in “recession.”
Big picture
While not as strong as the previous week, results were solid but with indications that a change is in the making. Given the best of summer is behind us, we expect all metrics to soften as we move into the fall. Many operators have told us that they have solid bookings ahead but the increase in COVID-19 cases could derail performance in the short-term. As with summer, we believe holiday travel will be robust, but in between, we will likely see rough patches.
To learn more about the data behind this article and what STR has to offer, visit https://str.com/.


Sign up to receive our stories in your inbox.
Data is changing the speed of business. Investors, Corporations, and Governments are buying new, differentiated data to gain visibility make better decisions. Don't fall behind. Let us help.


Sign up to receive our stories in your inbox.
Data is changing the speed of business. Investors, Corporations, and Governments are buying new, differentiated data to gain visibility make better decisions. Don't fall behind. Let us help.